
 ?Mathematical formulae have been encoded as MathML and are displayed in this HTML version using MathJax in order to improve their display. Uncheck the box to turn MathJax off. This feature requires Javascript. Click on a formula to zoom.
ABSTRACT
The single-edged V-notch beam (SEVNB) method is considered as an effective method for evaluating the fracture toughness values of brittle materials. In this method, it is assumed that the V-notch is a natural crack. However, this assumption may cause an overestimation of the fracture toughness due to the “notch passivation effect”. To investigate the effects of the V-notch and groove tip angles on the fracture toughness testing of ceramic materials, three typical models were established in this work. The stress intensity factors of these models were calculated using a J-integral based on the linear finite element method (LFEM). The results indicated that the measured fracture toughness values could be overestimated by 0.5%- 13.7% when the angle of the V-notch tip increased from 10° to 60°. Increasing the angle formed by the V-notch and groove from 10° to 60°, fracture toughness was overevaluated by about 0% – 2.0%. When the angle formed by the V-notch and groove increased to 120°, the fracture toughness was overevaluated by about 31%. Finally, two equations were fitted to assess the angles effects on fracture toughness, and the results have been validated by experiments. An important reference for the SEVNB method can be found in this work.
1. Introduction
As an index of the mechanical properties of brittle ceramic materials, fracture toughness reflects the maximum resistance during crack growth, and it plays a vital role in the damage and destruction of ceramics [Citation1–3]. Accurate testing of the fracture toughness has been continuously studied by many researchers in the past few decades. Single-edged V-notch beam (SEVNB) method shows great application potential in this field [Citation4–6]. The SEVNB method was developed from the single-edged notch beam (SENB) method to improve the overestimation of the SENB method due to the “notch passivation effect” [Citation5]. In this method, a sharp V-notch at the root of the groove is prefabricated to eliminate the effect. Nishida et al [Citation7] studied the effect of notch root radius on the fracture toughness of Al2O3 ceramic with fine grain size. It is concluded that fracture toughness can be measured when the radius of the notch tip is less than 10 μm. Unfortunately, the traditional SEVNB method still overestimates the fracture toughness values of some fine-grained ceramic materials due to notch passivation effect [Citation6–11]. One modified method is to use an ultra-short pulsed laser to ablate a sharper V-notch at the groove root. According to the previous reports [Citation12–14], the tip radius of the V-notch ablated by a laser is less than 0.5 μm, which is less than size of the microstructure feature (average grain size) of most ceramics. However, the V-notch produced by a laser is still not a natural crack, the notch tip angle may have a significant effect on the fracture toughness test, for larger angle will shield the induction and propagation of the crack. In addition, the formula used in the SEVNB method by assuming the notch is a crack may be inappropriate. Thus, the applicability of the SEVNB method should be determined.
Fett [Citation15] first studied the SEVNB method with a model of a groove whose root was inserted in a real crack, and he recommended the following function:
where Kexp is the experimental stress intensity factor of the limited crack length (l) compared to the root radius of the groove root (ρ), Kth is the true stress intensity factor with a crack that is sufficiently long compared to the root radius of the groove root, and Y is the appropriate geometric correction factor. Y = 1.12 for a through-thickness edge crack. Fett [Citation10] further studied the relationship of real crack length and the groove root radius. It showed that if the groove root radius ρ > ρc (groove critical radius), spontaneous crack extension is possible. However, the ideal crack inserted at the root of groove may be not the same as a V-notch. Recently, Wang et al. [Citation16] studied the effect of the angle of the V-notch on fracture toughness testing with the linear finite element method (LFEM). They concluded that the fracture toughness would be overestimated when the V-notch tip angle was higher than 60°. However, they did not provide the accurate relationship between the angle and the stress intensity factor. Wang et al. [Citation17] also studied the angle of the V-notch during fracture toughness testing by assuming the V-notch was a natural crack. In addition, the angle of the notch tip is difficult to be processed and measured accurately in three-dimensional samples. Thus, the results may be not accurate enough for fracture toughness testing. In order to analyze the impact of the angle on the fracture toughness test in the SEVNB method in more detail, the width of the groove, the tip angle and length of the V-notch should be analyzed separately to better guide the fracture toughness test.
In this work, we aimed to study the relationship between the angle of the groove tip with a V-notch and the fracture toughness by the J-integral based on the LFEM. Based on this relationship, it is anticipated that a more accurate fracture toughness can be obtained when using the SEVNB method.
2. Experimental procedure
Zirconia powder with 2.3 mol% Y2O3 (2.3Y-TZP, Fan Meiya commercial materials Co. Ltd, Jiangxi, China), zirconia powder with 3 mol% Y2O3 (3Y-TZP Fan Meiya commercial materials Co. Ltd, Jiangxi, China), and Al2O3 (99.5% pure, Showa Denko, Japan) powder were used as the starting materials. Granulated raw materials were pressed into disks at 20 MPa in a steel die, and cold-pressed isostatically at 250 MPa for 3 min to obtain the green bars. The green bars of the 2.3Y-TZP and 3Y-TZP were sintered in air at 1450°C for 2 h in a MoSi2 resistance furnace (LHT 08/17, Nabertherm, Germany) at a heating rate of 5°C /min. The green bars of the Al2O3 were sintered in air at 1300°C for 2 h with a heating rate of 5°C /min. The densities of the sintered disks were measured in distilled water according to Archimedes’ principle, and the theoretical densities were assumed to be 6.08 g/cm3 for the TZP ceramic and 3.98 g/cm3 for the Al2O3 ceramic. All the measured relative densities of the investigated samples were larger than 98%. The sintered samples were ground into test bars with dimensions of 3 × 4 × 35 mm. A groove was machined by a diamond wheel with thickness of 200 μm at the center of 3 × 35 mm surfaces, and sharp V-notches with different lengths were fabricated at the bottom of the groove by a femtosecond laser (Chameleon ultra; Coherent, USA) with a power and scanning speed of 70 mW and 100 μm/s, respectively. Scanning electron microscopy (SEM; ZEISSEVO 18, Oberkochen, Germany) was used to measure the V-notch length (l) on the fractured surface, while optical microscopy (SZX 10, Olympus, Japan) was used to measure the depth of the groove (u) and the groove shape. All the test bars were tested in a mechanical test machine (Model 5567, Instron, USA) using a three-point flexure test configuration with a span of 30 mm and a constant loading rate of 0.05 mm/min. The fracture toughness values were calculated according to the ASTM C-1421 standard [Citation18], which assume the notch as a natural crack:
where a is the notch length which is equal to the V-notch length (vn) plus the depth of the groove (u); F is the fracture load; S is the span width; B is the sample width (3 mm); h is the sample height (4 mm); and Y is the dimensionless correction factor which can be calculated by the following formula:
The microstructures of the sintered samples were observed by scanning electron microscopy (SEM) on the polished surfaces. The phase compositions of the samples were analyzed by X-ray diffraction (XRD, X’pert PRO, Panalytical, Netherlands). The monoclinic phase volume fractions (Vm) of the 2.3Y-TZP and 3Y-TZP were calculated using the formula proposed by Toraya et al. [Citation19].
3. Linear finite element modeling (LFEM)
3.1. Geometric models
shows the SEM image of test bar with a groove and a V-notch for the SEVNB method test [Citation12]. The tip angle of the V-notch and the width of the groove have significant effects on the stress concentration at the tip of the V-notch. When the tip angle of the V-notch is sharper and the groove is narrower, the stress at the V-notch tip becomes more concentrated. Therefore, the tip angle of the V-notch, θ1, was used to study the effect of the V-notch morphology on the stress intensity factor testing, and θ2 was used to study the effect of the groove morphology and V-notch length on the stress intensity factor testing. The interaction of the laser and the material around the V-notch tip was studied by previous researchers [Citation20–22]. The results showed that although a thin molten region with a width of about 2 μm was produced on the V-notch surface by a laser, the effect of the molten region on the fracture toughness testing could be ignored.
Figure 1. SEM image of the groove and V-notch tilted by 30° [Citation12]. Two angles, θ1, and θ2, were used to control the morphology of the groove and V-notch, respectively.
![Figure 1. SEM image of the groove and V-notch tilted by 30° [Citation12]. Two angles, θ1, and θ2, were used to control the morphology of the groove and V-notch, respectively.](/cms/asset/84bfa138-0d60-4387-b1ce-9301fe5cfb70/tace_a_2156676_f0001_oc.jpg)
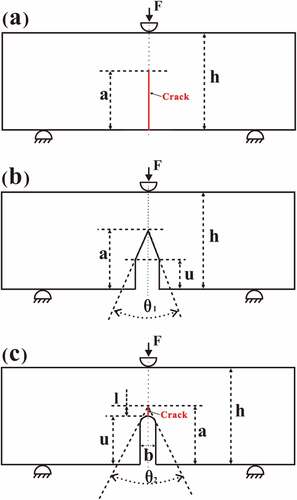
In order to analyze the influences of θ1 and θ2 on the accuracy of the fracture toughness testing by the SEVNB method in the three-point flexure test, three two-dimensional (2D) models were constructed. shows a schematic of the model with an ideal crack, that was used to calculate the theoretical stress intensity factor (K I/th) of an ideal crack tip. This model is referred to as the ideal crack model. shows the schematic diagram of the model of a groove with a V-notch root, which was marked as a non-crack model. The groove length and V-notch length are denoted by u and vn, respectively. This model was used to calculate the stress intensity factors (KI/θ1) corresponding to different θ1 values. The stress intensity factor of this model is only related to θ1 and does not depend on θ2, and it can be used to guide the processing of the V-notch. shows the schematic of the model of a groove with a semi-circle root, and a crack was implanted in the middle of the semi-circle root. This model is marked as groove model. The groove and crack lengths are denoted as u and l. This model is used to calculate the stress intensity factors (KI/θ2) corresponding to different θ2 values. The stress intensity factor of this model is only related to θ2 and does not depend on θ1, and it can be used to guide the processing of the groove and V-notch length.
Figure 2. Schematic diagrams of the three models; (a) ideal crack model, (b) non-crack model, (c) groove model. u is the groove length, l is the crack length, Vn is the V-notch length, a is the overall length of the flaw, defined as a = u + l + Vn. In the ideal crack model (a), u = 0, Vn = 0, and a = l; In the non-crack model (b), l = 0, a = u + Vn; In the groove model (c), Vn = 0, a = u + l.
3.2. Stress intensity factor
In this work, the stress intensity factor was calculated using the J-integral. The J-integral is an independent path line integral along a freely selected counterclockwise contour, Г, surrounding the crack tip. The J-integral is defined as follows:
where W is the strain energy density, which can be evaluated as:
T is the traction vector, defined as
where σij represents the stress components, εij represents the strain components, and ni represents the normal vector components. For a plane strain case and linear elastic materials, the stress intensity factor can be calculated based on the J-integral, as follows:
where E is Young’s modulus, and ν is the Poisson’s ratio.
3.3. Convergence study
The J-integral values of the models were determined by 2D finite element (FE) analysis which was performed by using ABAQUS (Dassault Systemes, USA). The ideal crack model is shown in and its crack tip is enlarged in . A circumference C with the crack tip as the center and radius R is proposed to facilitate the subsequent refinement of the grid near the crack tip. The typical meshed ideal crack model is shown in . The refined mesh within the circumference C is shown in . The type of the mesh within the circumference C was a four-node bilinear plane-strain quadrilateral with reduced integration, while that outside the circumference C was four-node bilinear plane strain quadrilateral without reduced integration. As shows, the number of nodes (red point) on the radius R was controlled to adjust the length L between the crack tip and the first point while the number of nodes (cyan point) on the circumference C was controlled to determine the average degree (η) of the circumference C. Global elements were used to limit the element size of the entire model. The convergence study results for the mesh refinement are is shown in . As shown by item B to H, the J-integral values decreased with the mesh refinement within the circumference C. The details are shown in . The J-integral decreased with the decrease in the angle η, and the J-integral did significantly decrease until item E. Although the angle of item E was reduced by half, the J integral was only reduced by 0.05%. Further reducing the angle by half, the J integral only increased by 0.002% (item H). Thus, the error of the J-integral calculated by the ideal crack model with the element parameters of item F was less than 0.1%. In order to study the effect of the global element size on the J-integral calculation, the smaller global element sizes (items I and J) were used to determine the J-integral values, which were less than that of item F by 0.014% and 0.026%, respectively. Therefore, in this work, the number of nodes on the circle C, the number of nodes on the radius R, and the global element size were 100, 50, and 0.05 mm, respectively. The corresponding length L and angle η were 1.603 μm and 3.616°, respectively. The uncertainties in the calculated J-integral values were assumed to be less than 0.1%. Convergence studies of the non-crack model and the groove model were also performed, but the details are not shown here. Results show that the uncertainties in the calculated J-integral value are less than 0.1%. The number of nodes on the circumference C, the number of nodes on the radius R, and global size were also 100, 50, and 0.05 mm, respectively, for the non-crack model and the groove model. The corresponding length L an angle η were 1.603 μm and 3.616°, respectively. The model material property parameters were those reported by Quinn et al. [Citation23], and they are listed in . shows the typical stress cloud (S11, along the length of the beam) images of the ideal crack model.
Figure 3. Grid-independent test of ideal crack model, (a) model diagram and node setting method and (b) global mesh generation map and enlarged mesh distribution map of the crack tip.
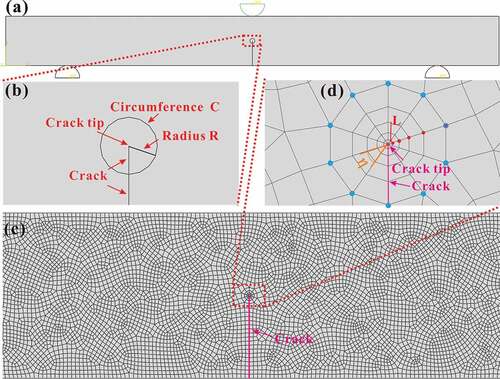
Figure 4. Variation of J-integral for an ideal crack model with varying angle (η).
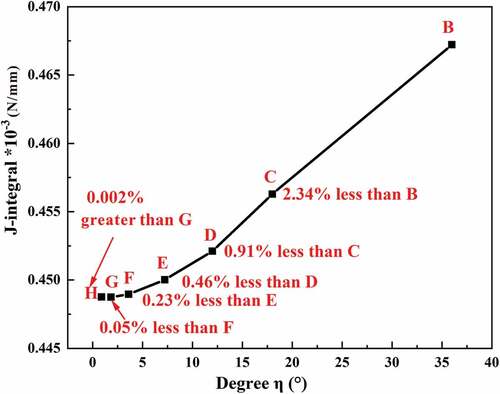
Figure 5. Global stress cloud image of ideal crack model and its stress cloud image enlarged at the crack tip.
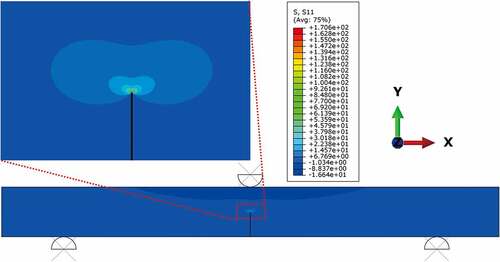
Table 1. Grid-independent test of ideal crack model.
Table 2. Reference values of model material parameters [Citation23].
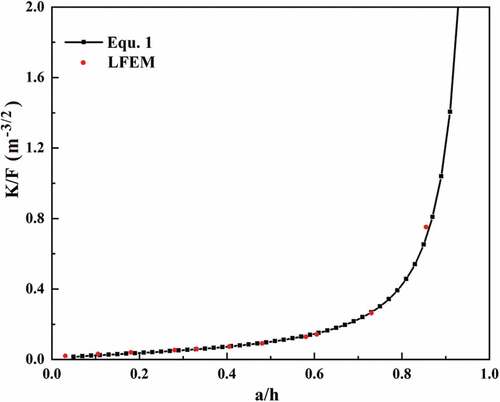
As shown in , the fitted LFEM results of the ideal crack model with different crack lengths were almost consistent with the ASTM C-1421 standard based on a natural crack (EquationEquation (2)(2)
(2) ).
Figure 6. Comparison of LFEM results with EquationEquation (2)(2)
(2) based on the ideal crack model for three-point bending configuration.
4. Results and discussion
4.1. Effect of V-notch tip angle (θ1) on fracture toughness measurement
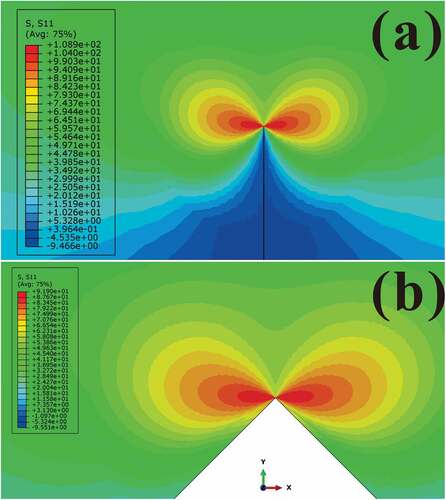
shows the stress distribution along the length of the beam (S11) in the crack tip of the ideal crack model and the V-notch tip of the non-crack model. As expected, the tensile stress distribution at the crack tip was highly concentrated in the ideal crack model, and its stress contour resembled a dumbbell. Near the crack surface, an equilateral triangle area with a stress close to zero was found, which is consistent with the result reported by Wang et al. [Citation16]. However, when the crack tip was enlarged, the two sides of the triangle near the crack tip became cambered, and closer to the crack tip, the angle (θ1) was smaller. This observation was not found in the report of Wang et al. [Citation16]. shows the non-crack model with a V-notch tip angle θ1 of 90°.The stress contour still resembled a dumbbell, although a part of the volume was removed compared to the ideal crack model. In addition, at the V-notch tip, no compressive stress area was found. Compared with the fracture load of sample with real crack, the large-angle V-notch will lead to the loss of part of the region with high elastic strain energy, so it will be unfavorable for crack induction and early propagation, and the fracture toughness of the material will be overestimated.
Figure 7. Typical tensile stress distribution of (a) ideal crack model and (b) non-crack model with a V-notch tip angle θ1 of 90°in a two-dimensional three -point bending beam by LFEM.
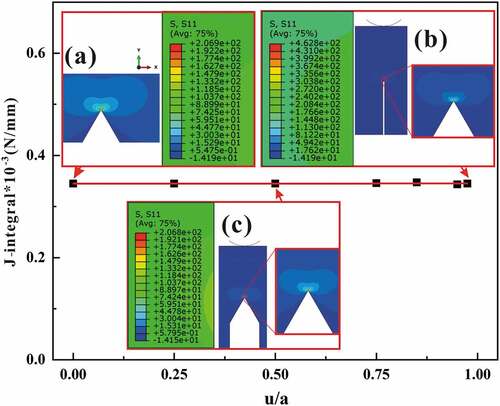
The non-crack model can be used to assess the effect of the angle of the V-notch tip θ1 on the fracture toughness testing by the SEVNB method. Before the assessment, the effect of the u/a value on the J-integral of the V-notch tip must be evaluated. shows the J-integral of the non-crack model with different u/a values and a constant V-notch tip angle of 60°. The stress cloud images (S11, along the beam length) of the non-crack model with u/a = 0, 0.5, 0.95 are shown in , respectively. The stress distributions at the V-notch tip were similar. Moreover, the J-integral value almost remained constant as the u/a value increased. Angles of the V-notch tip θ1 of 30°, 90°, and 120° were also studied, and the conclusions were the same as those with 60°. Thus, they are not shown in . Therefore, the effect of the u/a value on the J-integral of the V-notch tip in the non-crack model can be ignored. When u was almost equal to a, the width of the groove became very thin similar to the results shown in . Thus, the J-integral of the non-crack model only depended on the angle of the V-notch tip, and it is feasible to study the effect of the θ1 on the fracture toughness testing using the SEVNB method.
Figure 8. J-integral values of non-crack model with different u/a values and the stress cloud near the V-notch tip with (a) u/a = 0, (b) 0.5 and (c) 0.95, where the angle of the V-notch tip was maintained at 60°. The results when the angle of the V-notch tip θ1 was 30°, 90°, and 120° were the same as those at 60°, and they are not shown here.
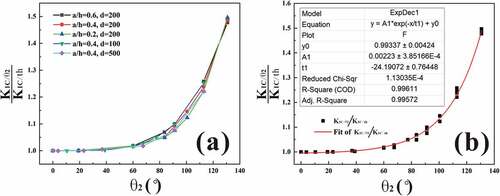
The influence of θ1 on the fracture toughness testing based on the non-crack model with u/a = 0 is shown in . KIc/th is the fracture toughness of ideal crack model. KIc/θ1 is the fracture toughness of the non-crack model with u/a = 0. KIc/θ1 also kept increasing as θ1 increased. To study the effect of the notch length (a) on the fracture toughness testing, three non-crack models with a/h values of 0.25, 0.5, and 0.75 were constructed. The results are shown in . The three non-crack models followed the same trend with the increase in θ1. This implied that θ1 had the same effect on the fracture toughness testing when a/h was in the range of 0.25–0.75. To further analyze the impact of θ1 on the fracture toughness testing using the SEVNB method, the results obtained by the non-crack model were fitted, as shown in . The relationship between θ1 and the relative fracture toughness, KIc/θ1/KIc/th can be described by the following equation:
Figure 9. KIc/θ1/KIc/th for various angles θ1 (a) and (b) fitted curve. Very good agreement was achieved with the data obtained from the non-crack model.
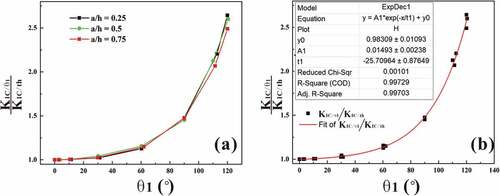
KIc/th can be calculated using EquationEquation (5)(5)
(5) , and the test error of the fracture toughness corresponding to different θ1 values can also be evaluated. For example, KIc/θ1 was higher than the KIc/th by 13.71% when θ1 was 60°. KIc/θ1 was higher than the KIc/th by 3.10% when θ1 was 30°. KIc/θ1 was just higher than KIc/th by 0.51% whenθ1 was 10°. This result was consistent with that of Palacios et al. [Citation24]. In their work, the fracture toughness values of tungsten alloy samples with notches produced by a laser were studied. The results showed that the actual fracture toughness values of the samples with θ1 values of about 5° could be obtained. The fracture toughness would be overevaluated by 21% when θ1 was 70°, which is consistent with the value calculate by EquationEquation 5
(5)
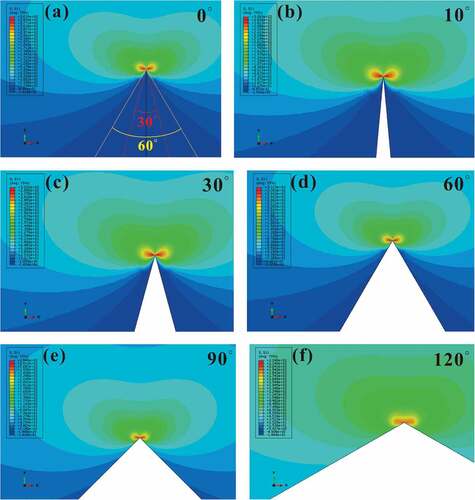
(5) . Wang et al. [Citation20] also studied the fracture toughness values of ZrB2 and ZrB2-SiC ceramic samples with θ1 value of 20° and 3°, respectively. They found that the fracture toughness values were overevaluated by 0.38% and 0.01% for ZrB2 and ZrB2-SiC ceramic samples, respectively, which was consistent with the result calculated using the non-crack model (1.56% and 0%, respectively). However, the results of this work are different from those reported by Wang et al. [Citation16]. In their work, KIc/θ1 was equal to KIc/th when the θ1 was less than 60°. The difference may have resulted from the assumption of perfect dumbbell-shaped stress contours. However, this assumption was not precise. As shown by the stress cloud of an ideal crack tip in , when θ1 was about 30°, the stress included in the V-notch region was close to zero. However, when θ1 reached 60°, although the stress was still close to zero in the region away from the V-notch tip, the stress near the V-notch tip reached higher levels. The stress cloud images of the non-crack model with θ1 value of 10°, 30°, 60°, 90°, and 120° are shown in , respectively. For θ1 value of 10° and 30°, an area with high stress concentration were reserved, and the stress in the removed area was close to zero when comparing with the stress cloud of natural crack (). However, the area with high stress concentration near the crack tip was eliminated when θ1 was greater than 60°. The fracture toughness of the V-notch with the tip at 60° may be overestimated due to the removal of the high stress area. This observation was basically consistent with the results of the simulation (EquationEquation (5)
(5)
(5) ).
Figure 10. (a) Stress cloud image of a typical ideal crack tip including two marked angles. The stress in the area for a 30° angle was close to zero, while the 60° angle included a large local stress area. Stress cloud image of non-crack models with θ1 value of (b) 10°, (c) 30°, (d) 60°, (e) 90°, and (f) 120°.
4.2. Effect of groove tip angle (θ2) on fracture toughness measurement
To study the influence of θ2 on the fracture toughness test, a groove model that was not affected by θ1 was established. In most cases, the V-notch is assumed to be a crack when testing the fracture toughness by the SEVNB method. Fett, et al [Citation15]. determined that the actual fracture toughness can be obtained when the length of the V-notch is longer than the sum of three-grain size scales of the sample materials. However, the fracture load increases due to the geometric shielding effect at the V-notch tip, leading to an overestimation of fracture toughness. Thus, different widths of the groove may need different lengths of the V-notch [Citation5,Citation15]. In this analysis, grooves with different groove widths were built, as shown in . As shown in , although the groove widths of 100 μm, 200 μm, and 500 μm were different, θ2 had the same effect on the fracture toughness testing results. In addition, different groove lengths were also studied. As shown in , the relative length a/h (0.2–0.6) had the same effect on the fracture toughness testing. To study the effect of θ2 on the fracture toughness testing, the data in were fitted, and the result is shown in and can be expressed as follows:
Figure 11. KIc/θ2/KIc/th for various values of angle θ2 (a) and the (d) fitted curve. Excellent agreement with the data was obtained by the groove model.
EquationEquationn (6)(6)
(6) shows that KIc /θ2 is higher than KIc/th by 0.5% when θ2 is 40°, and KIc/θ2 is higher than KIc/th by 2.0% when θ2 is 60°, while KIc/θ2 is higher than KIc/th by 31.1% when θ2 is 120°. EquationEquation (1)
(1)
(1) predicts that KIc/θ2 is higher than the KIc/th by 2.20% when θ2 is 60° (l = ρ), while KIc/θ2 is higher than KIc/th by 0.40% whenθ2 is 40° [Citation15]. These results were almost consistent with the results obtained by LFEM in this work. In addition, these results indicated that θ1 had more influence on the fracture toughness testing than θ2.
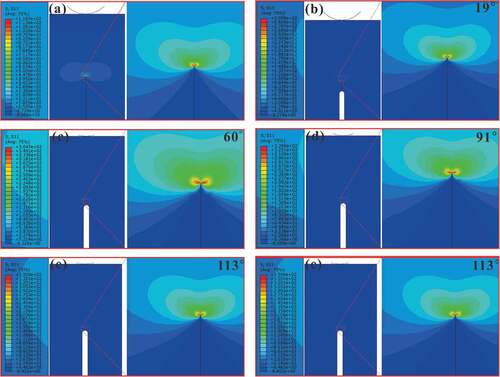
The stress cloud images of the groove with θ2 values of 0, 19°, 60°, 91°, 113°, and 131° are shown in . Regardless of the value of θ2 of the crack tip, the contour of the stress cloud images at the crack tip remained almost the same. Meanwhile, the stress distribution almost remained constant due to the large distance between the crack tip and the groove tip. This is the reason that θ1 had a greater impact on the fracture toughness test than θ2. The stress did not accumulate significantly for the groove tip far from the crack tip. Thus, θ2 has a weaker effect on the fracture toughness testing when using the SEVNB method. It seems that θ2 has a weaker effect than θ1 on the fracture toughness test. Although the width of the groove is usually less than 1 mm, the length of V-notch is generally 100 μm (the process of longer V-notch will lead to a decrease in the sharpness of the V-notch). Thus, a relatively narrow groove may lead to a larger θ2 due to the too small length of the V-notch. Even the V-notch is sharp enough, the large θ2 may shield the induction and propagation of the crack at the tip of the notch. Therefore, Both the length of V-notch and the width of the groove affect the stress concentration at the tip.
Figure 12. (a) Stress cloud images of a typical ideal crack tip. Stress cloud image of groove models with θ2 of (b) 19°, (c) 60°, (d) 91°, (e) 113°, and (f) 131°.
4.3. Experimental results and Discussion
shows the typical thermally etched microstructures of the investigated samples. The grains in all the samples had fairly equiaxed shapes and the average grain sizes were found to be about 500 nm, 550 nm and 1200 nm for 2.3Y-TZP, 3Y-TZP, and Al2O3, respectively. No residual pores were detected. These three ceramic materials have a dense and uniform microstructure, which is suitable for the research on linear elastic fracture of materials.
Figure 13. SEM images of the samples of (a) 2.3Y-TZP, (b) 3Y-TZP and (c) Al2O3.
The relationship between the fracture toughness test values of the three ceramic materials and the angle is shown in . This indicates that the fracture toughness tested by the SEVNB method increases as θ2 increases. In addition, the results predicted using EquationEquation (6)(6)
(6) are plotted in to compare with the experimental results. It is clear that the predicted curve fit well with the experimental values for the Al2O3 sample, while the fracture toughness values were slightly different for 2.3Y-TZP and 3Y-TZP in the high-angle area. The difference can be explained by the different R-curves of the three samples. As shown in , the volume fractions of the m-ZrO2 on the polished surface were zero, and the phase transformations on the fractured surface were 10 vol%, and 30 vol% for 2.3Y-TZP, and 3Y-TZP, respectively. Therefore, R-curve was steep to prevent the crack growth in the TZP samples, in contrast to the R-curves of Al2O3 samples reported in the literature [Citation25–27]. The cracks in the 2.3Y-TZP, and 3Y-TZP samples grew stably before fracture. Thus, the actual θ2 before fracture of the samples became larger. As shown in the predicted curves of 2.3Y-TZP and 3Y-TZP had light differences from the experimental data, but the predictions were the same as the experimental data in the Al2O3 samples for larger θ2 value. In addition, the fracture toughness values of the 3Y-TZP and Al2O3 samples were measured by the SEVNB method in our previous work [Citation28–30]. The morphologies of the V-notch and groove for 3Y-TZP and Al2O3 samples were also studied, θ1 was in the range of 20°- 30°, while θ2 was about 105° (). The fracture toughness was compared with the predicted result of EquationEquation (6)
(6)
(6) in . Although the fracture toughness reported in our previous work was overestimated because of the larger θ2, the relationship between the fracture toughness and θ2 was consistent with the results of this work, as shown in .
Figure 14. Experimental curve and curve predicted by EquationEquationn (6)(6)
(6) of the fracture toughness: (a) 2.3Y-TZP, (b) 3Y-TZP, and (c) Al2O3.
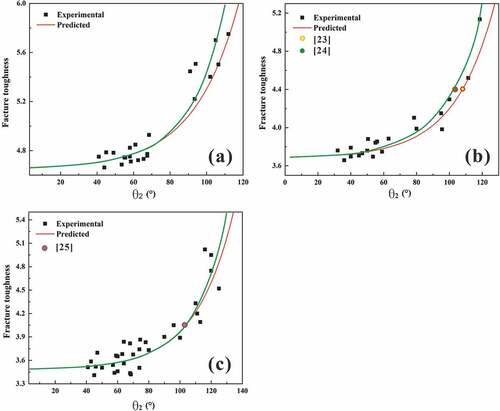
Figure 15. The XRD patterns of the (a) 2.3Y-TZP and(b) 3Y-TZP for the polished surface and fractured surface after fracture toughness testing. Vm, polished surface denotes the volume fraction of the phase transformation on the polished surface of the sample. Vm, fractured surface 1 is the volume fraction of the phase transformation on the fractured surface of the samples with small θ2, while Vm, fractured surface 2 is the volume fraction of the phase transformation on the fractured surface of the sample with a large θ2. m: monoclinic phase of zirconia, t: tetragonal phase of zirconia.
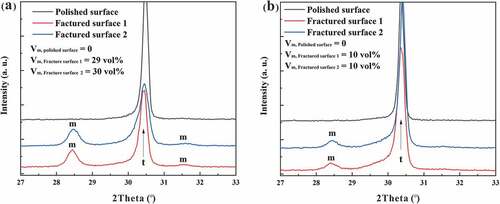
Figure 16. SEM images of (a) 3Y-TZP [Citation27], (b) Al2O3 [Citation29], and (c) 3Y-TZP [Citation28] samples with grooves and V-notches.
![Figure 16. SEM images of (a) 3Y-TZP [Citation27], (b) Al2O3 [Citation29], and (c) 3Y-TZP [Citation28] samples with grooves and V-notches.](/cms/asset/2dbf2d3b-0a1f-4ec4-afef-6e253ef0adef/tace_a_2156676_f0016_oc.jpg)
As listed in , the fracture toughness values of the 2.3Y-TZP, 3Y-TZP, and Al2O3 predicted by EquationEquation (6)(6)
(6) were 4.68 MPa•m1/2, 3.71 MPa•m1/2, and 3.50 MPa•m1/2, respectively. In this work, θ1 was in the range of 20°- 30°, and thus, the fracture toughness would be over-evaluated by about 1.56% – 3.10% according to the EquationEquation (5)
(5)
(5) . Therefore, the theoretical fracture toughness values of the 2.3Y-TZP, 3Y-TZP, and Al2O3 were 4.54–4.61 MPa•m1/2, 3.59–3.65 MPa•m1/2, and 3.39–3.45 MPa•m1/2, respectively. The average experimental fracture toughness values of the samples with θ1 less than 30° and θ2 less than 50° were 4.74 ± 0.06 MPa•m1/2, 3.76 ± 0.07 MPa•m1/2, and 3.54 ± 0.09 MPa•m1/2 for the 2.3Y-TZP, 3Y-TZP, and Al2O3 samples, respectively. The experimental fracture toughness values were very close to the predicted values. Thus, the fracture toughness values can be considered to be 4.6 MPa•m1/2, 3.6 MPa•m1/2, and 3.4 MPa•m1/2 for 2.3Y-TZP, 3Y-TZP, and Al2O3, respectively.
Table 3. Fracture toughness of 2.3Y-TZP, 3Y-TZP and Al2O3 samples.
Wang et al. [Citation17] studied the effect of the notch tip angle on the fracture toughness testing through experiments with typical brittle ZrB2 and ZrB2-SiC ceramics. When the notch tip angle was small, they used samples with only θ1 (typical samples are shown in ). When the notch tip angle was large, they used samples with θ1 and θ2 (typical samples are shown in ), and ignored the effect of θ1 on the fracture toughness testing. In addition, they used a non-crack model to compare with the experimental data. The results are shown in . The match between the experimental data and the prediction curve was poor when the notch tip angle was large. This deviation mainly arose from ignoring the influence of θ1 when the angle was large. As shown in , when θ2 was 50°, θ1 was only 9° which leads a limited effect for the fracture toughness values. However, as shown in , when θ2 was 140°, θ1 reached 21° which should not be ignored. The fracture toughness of the ZrB2 sample with θ1 and θ2 values of 21° and 140° predicted by its non-crack model was 4.5 MPa•m1/2, but those predicted by EquationEquation 5(5)
(5) (non-crack model) and EquationEquation 6
(6)
(6) (groove model) were both 4.7 MPa•m1/2. The result is marked in . The fracture toughness values predicted by EquationEquations 5
(5)
(5) and Equation6
(6)
(6) were closer to the average of the experiment values. The experiment data and the predictions by EquationEquations 5
(5)
(5) and Equation6
(6)
(6) are listed in . The fracture toughness (KIC/ref) can be obtained from the SEPB method, which can be considered to be the ideal crack model. For the non-crack model in the ZrB2 and ZrB2-SiC ceramics, the rate of the fracture toughness (KIC/SEVNB/KIC/Ref) obtained from the experiment were basically consistent with the prediction by EquationEquationn 5
(5)
(5) (KIC/SEVNB/KIC/th). In addition, in tungsten alloys, EquationEquation 5
(5)
(5) was also verified to yield good predictions [Citation24]. When θ1 was 50°, the fracture toughness of the test was overevaluated by 20%, and that predicted by EquationEquation 5
(5)
(5) was overevaluated by 21%. When θ1 was 3°, the experimental test could obtain the real fracture toughness, which was also consistent with that predicted by EquationEquation 5
(5)
(5) . For the ZrB2 material with the mixed model notch (non-crack model and groove model), when θ1 and θ2 were 9° and 50°, respectively, the test predicted that the fracture toughness would be overestimated by about 2%, and the fracture toughness values predicted by EquationEquations 5
(5)
(5) and Equation6
(6)
(6) would be overestimated by 1.5%. When θ1 and θ2 were 21° and 140°, the overestimation was 77.2%, as predicted by EquationEquations 5
(5)
(5) and Equation6
(6)
(6) , respectively, which was almost consistent with the average value of the test data as shown in . In general, different notch shapes may be used to assess the fracture toughness by the SEVNB method. Both EquationEquations 5
(5)
(5) and Equation6
(6)
(6) can be used to analyze the excessive fracture toughness values of samples with only V-notches and samples with mixed notches (V-notch + groove). This can be served as a reference for testing the real fracture toughness values of brittle materials.
Figure 17. (a) Experimental and predicted curves of KIc in ZrB2 and ZrB2-SiC specimens with various θ1 and θ2 values [Citation17]. Images of the notched test bars with θ1 of (b) 3°, (c) θ1 of 20°, (d) θ1 and θ2 of 9° and 50°, respectively, and (e) θ1 and θ2 of 21° and 140° [Citation17], respectively.
![Figure 17. (a) Experimental and predicted curves of KIc in ZrB2 and ZrB2-SiC specimens with various θ1 and θ2 values [Citation17]. Images of the notched test bars with θ1 of (b) 3°, (c) θ1 of 20°, (d) θ1 and θ2 of 9° and 50°, respectively, and (e) θ1 and θ2 of 21° and 140° [Citation17], respectively.](/cms/asset/66bb85e5-f2fa-47eb-a59d-82b6b60498d6/tace_a_2156676_f0017_oc.jpg)
Table 4. Fracture toughness values of materials with different θ1 and θ2 values.
5. Conclusion
In this work, two important angles in the fracture toughness testing of ceramic materials by the SEVNB method were proposed to determine the shape of the prefabricated notch and groove. The effects of the two angles on the measured fracture toughness were analyzed, and quantitative relationships (EquationEquation (5)(5)
(5) and (Equation6
(6)
(6) )) were obtained by LFEM and validated by experiments. The V-notch tip angle (θ1) had a significant influence on the tested fracture toughness, which was overevaluated by 13.7%, when the angle of the V-notch was 60°. When the angle formed by the V-notch and groove (θ2) was 60°, the fracture toughness was only overevaluated by 2.0%. The fracture toughness was overevaluated by about 31% when θ2 increased to 120°. As a result of this research, we can more accurately and reliably test the fracture toughness values of ceramic materials using the SEVNB method.
Acknowledgments
The authors also acknowledge the Northwestern Polytechnical University High-Performance Computing Center for the allocation of computing time on their machines. We thank LetPub (www.letpub.com) for its linguistic assistance during the preparation of this manuscript.
Disclosure statement
No potential conflict of interest was reported by the author(s).
Additional information
Funding
References
- Launey ME, Ritchie RO. On the fracture toughness of advanced materials. Adv Mater. 2009;21(21):03–10.
- Munz D. What can we learn from R -curve measurements? J Am Ceram Soc. 2007;90(1):1–15.
- Nose T, Fujii T. Evaluation of fracture toughness for ceramic materials by a single‐edge‐precracked‐beam method. J Am Ceram Soc. 2010;71(5):328–333.
- Kübler J, Fracture toughness of ceramics using the SEVNB method; round robin. VAMAS-Report No. 37, EMPA, Dübendorf, 1999.
- Picard D, Leguillon D, Putot C. A method to estimate the influence of the notch-root radius on the fracture toughness measurement of ceramics. J Eur Ceram Soc. 2006;26(8):1421–1427.
- Berto F, Lazzarin P. A review of the volume-based strain energy density approach applied to V-notches and welded structures. Theor. Appl. Fract. Mec. 2009;52(3):183–194
- Nishida T, Hanaki Y, Pezzotti G. Effect of notch-root radius on the fracture toughness of a fine-grained alumina. J Am Ceram Soc. 1994;77(2):606–608.
- Damani RJ, Gstrein R, Danzer R. Critical notch-root radius effect in SENB-S fracture toughness testing. J Eur Ceram Soc. 1996;16(7):02–695.
- Damani RJ, Schuster C, Danzer R. Polished notch modification of SENB-S fracture toughness testing. J Eur Ceram Soc. 1997;17(14):1685–1689.
- Fett T. Influence of a finite notch root radius on fracture toughness. J Eur Ceram Soc. 2005;25(5):543–547.
- Fischer H, Waindich A, Telle R. Influence of preparation of ceramic SEVNB specimens on fracture toughness testing results. Dent Mater. 2008;24(5):618–622.
- Zhao W, Rao P, Ling Z. A new method for the preparation of ultra-sharp V-notches to measure fracture toughness in ceramics. J Eur Ceram Soc. 2014;34(15):4059–4062.
- Turon-Vinas M, Anglada M. Fracture toughness of zirconia from a shallow notch produced by ultra-short pulsed laser ablation. J Eur Ceram Soc. 2014;34(15):3865–3870.
- Turon-Vinas M, Anglada M. Assessment in Si3N4 of a new method for determining the fracture toughness from a surface notch micro-machined by ultra-short pulsed laser ablation. J Eur Ceram Soc. 2015;35(6):1737–1741.
- Fett T, Munz D. Stress intensity factor and weight functions. Southampton: Computational mechanics publications; 1997.
- Wang X, Atkinson A. On the measurement of ceramic fracture toughness using single edge notched beams. J Eur Ceram Soc. 2015;35(13):3713–3720.
- Wang A, Du B, Hu P, et al. Reliable evaluation of fracture toughness in ceramics via nanosecond laser notching method. J Eur Ceram Soc. 2019;39(4):883–889.
- ASTM C1421-10, Standard test methods for determination of fracture toughness of advanced ceramics at ambient temperature, 2011.
- Toraya H, Yoshimura M, Somiya S. Calibration curve for quantitative analysis of the monoclinic-tetragonal ZrO2 system by X-Ray diffraction. J Am Ceram Soc. 1984;67(6):119–121.
- Wang A, Hu P, Zhang X, et al. Accurate measurement of fracture toughness in structural ceramics. J Eur Ceram Soc. 2017;37(13):4207–4212.
- Zhao W, Cui JP, Rao PG. Effect of molten zone ablated by femtosecond lasers on fracture toughness of Si3N4 measured by SEVNB method. J Eur Ceram Soc. 2018;38(4):2243–2246.
- Cui J, Gong Z, Rao P. Effect of molten zone ablated by femtosecond laser on fracture toughness of oxide ceramics. J Eur Ceram Soc. 2018;38(5):2440–2444.
- Quinn GD, Gettings RJ, Kübler JJ. Fracture toughness by the surface crack in flexure (SCF) method: results of the VAMAS round robin. Ceram Eng Sci Proc. 1994;15(5):846–855.
- Palacios T, Pastor JY. Influence of the notch root radius on the fracture toughness of brittle metals: nanostructure tungsten alloy, a case study. 2015;Int. J. of Refract. Met. H. Mater. 52:44–49.
- Hannink RHJ, Kelly PM, Muddle BC. Transformation toughening in zirconia containing ceramics. J Am Ceram Soc. 2000;83(3):461–87.[26].
- Gupta TK, Lange FF, Bechtold JH. Effect of stress-induced phase transformation on the properties of polycrystalline zirconia containing metastable tetragonal phase. J Mater Sci. 1978;13(7):1464–1470.
- Sakuma T, Eda H, Sato H. Composition optimization of ZrO2-Y2O3 alloys to improve the fracture toughness, Science and technology of Zirconia III. Sci. Technol. Zirconia III. Adv. Ceram. 1988;24A:357–363.
- Liu H, Zhao W, Ji Y, et al. Determination of fracture toughness of zirconia ceramics with different yttria concentrations by SEVNB method. Ceram Int. 2017;43(13):10572–10575.
- Zhao W, Peng C, Lv M, et al. Effect of notch depth on fracture toughness of Y-TZP and determination of its actual value. Ceram Int. 2015;41(1):869–872.
- Zhao W, Cui J, Rao P. Effect of thermal stress induced by femtosecond laser on fracture toughness of fine-grained alumina. J. Austr. Ceram. Soc. 2019;55(2):575–578