
 ?Mathematical formulae have been encoded as MathML and are displayed in this HTML version using MathJax in order to improve their display. Uncheck the box to turn MathJax off. This feature requires Javascript. Click on a formula to zoom.
ABSTRACT
In this study, the frequency and capacitance of piezoelectric materials due to compressive stress were analyzed, and the overall material properties (compliance matrix, piezoelectric charge constant and dielectric constant) of piezoelectric ceramics were optimized using parametric estimation methods. The piezoelectric ceramic used for optimization was KICET-PZT8, and the compressive stress was applied from a stress-free condition up to 50 MPa. As a result, with increasing compressive stress, the values of ,
and
tended to increase, while
and
increased and then decreased at 20 MPa or higher.
and
showed the maximum values at 40 MPa of compressive stress, with the values reaching 147 pC/N and 375 pC/N, respectively. These values were analyzed to have increased by 117% and 115%, respectively, compared to the stress-free condition. Additionally, the dielectric constant (
) was found to increase linearly with the applied compressive stress. The understanding of the changes in piezoelectric properties under various compressive stresses derived from this study is expected to be applicable in various ways for the design and application of piezoelectric devices using compressive stresses, including BLT.
1. Introduction
The lead zirconate titanate (PZT,) material is a representative piezoelectric ceramics which used as core materials for piezoelectric devices such as ultrasonic surgical instruments using BLT transducers and HIFU (High intensity focusing ultrasound) [Citation1–3]. For the design of these piezoelectric devices, structural design and performance prediction techniques using finite element analysis software are being utilized [Citation4–6]. However, devices developed using finite element analysis software often exhibit significant differences from their designed values in actual characteristics. This discrepancy arises because the material properties of piezoelectric ceramics, influenced by compressive stress during manufacturing and temperature changes in the operating environment, are not fully accounted for the design value. Therefore, in order to accurately predict the characteristics of piezoelectric elements through finite element analysis, it is necessary to apply the properties of piezoelectric ceramics that account for changes in external factors such as compressive stress.
In general, designing a piezoelectric device requires a full matrix comprising an elastic matrix ( or
), a piezoelectric charge constant (
or
), and a dielectric constant (
or
). However, existing studies on piezoelectric properties under pressure only provide partial properties, not the full matrix [Citation7–11]. The resonance method, which is commonly used to derive the full matrix, calculates the material properties through the measured frequency by manufacturing a specimen corresponding to a specific vibration mode. However, the resonance method requires a large number of specimens, and errors in polarization, sintering, and shape processing can affect the overall material properties, leading to inaccuracies in the final material properties. Specifically, in the case of the LE (length extension) mode, measuring changes in external factors such as compressive stress through the resonance method is very challenging, as the resonance frequency responds very sensitively, even to very small stress.
As a way to compensate for this problem, research such as optimization of parametric estimation using the minimum number of specimens is being conducted [Citation12,Citation13]. The parametric estimation optimization technique is the process of finding simulation results that match the experimental data. Optimization analysis requires nonlinear minimization techniques to obtain parameters. Nonlinear analysis techniques include Newton-conjugate gradient, regularization, and Nelder-Mead methods, etc. [Citation14–16]. Recently, studies on deriving a full matrix by applying a parametric estimation method using frequencies measured in TS (thickness shear) mode and TE (thickness extension) mode have been reported [Citation17,Citation18].
Therefore, this study employs a parametric estimation method to propose a novel approach for identifying the optimal point of alignment between experimental data and simulation results when applying compressive stress to piezoelectric material. For this purpose, the impedance and piezoelectric charge constant () were measured under compressive stress applied to the minimized specimens (RAD and TE), and the full matrix of the piezoelectric element was derived using FEM. Through this study, it is expected that performance prediction and structural design of piezoelectric devices under pressure will be improved and uncertainty will be reduced.
2. Method
2.1. Impedance characteristic analysis according to compressive stress
To measure the impedance characteristics according to compressive stress, specific device was introduced. schematically shows a device designed to analyze the characteristics of resonant frequency (fr), anti-resonant frequency (fa), and capacitance under compressive stress. The device consists of equipment for applying pressure to the specimen and an impedance analyzer (HP 4294A, Agilent). A commercial hydraulic system was used to apply the pressure, and the generated pressure was measured by the load cell. An insulator (alumina) was inserted into the upper and lower parts of the PZT specimen for insulation, and the changes in fr, fa, and capacitance characteristics due to stress were recorded through an impedance analyzer. Compressive stress was applied at 10 MPa intervals from the stress-free condition to a maximum of 50 MPa.
Figure 1. Experimental setup for impedance spectrum under the compressive pressure.
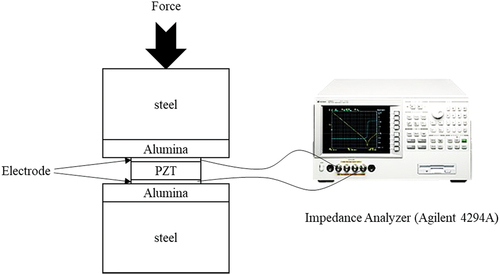
The piezoelectric element utilized in the experiment was a hard-type piezoelectric material commonly employed in BLT applications. The hard series of piezoelectric materials comprises PZT4 and PZT8. For this study, KICET-PZT8, which was developed as a piezoelectric material for BLT, was selected. KICET-PZT8 is a material with improved and permittivity characteristics compared to the existing PZT-8, and its material properties fall between those of PZT-8 and PZT-5A, as shown in [Citation19]. The specimen was fabricated in the form of a 16Φ ˟ 1 mm disk, capable of analyzing both radial and TE modes. Polarization was performed in a silicone oil bath at 120°C under the condition of 2 kV/mm.
Table 1. Full matrix of various PZT ceramic under stress-free condition.
shows the results of analyzing the impedance spectrum in Radial (rad1, rad2) mode and Thickness extension (TE) mode of KICET-PZT8 when there is no compressive stress. presents the values of the first resonant frequency (fr(rad1)), first anti-resonant frequency (fa(rad1)), second resonant frequency (fr(rad2)), and second anti-resonant frequency (fa(rad2)) in radial mode. The values for fr(rad1), fa(rad1), fr(rad2), and fa(rad2) were found to be 138 kHz, 160 kHz, 361 kHz, and 369 kHz, respectively. Therefore, the frequency range of the radial mode was set to 50 to 450 kHz. shows the impedance spectrum measurement result of the TE mode, with the resonant frequency (fr(TE)) and anti-resonant frequency (fa(TE)) measured at 2.04 MHz and 2.28 MHz, respectively, and the frequency range set from 1.8 MHz to 2.5 MHz. In addition, the frequencies selected for analyzing capacitance under compressive stress were determined to be 1 kHz and 4.5 MHz, which are more than twice the frequency of fa(TE) [Citation20].
Figure 2. Frequency range of KICET-PZT 8 in stress-free condition : (a) radial mode and (b) TE mode.
Finally, the piezoelectric charge constant analysis of the specimen was performed with d33-meter (PM-300, Piezotest) to determine and
. Measurements were conducted only in the absence of compressive stress, and the values were intended to be derived through the parametric estimation method to observe how they changed with applied compressive stress.
2.2. Optimization of material properties using parametric estimation method
illustrates the procedure for optimizing material properties according to compressive stress using the parametric estimation method. The parametric estimation method involves matching the impedance spectrum obtained in the experiment with the impedance spectrum result obtained through the finite element method (FEM). The model’s shape was designed to be identical to that of the actual test specimen using COMSOL Multiphysics® SW ver. 6.0 [Citation21].
Figure 3. Flowchart for the property analysis of KICET-PZT8 using parametric estimation method.
The initial material properties for the FEM simulation are calculated as initial values using the IEEE standard formula based on the measured values obtained through section 2.1 [Citation22]. The calculated initial value is then divided into fixed and variable parameters according to their degree of influence on the impedance spectrum. Fixed parameters are ρ, ,
and
, variable parameters are
,
, poisson’s ratio(ν) and
. Among them,
,
and
are obtained from Transvers shear (TS) mode which does not affect to the impedance spectrum of the radial and TE mode. On the other hand, it has been reported that the variable parameters
,
, poisson’s ratio(ν) and
have a great effect on the change in radial mode and TE mode impedance spectrum [Citation17,Citation18]. To analyze the effect on the impedance spectrum, an analysis was performed using FEM under the condition of no compressive stress. shows the effect of each parameters on the frequency change of the radial mode and TE mode. In the table, an arrow pointing to the left indicates a decrease in frequency, and an arrow pointing to the right indicates an increase in frequency. The number of arrows indicates the relative strength of each frequency change.
is a variable that particularly affects fr(rad1), and it was observed that the frequency decreases as its value increases.
influences the change in fa(rad1), with an increase in its value leading to an increase in fa(rad1). Poisson’s ratio is determined by Δf(fr(rad2)-fr(rad1)), and it was found to have the greatest effect on the value of fr(rad2), in particular. The variable that mainly influences the frequency of TE mode is
, and fr(TE) and fa(TE) decreased as its value increased.
Table 2. Effect of frequency on various parameters of KICET-PZT8 in radial and thickness mode.
3. Results and discussion
3.1. Impedance characteristics of PZT according to compressive stress
shows the experiment results of the impedance spectrum with an increase in compressive stress. In the figure, the black dotted line represents the stress-free condition, while the red dotted line and the blue solid line represent the impedance spectrum when compressive stresses of 20 MPa and 40 MPa are applied, respectively. The values of fr(rad1), fa(rad1), fr(rad2), and fa(rad2) in radial mode all increased as the pressure increased. For TE mode, fr(TE) increased, and fa(TE) decreased, indicating a narrowing gap between fr(TE) and fa(TE). presents the change histories of each frequency with the increase in compressive stress. shows the frequency change for fr(rad1) and fa(rad1) concerning the compressive stress. fr(rad1) increased almost linearly as the compressive stress increased, showing an increment of about 10% at 50 MPa.
Figure 4. Impedance spectrum of KICET-PZT8 obtained by experiment with various compressive stress: (a) radial mode, (b) thickness extension mode.
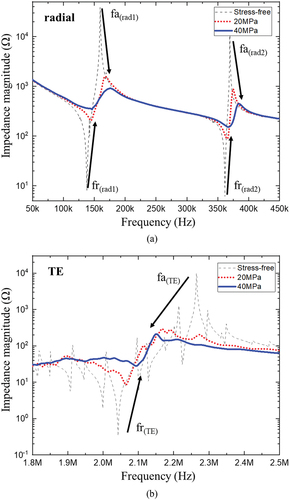
Figure 5. Frequency characteristics of KICET-PZT8 obtained by experiment according to compressive stress : (a) fr(rad1) and fa(rad1) (b) fr(rad2) and fa(rad2) (c) fr(TE) and fa(TE).
The frequency (fa(rad1)) increased linearly up to 40 MPa and then stabilized at a constant value. This change in frequency can be attributed to compressive stress, which induces domain switching in ceramic particles, thereby altering the crystal structure and, consequently, the material properties of the ceramic [Citation23]. In other words, it can be inferred that for KICET-PZT8, the application of stress at or above 40 MPa results in a significant alteration of the crystal structure, leading to changes in physical properties such as frequency. These findings align with a similar study on frequency variation under stress conducted by F.J. Arnold et al. [Citation24].
As a result, the changes in fr(rad1) and fa(rad1) induced a decrease in and an increase in
, respectively. indicates the frequency change of fr(rad2) and fa(rad2) according to the compressive stress, with fr(rad2) tending to increase linearly as the compressive stress increased. At 50 MPa of compressive stress, fr(rad2) increased by approximately 6% compared to the stress-free condition, and it was observed to be less affected than fr(rad1). In this case, the increased fr(rad2) is predicted to induce an increase in Poisson’s ratio and
. Furthermore, in the case of fa(rad2), it increased rapidly as the compressive stress increased from 20 MPa to 40 MPa but decreased after 40 MPa. presents the frequency change in TE mode. fr(TE) increases as the compressive stress increases, but decreases in the region of 40 MPa or more. On the contrary, fa(TE) decreased as the compressive stress increased, but increased in the region of 40 MPa or more. Compared to the stress-free condition, the maximum increase and decrease of fr(TE) and fa(TE) were found to increase by 3% and decrease by 6%, respectively, at 40 MPa. As a result, this means a decrease in the value of the coupling factor (
) in the thickness direction and is expected to additionally affect the change in the
value continuously through EquationEquations (1)
(1)
(1) to (Equation4
(4)
(4) ).
shows the capacitance characteristics according to the increase in compressive stress. As a result, the capacitance increased linearly according to the increase in pressure, and the maximum value was shown to increase by 44% and 48% at 1 kHz and 4.5 MHz, respectively.
Figure 6. Capacitance characteristics of KICET-PZT8 obtained by experiment according to compressive stress: (a) 1 kHz and (b) 4.5 MHz.
3.2. Prediction of piezoelectric properties of PZT according to compressive stress
shows the result of optimizing the compliance matrix calculated using the parametric estimation method. The result is normalized data for the convenience of analysis and is a graph showing the degree of change of each value compared to the origin value, with all values of the stress-free condition set as the origin value (set as 1). is a graph showing the value of according to the increase in compressive stress. In the experimental results, an increase in compressive stress resulted in an increase in fr(rad1), and accordingly, the value of
showed a tendency to decrease. The values obtained here were separated into
and
through EquationEquation (5).
(5)
(5)
Figure 7. Compliance matrix of KICET-PZT8 with increasing compressive stress using parametric estimation method: (a) (b) sE11 (c) -sE12 (d) -sE13 (e) sE33 and (f) sE66.
The changes in the values of and
, separated by EquationEquation (1)
(1)
(1) , are shown in . Although the value of
) decreased with the increase in compressive stress, the absolute values of
and
increased. This is because
, having a negative value, exhibited a larger change than
. As demonstrated in Section 3.1, the rise in the value of fa(rad2) resulting from an increase in compressive stress ultimately results in an increase in Poisson’s ratio. In essence, it can be inferred that the heightened Poisson’s ratio significantly influences the increase in
, as indicated by EquationEquation (6)
(6)
(6)
show the changes in the values of and
as the compressive stress increases. The
value showed a small change between 0.95 and 1.03 as the compressive stress increased, and then rapidly decreased to 0.71 at 50 MPa. In the case of
, it exhibited a small change from the stress-free condition to 40 MPa but greatly decreased to a value of 0.78 at 50 MPa. EquationEquation (7)
(7)
(7) shows the relationship between
and
, and the amount of change in
can be predicted through the value of
.
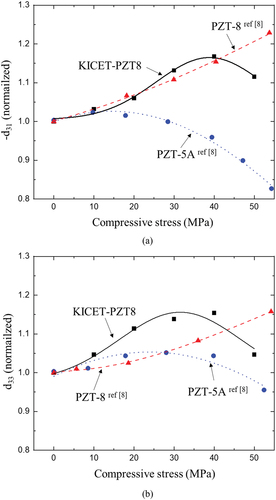
shows the change of with an increase in compressive stress, and it was found that the value increased as the compressive stress increased. presents the changes in the piezo charge constant values with respect to compressive stress. In the figure, the black solid line represents the values derived using the parametric estimation method, while the blue and red dotted lines show the results reported by Q. M. Zhang et al. [Citation8]. For KICET-PZT8, the value of -
and
increased to 1.17 and 1.15, respectively, compared to the stress-free condition, as the compressive stress increased, and then decreased after 40 MPa. As shown in the results of , the -
value of KICET-PZT8 showed a maximum value at a lower compressive stress than that of conventional PZT-8, suggesting its suitability for devices requiring lower compressive stress. Additionally, when compared to PZT-5A, KICET-PZT8 seems to maintain a high value even at relatively high compressive stress. compares the results of
, showing a similar trend to that of -
. However, KICET-PZT8 exhibited a larger increase in
than the existing PZT-8, suggesting that KICET-PZT8 can exhibit more advantageous piezoelectric performance under compressive stress of 40 MPa or less.
Figure 8. Piezoelectric constants of KICET-PZT8 with increasing compressive stress using parametric estimation method: (a) -d31 and (b) d33.
Finally, the overall material properties (full matrix) derived using the parametric estimation method are presented in . At 40 MPa, - and
of KICET-PZT8 showed values of 147 pC/N and 375 pC/N, respectively. Based on the above results, it can be confirmed that KICET-PZT8 can be used in a wider compressive stress range than the existing PZT-5A, and is relatively flexible compared to PZT-8, so it can be confirmed that it is a material with a higher piezoelectric charge constant at a compressive stress of 40 MPa. Consequently, it can be inferred that the appropriate compressive stress for the piezoelectric transducer using KICET-PZT8 is about 40 MPa.
Table 3. The properties of KICET-PZT8 under various compressive stress calculated using parametric estimation.
4. Conclusion
In this study, new method was devised to predict overall material properties (full matrix) of KICET-PZT8 piezoelectric ceramics under various compressive stresses ranging from 10 MPa to 50 MPa. To achieve this, a device was constructed to measure the impedance spectrum according to compressive stress, and as a result, changes in frequency and capacitance were observed.
As the compressive stress increased, fr(rad1) and fr(rad2) showed linear increments, with increases of 10% and 6%, respectively, compared to the stress-free condition. fa(rad1) increased with the increase in compressive stress, but the rate of increase decreased after 40 MPa. Similarly, fa(rad2) increased with the increase in compressive stress but decreased after 40 MPa. For TE mode, fr(TE) increased as the compressive stress increased but decreased in the region of 40 MPa or more. In contrast, fa(TE) decreased with the increase in compressive stress but increased in the region of 40 MPa or more. The results obtained through the experiment were derived as piezoelectric properties (compliance matrix, piezoelectric charge constant, and dielectric constant) using the parametric estimation method. Consequently, as the compressive stress increased, the values of , -
, and
increased, while -
and
showed no significant change with compressive stress but showed a significant decrease at 50 MPa. The piezo charge constants (-
,
) increased with the increase in compressive stress and then decreased at 50 MPa. Finally, the dielectric constant (
) showed a linear increase as the compressive stress increased.
The understanding of the changes in piezoelectric properties according to various compressive stresses derived from this study is expected to be applied in various ways to the design and application of piezoelectric devices using compressive stresses, including BLT. In the future, additional studies on the effects of external variables (temperature, time, etc.) on piezoelectric properties will be facilitated by employing the method used in this paper
Disclosure statement
No potential conflict of interest was reported by the author(s).
Additional information
Funding
References
- Niezrecki C, Brei D, Balakrishnan S, et al. Piezoelectric actuation: state of the art. Shock Vib Dig. 2001;33(4):269–280. doi: 10.1177/058310240103300401
- Haertling GH. Ferroelectric ceramics: history and technology. J Am Ceram Soc. 1999;82(4):797–818. doi: 10.1111/j.1151-2916.1999.tb01840.x
- Vijaya M.S. Piezoelectric materials and devices: applications in engineering and medical sciences. Boca Raton, FL: CRC press; 2013.
- Lerch R. Simulation of piezoelectric devices by two-and three-dimensional finite elements. IEEE Trans Ultrason Ferroelectr Freq Control. 1990;37(3):233–247. doi: 10.1109/58.55314
- Kim J, Varadan VV, Varadan VK. Finite element modelling of structures including piezoelectric active devices. Int J Numer Method Biomed Eng. 1997;40(5):817–832. doi: 10.1002/(SICI)1097-0207(19970315)40:5<817:AID-NME90>3.0.CO;2-B
- Nasedkin A, Solov’yev A. New schemes for the finite-element dynamic analysis of piezoelectric devices. J Appl Math Mech. 2002;66(3):481–490. doi: 10.1016/S0021-8928(02)00058-8
- Krueger HH. Stress sensitivity of piezoelectric ceramics: part 1. Sensitivity to compressive stress parallel to the polar axis. J Acoust Soc Am. 1967;42(3):636–645. doi: 10.1121/1.1910635
- Zhang QM, Zhao J. Electromechanical properties of lead zirconate titanate piezoceramics under the influence of mechanical stresses. IEEE Trans Ultrason Ferroelectr Freq Control. 1999;46(6):1518–1526. doi: 10.1109/58.808876
- Xie Z, Xu X. Experimental study on electro-mechanical response characteristics of PZT5H piezoelectric ceramics under impact loading. J Asian Ceram Soc. 2021;9(1):181–187. doi: 10.1080/21870764.2020.1860436
- Zhou D, Kamlah M, Munz D. Effects of uniaxial prestress on the ferroelectric hysteretic response of soft PZT. J Eur Ceram Soc. 2005;25(4):425–432. doi: 10.1016/j.jeurceramsoc.2004.01.016
- Yang G, Liu S, Ren W, et al. Effects of uniaxial stress on the piezoelectric, dielectric, and mechanical properties of lead zirconate titanate piezoceramics. Ferroelectrics. 2001;262(1):207–212. doi: 10.1080/00150190108225151
- Kybartas D, Lukoševičius A. Determination of piezoceramic parameters by the use of mode interaction and fitting of impedance characteristics. Ultragarsas/Ultrasound. 2002;45(4):22–28.
- Joo H-W, Lee C-H, Rho J-S, et al. Identification of material constants for piezoelectric transformers by three-dimensional, finite-element method and a design-sensitivity method. IEEE Trans Ultrason Ferroelectr Freq Control. 2003;50(8):965–971. doi: 10.1109/TUFFC.2003.1226540
- Kaltenbacher B, Lahmer T, Mohr M, et al. PDE based determination of piezoelectric material tensors. Euro J Appl Math. 2006;17(4):383–416. doi: 10.1017/S0956792506006474
- Lahmer T, Kaltenbacher M, Kaltenbacher B, et al. FEM-based determination of real and complex elastic, dielectric, and piezoelectric moduli in piezoceramic materials. IEEE Trans Ultrason Ferroelectr Freq Control. 2008;55(2):465–475. doi: 10.1109/TUFFC.2008.664
- Rupitsch SJ, Lerch R. Inverse method to estimate material parameters for piezoceramic disc actuators. Appl Phys A. 2009;97(4):735–740. doi: 10.1007/s00339-009-5438-1
- Shin H-Y, Lee H-Y, Hong I-G, et al. Piezoelectric property optimization for piezoelectric single crystals using parametric estimation. J Asian Ceram Soc. 2023;11(1):116–129. doi: 10.1080/21870764.2022.2161153
- Hong I-G, Shin H-Y, Kim J-H, et al. Two-step simulation of piezoelectric properties of porous PZT according to porosity. J Asian Ceram Soc. 2023;11(1):105–115. doi: 10.1080/21870764.2022.2159928
- Berlincourt D, Krueger H, Near C. Properties of Morgan electro ceramic ceramics. Technical Publication TP-226, Morgan Electro Ceramics; 2000.
- Joh C, Kim J, Roh Y. Determination of the complex material constants of PMN–28% PT piezoelectric single crystals. Smart Mater Struct. 2013;22(12):125027. doi: 10.1088/0964-1726/22/12/125027
- COMSOL Multiphysics® v. 6.0. Stockholm Sweden: COMSOL AB; 2021.
- IEEE standard on piezoelectricity. ANSI/IEEE standard. 1987;176: 10.1109/IEEESTD.1988.79638
- Arlt G. Twinning in ferroelectric and ferroelastic ceramics: stress relief. J Mater Sci. 1990;25(6):2655–2666. doi: 10.1007/BF00584864
- Arnold F, Mühlen S. The resonance frequencies on mechanically pre-stressed ultrasonic piezotransducers. Ultrasonics. 2001;39(1):1–5. doi: 10.1016/S0041-624X(00)00047-0