
 ?Mathematical formulae have been encoded as MathML and are displayed in this HTML version using MathJax in order to improve their display. Uncheck the box to turn MathJax off. This feature requires Javascript. Click on a formula to zoom.
ABSTRACT
Breakthrough infection of SARS-CoV-2 is a serious challenge, as increased infections were documented in fully-vaccinated individuals. Recipients with poor antibody response are highly vulnerable to reinfection, whereas those with strong antibody responses achieve sterilizing immunity. Thus far, biomarkers associated with levels of vaccine-elicited antibody response are still lacking. Here, we studied the antibody response of age- and gender-controlled healthy cohort, who received inactivated SARS-CoV-2 vaccines and profiled the B cell receptor repertoires in longitudinally consecutive samples. Upon vaccination, all vaccinated individuals displayed a convergent antibody response with shared common antibody clones and public neutralizing antibodies. Strikingly, poor vaccine-responders are distinguishable from strong vaccine-responders by a biased V-usage before vaccination and IgG to IgM mRNA ratio. These findings reveal molecular signatures associated with the different levels of vaccine-induced antibody response, which could be further developed into biomarkers for the design of vaccination strategies.
Introduction
The recent circulating SARS-CoV-2 variants, especially the newly emerged variants-of-concern (VOCs), have led to vaccine-breakthrough infections [Citation1], posing a great challenge to the current vaccination strategies. The breakthrough cases have been documented in fully vaccinated individuals receiving different types of COVID-19 vaccines, including the mRNA vaccine and inactivated vaccine [Citation2–7]. The heterogeneity in the human immune system [Citation8] could underlie the broad range of neutralizing antibody titres against the same virus, in COVID-19 patients [Citation9] and vaccinated individuals [Citation10–14].
In humoral immunity, antibody or immunoglobulin (Ig) can recognize specific antigen through its N-terminal variable region and activate downstream immune effects through its C-terminal constant region. The primary antibody repertoire is shaped through V(D)J recombination in developing B cells, in which different variable (V), diversity (D) and joining (J) gene segments are combined to form the Ig variable region exon [Citation15]. Upon antigen stimulation, B cells can further diversify the antibody gene by introducing mutations at Ig variable region exon by somatic hypermutation (SHM) to allow antibody affinity maturation and by switching the antibody class through class switch recombination (CSR) to change the downstream effector functions [Citation15]. The immune receptor sequencing and analysis method [Citation16] has revealed a diverse antibody repertoire in healthy individuals [Citation17,Citation18]. Although the common antibody clonotypes, defined by the V and J gene segment usage and complementarity-determining region 3 (CDR3) sequence, were discovered in different persons [Citation17,Citation18], the majority of the antibody repertoire is individualized, potentially contributing to the human immune variation.
The levels of antibody response vary among individuals. The vaccine recipients with lower neutralizing antibody titre are highly vulnerable to reinfection [Citation19]. Prediction of vaccine-induced immune response can design a precision vaccine strategy and identify the population that needs a further booster shot [Citation20]. Great efforts were made in the past to unravel the predictive immune variables of vaccine immunity [Citation21]. These associated signatures were discovered through system biology approaches, revealing intrinsic and extrinsic conditions affecting human antibody response.
The intrinsic features of antibody diversification, which can be assayed with blood draw samples, could associate with the vaccine-induced response and provide insights into understanding the process of B cell response to the vaccine. In this study, we recruited a cohort of 20 healthy people, who received the SARS-CoV-2-inactivated vaccine, and studied the B cell-intrinsic features associated with the antibody response. Known factors associated with vaccine-induced antibody response, like age, gender and body mass index (BMI) [Citation22], were controlled at the enrolment. We applied B cell receptor repertoire sequencing with the blood samples drawn before and after vaccination. SARS-CoV-2-inactivated vaccine induced a convergent antibody response with the emerging common clonotypes among the individuals while it heterogeneously neutralized antibody titres. Strikingly, antibody repertoire analysis of strong and poor responders revealed multiple B-cell intrinsic features associated with neutralizing antibody levels.
Material and methods
Study design and participants
Eligible participants were adults aged 23–32 years without a history of SARS-CoV-2 infection (nasopharyngeal swab PCR test negative and on-site inquiry). Gender and BMI were also considered at the study design. Most of the participants (90%) were females, and the mean BMI was 20.3 with an SD of 2.2. Detailed participant characteristics are listed in Supplementary Table 1. Participants received two doses of CoronaVac (Sinovac Life Sciences, Beijing, China, 600SU of inactivated SARS-CoV-2 antigen) on Days 0 and 21. The baseline blood samples and Day 21 blood samples were collected before vaccination. All participants proved written informed consent before participation in this study. This study was performed in compliance with an institutional review board protocol at the Sixth People’s Hospital of Shenyang (AF/SC-IRB-008-05.1).
Plasma surrogate virus-neutralizing test (sVNT) titre
Plasma sVNT titre was determined using a SARS-CoV-2 Neutralizing Ab detection kit (PerkinElmer SuperFlex Anti-SARS-CoV-2 Neutralizing Ab Kit, SDX-57042) following the manufacture’s protocol. Plasma was serially diluted before detection, 50 μl diluted sample was added to sample wells, and then mixed with 50 μl SARS-CoV-2 receptor-binding domain (RBD) protein labelled with acridinium ester. After 15 mins of incubation at room temperature, human ACE2 protein-coated magnetic particles were added to the mixture and incubated for another 15 mins. The unbound RBDs were washed out, and the reminiscent ACE2-bound RBD was determined by a chemiluminescence reaction. Signals were captured using PerkinElmer SuperFlex automatic chemiluminescence immunoassay analyser and converted to sVNT titre using a reference standard curve plotted with kit-suppled reagents. The calculated sVNT titre was determined by the reciprocal of the last dilution that resulted in > 50% reduction of chemiluminescence signal.
Plasma pseudotyped virus-neutralizing titre (pVNT)
Pseudotyped viruses incorporated with spike protein from SARS-CoV-2, variants or mutants were constructed following a procedure described by Nie et al [Citation23]. Briefly, 293T cells were prepared at the concentration of 5–7 × 10⁵ cell/ml before transfection. Then, 30μg of plasmid pcDNA3.1.VSVG (or plasmid pcDNA3.1.S2) was transfected according to the instruction. Afterwards, diluted G*ΔG-VSV (VSV G pseudotyped virus) at a concentration of 7.0 × 10⁴ TCID50/ml was added to further infect the previously transfected cells. After overnight incubation, the cell culture medium was discarded, and the cells were further incubated with fresh complete DMEM for another 24 h. Supernatants with SARS-CoV-2 pseudotyped viruses were harvested and stored at –80°C.
The 96-well flat-bottom culture plates were used to titrate the pseudotyped virus. A 10-fold initial dilution with six replicates was made, followed by serial 3-fold dilutions. The 50% tissue culture infectious dose (TCID50) was calculated using the Reed–Muench method. The serially diluted plasma samples were incubated with 200 TCID50 of pseudovirus at the final volume of 100μl at 37°C with 5% CO2 for 1 h, and the last column was used as the cell control without pseudotyped virus. Subsequently, the mixture was added to the culture of kidney epithelial cells extracted from an African green monkey (Vero-E6) with a DMEM complete medium. After 24 h incubation at 37°C with 5% CO2, the supernatant was discarded and its 100μl was left in each well, and then 100μl of the luciferase substrate (PerkinElmer, Cat#6066769) was seeded to each well. After 2-min incubation in darkness at room temperature, the cell completed lysis. The 50% inhibitory concentration (IC50) titre was determined by the reciprocal of the last dilution that resulted in > 50% reduction of luciferase activity.
Plasma S-RBD titre
The plasma S-RBD-binding titre was determined using a SARS-CoV-2 IgG Kit (SuperFlex Anti-SARS-CoV-2 IgG Kit, SARS-CoV-2-SG-RUO). Plasma was heat-inactivated for 30 min at 56°C. Twenty-microliter-diluted specimen was added to a well and then bound with the magnetic particles coated with SARS-CoV-2 S-RBD. After 10 mins of incubation at 35°C, acridinium ester labelled anti-human IgG antibody was added to form an immunocomplex. Afterwards, unbound substances were removed by washing. The luminescence value of the chemiluminescence reaction was measured. The results were presented in S/CO, where S and CO represented “Signal for test sample” and “Cut-off value”, respectively. The value (S/CO) was positively correlated with the concentration of the anti-SARS-CoV-2 IgG in the specimen.
IgH repertoire library preparation
Total RNA was prepared from 0.5 ml total blood cells using the Trizol reagent (Tiangen, DP424) following the manufacture’s protocol. Reverse-transcription was performed with ∼500 ng total RNA with random hexamers using Superscript III (Invitrogen, 18080051). IgH repertoire was amplified using 2x TransTaq High Fidelity PCR SuperMix II (Transgen, AS131-21) with BIOMED-2 primer sets (Table S2), and further barcoded with indicated primers (Table S2). The PCR amplicon was sequenced on an Illumina HiSeq platform.
Sequences analysis
The raw sequences were trimmed by applying Cutadapt (v. 1.14) and annotated with MiXCR. V3J clonotype was defined as a clone with the same V and J gene segments and CDR3 sequence. The output from MiXCR was subjected to further analyses:
Antibody diversity estimation: Two algorithms, Recon and Chao1[Citation18,Citation24], were used to estimate the number of missing V3J clonotypes based on the observed V3J clonotypes.
Clonotype Cluster: The V3J clonotypes were grouped into clusters to infer potential antibody lineage. Sequences with the same CDR3 lengths and VJ gene segments were divided to sub-groups. The Hamming distance between sequences in the same sub-group was calculated. Sequences with fewer than 3 amino acid mismatches in CDR3 were clustered and inferred as the same antibody lineage. For sequences from the same cluster, satisfyies: , where Sit is the tth sequence in ith cluster Ci. The antibody lineage tree was visualized based on the clonotype cluster. Within each cluster, a greedy strategy was applied to establish a topological relationship of the individual sequence, in which strategy undirected and acyclic graphs will be returned. The centre of the clustered sequences was determined by applying the one-hot encoding method, and the nearest sequence was assigned as the root.
Common clonotype definition: The common clonotype is defined as follows: Where
is the
common clonotype,
is the number of participants that
is shared at the
day; i = 1, 2, … , 20; j = 0, 3, 14, 21, 28, 35. Using k values from 2 to 10 the common clonotype was calcuated as presented in the figures.
CoV-Ab database data mining: SARS-CoV-2 neutralizing antibody sequences were retrieved from the CoV-Ab database[Citation25] as of July 15 2021. For each sequence, a similar clonotype was searched in clonotype clusters identified using IgH repertoires with the following criteria: . where
is the
sequence in
the cluster
,
is the
sequence in the CoV-Ab database
.
Antibody expression and purification
Four antibody heavy chains were picked from the antibody clonotype cluster, and the corresponding sequences were synthesized. A previously reported light chain from SARS-CoV-2 neutralizing antibody clone C140 [Citation26] was paired with the heavy chain. The heavy and light chains were cloned into human vector IgG2 and kappa expression vectors were expressed in HEK293S cells as previously described [Citation26]. Antibodies were purified using Protein G Sepharose and further analysed with SDS-PAGE to check protein purity.
Results
In this study, we recruited 20 volunteers from the Sixth People’s Hospital of Shenyang, who were confirmed to be SARS-CoV-2 negative by nasopharyngeal swab RT-qPCR test. Age, gender and BMI, associated with the humoral immune response to SARS-CoV-2[Citation12,Citation27,Citation28], were controlled at the recruitment. The median age of the participants was 24 (interquartile range, IQR 23.25–25) years, and the median BMI was 20.10 (IQR 19.20–22.03) kg/m2. Eighteen of the 20 participants were females. All participants completed the two-dose-inactivated vaccine immunization and scheduled visits between January 29t and March 2, 2021. Detailed cohort information is listed in Table S1. The prime and boost injections were given on day 0 and day 21, respectively ((A)). We collected longitudinal plasma and whole blood specimens of each participant. The first samples were drawn before the prime vaccination (day 0), and another five consecutive samples were collected on 3, 14, 21, 28 and 35 days after the prime injection ((A)). The early time-point samples offered us an opportunity to backtrack the relationship between B cell receptor repertoire and the magnitude of the humoral immune response.
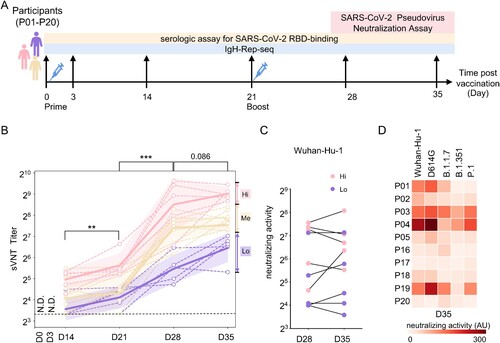
Figure 1. Plasma-neutralizing activity. (A) Schematic illustration of the study design. Two-dose inactivated vaccine was injected on days 0 and 21. The longitudinal samples were collected for serological tests and IgH repertoire sequencing. (B) Surrogate virus-neutralizing test (sVNT) was performed to measure the plasma-neutralizing activity using an ACE2-competition assay. An interval plot shows a 95% confidence interval for the mean of each group at different time points. P values were calculated from a paired two-tailed Student’s t-test. ***p < 0.001, **p < 0.01. N.D.: not detectable. A dashed line indicates the assay detecting threshold. Participants were arbitrarily divided into the Hi (upper quartile, pink), Me (the interquartile range, orange) and Lo (lower quartile, purple) groups based on the sVNT titres on day 35. (C) Plasma-neutralizing activity was measured with pseudotyped virus expressing SARS-CoV-2 spike (Wuhan-Hu-1) on days 28 and 35. The dot represents the activity in each participant. Hi and Lo groups are depicted as these in (B). (D) Neutralizing activity against pseudotyped viruses expressing indicated original and variant S proteins of samples collected on day 35.
Longitudinal analysis of plasma-neutralizing activity of SARS-CoV-2 and VOCs
We performed a surrogate virus-neutralizing test (sVNT) to quantify plasma-neutralizing antibodies (NAbs) using an ACE2-competition assay (PerkinElmer SuperFlex Anti-SARS-CoV-2 Neutralizing Ab Kit, SDX-57042). None of the plasma samples collected on Day 0 had detectable NAbs activity (Table S1), confirming no previous exposure to SARS-CoV-2. The sVNT titre significantly increased in the recipients along the vaccination process ((B)). One or two weeks after the boost, all samples were converted seropositive, and the sVNT titre reached its peak in each individual. There was a slight but non-significant increase in sVNT titre on day 35 than on day 28 ((B)). The highly heterogeneous distribution of sVNT titre two weeks after the second dose (Day 35) was consistent with those observed in the phase 1/2 clinical trials of inactivated vaccine [Citation29]. Based on these sVNT titre on Day 35, we arbitrarily separated the cohort into three groups; the top 25% percentile as the “High, Hi” group, the bottom 25% percentile as the “Low, Lo” group, and the rest as “Medium, Me” ((B)).
We took the plasma samples of the “Hi” and “Lo” groups on Days 28 and 35. Further, we confirmed their neutralizing activity using an assay of vesicular stomatitis virus (VSV)-based pseudotyped virus expressing SARS-CoV-2 spike [Citation23]. The plasma pseudovirus-based virus-neutralizing titre is highly correlated with the plasma sVNT titre (Figure S1A). The “Lo” sVNT titre group showed lower pseudotyped virus-neutralizing activity than the activity in the “Hi” group on Day 28 (p = 0.087) and Day 35 (p = 0.088) ((C) and Table S1). On day 35, no significant change of plasma pseudotyped virus-neutralizing activity was observed compared to that of day 28, despite a significant increase of plasma-neutralizing activity (3.3-fold) and sVNT titre (5.8-fold) in one individual from the “Hi” group ((C)).
We further used pseudovirus-based virus neutralization to measure the neutralizing activity against pseudotyped virus expressing S proteins from Wuhan-Hu-1 strain, D614G mutant or the current circulating VOCs, including B.1.1.7 (Alpha), B.1.351 (Beta), and P.1 (Gamma). Among the five tested strains, the plasma-neutralizing titre against pseudotyped virus expressing D614G mutant and Wuhan-Hu-1 strain are highly correlated (spearman correlation coefficient: 0.924, p < 0.001). Despite the heterogeneous immune response among the individuals, the neutralizing titres against the virus expressing the Wuhan-Hu-1 S protein highly correlated with the neutralizing titres against variants ((D)). However, the neutralizing activity against the pseudotyped virus with B.1.351 or P.1 variant was lower than that against the pseudotyped SARS-CoV-2 virus. With Day 35 samples, B.1.1.7, B.1.351, and P.1 were 1.5-fold, 2.9-fold and 1.5-fold less sensitive to vaccine-elicited antibodies than wild type, respectively ((D)). Similar decreased neutralizing activity against these VOCs was observed on Day 28 (Figure S1B). In addition, the longitudinal plasma spike RBD binding titres were measured (Figure S1C), which showed similar trends of increased RBD-binding along the vaccination process. The IgG-specific RBD-binding is highly correlated with neutralizing activity measured by sVNT (Figure S1D).
Global changes of antibody clonotype diversity upon vaccination
Immunoglobulin heavy chain (IgH) repertoires were prepared from cDNA of total blood cells (0.5 ml whole blood, estimated 60k–325k B cells [Citation30]) with indicated primer sets and profiled using deep sequencing (Table S2), which yielded an average of 1.1 million raw sequencing reads for each sample and 1.3 × 10⁸ raw reads in a total of 120 samples (Table S2). The antibody class determined by the IgH constant region and antibody V3J clonotype (same V and J gene segment, and same CDR3 amino acid sequence) encoded by the IgH variable region encoded were assigned with MiXCR [Citation31].
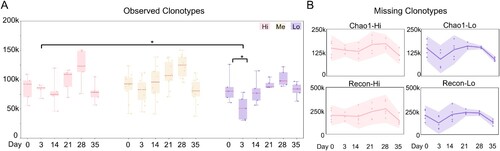
We used the V3J clonotype (defined by the variable region) as an indicator of antibody diversity. For each blood sample, we observed ∼ 30k–250k IgH V3J clonotypes (Table S2), which were fewer than the input B cell numbers. To estimate the missing clonotypes, we applied Recon and Chao 1 estimators to evaluate the antibody diversity [Citation17,Citation18]. Among the groups with high, medium and low sVNT titres ((B)), we consistently noed an increase in clonotype diversity on Day 28 in all the groups ((A)). Strikingly, a significant drop of clonotype numbers was observed on Day 3 in the “Lo” group, compared to that before vaccination or time-match samples in the other groups ((A)). The two estimators reported similar dynamic changes although Recon reports more missing clonotypes ((B) and S2). However, no serological difference in plasma neutralizing or RBD-binding was observed on Day 3 as those readouts were below the detection threshold ((B) and S1C). The decreased diversity of peripheral blood IgH repertoire on Day 3 in the “Lo” group could correlate with the low plasma-neutralizing activity at the later time points of the vaccination process (Day 35, (B)).
Figure 2. Antibody clonotype diversity analysis. (A) The observed IgH V3J clonotypes in sVNT groups are shown as box plots. Different sVNT groups are depicted in (B). Unpaired two-tailed student’s t-test reveals statistical differences between “Hi” and “Lo” samples on day 3 and between days 0 and 3 in “Lo” group samples. *p < 0.05. (B) The missing IgH V3J clonotypes in the indicated sVNT groups (“Hi” and “Lo”) are plotted as interval plots with a 95% confidence interval for the mean. Chao 1 and Recon are used to estimate the number of unobserved (missing) V3J clonotypes. Dots indicate numbers from each individual.
V-usage in groups with different antibody responses
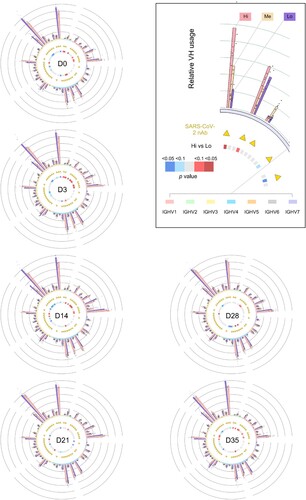
We further calculate the V and J gene segment use in all antibody classes frequencies along the vaccination in each individual. In all samples, a few V gene segments (VH1-18, VH3-11, VH3-23, VH4-34 and VH4-59) were predominantly used and took an average of 40% in the total IgH repertoire. Vaccination did not dramatically change the overall V gene usage pattern (one-way ANOVA analysis), e.g. the dominant VH usage (). Neither J gene usage (Figure S3A) nor CDR3 length (Figure S3B) significantly changed along B cell response upon vaccination.
Figure 3. Landscape view of antibody IgH repertoire upon along vaccination. The V gene segment usages at different timepoints are plotted as circos plots. In the outside bargraph, V-usage of each sample are shown by three sVNT groups, and the dot represents the number in each participant. V gene segments are grouped into 7 indicated families and plotted below the bar graph with different colours. V gene segments used by reported SARS-CoV-2 neutralizing-antibodies (nAb) are labelled with yellow triangles. Differential V gene segment usages between the sVNT “Hi” and “Lo” groups were calculated by applying an unpaired two-tailed student’s t-test. The p values are plotted as heatmaps in the inner circle. More V-usage in the sVNT “Hi” group is marked in red, and less V-usage in the sVNT “Hi” group is marked in blue.
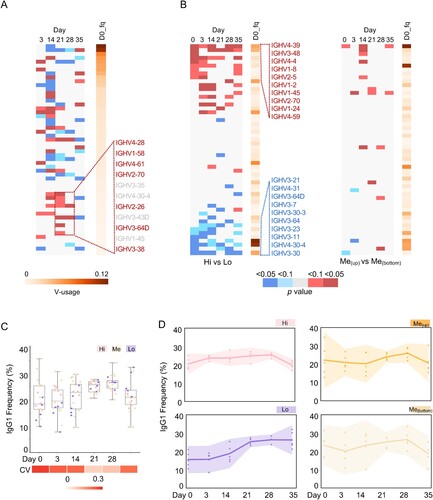
However, when the usage frequency of each VH was counted along vaccination, compared with that on Day 0, large perturbation was observed on Day 14, and the usage of a few underrepresented V genes (V3-38, V3-64D, V2-26, V2-70, V4-61, V1-58, V4-28; <0.5% in IgH repertoire on Day 0) was significantly increased on Day 21 or 28 ((A), Table S3). Next, we compared the V-usage frequency difference between the “Hi” and “Lo” groups and found that a panel of VHs were highly represented in “Hi” group vice versa ((B)). The relative enrichment of the same VHs was observed in IgM and IgG populations (Table S3), suggesting preferential V usage in naïve and other B cell populations. In the meantime, we also compared the V-usage in two subgroups from the “Me” group (five samples in each subgroup), and did not observe such difference ((B)). Thus, particular VHs could associate with the vaccine-induced antibody response.
Figure 4. Intrinsic features associated with antibody response. (A) Differential V-usage along the vaccination process of pooled samples. The V gene segments are arranged along the Y-axis based on its usage frequency on day 0 (left). For each V gene segment, usage frequencies were compared between the indicated timepoints and day 0. P values were calculated from an unpaired two-tailed student’s t-test and plotted as a heatmap. Compared with Day 0, a few underrepresented V genes (VH3-38, VH3-64D, VH2-26, VH2-70, VH4-61, VH1-58, VH4-28; < 0.5% in IgH repertoire at Day 0) were significantly increased on Day 21 or 28. (B) Differential V-usage between sVNT Hi and Low groups (left, five samples in each group), or between two sVNT groups in the interquartile range (right, five samples in each group). The top and bottom 10 represented V gene segments are shown separately. The V gene segments are arranged along the Y-axis by the p values calculated with an unpaired two-tailed student’s t-test. The V gene segments are arranged along the Y-axis with its usage frequency on day 0 (left). The V gene segment usage frequency on day 0 is also shown. Indicated scales are shown at the bottom of Panel B and C. Individual V gene segment names are listed in Supplementary Table 3. (D) The dynamic changes of IgG1 frequency along the vaccination process in different sVNT groups are shown as interval plots with a 95% confidence interval for the mean of each group. Dots indicate numbers from each individual.
Antibody class switch upon vaccination
We next analysed the antibody class from the IgH repertoires. In the pooled repertoire data, IgM formed nearly 38% of the total reads, while IgA1 and IgG1 formed about 36% and 23%, respectively (Figure S4A). The rest antibody classes presented a minor fraction in the peripheral blood IgH repertoires. We then examined the antibody classes in each individual. Before vaccination, the mean IgG1 + fraction in the repertoires was 22%, with a large variation (coefficient of variation, CV: 0.31) among the 20 individuals ((C)). Upon vaccination, the mean IgG1 + fraction reached 28% (Day 21, three weeks after the prime injection) and 29% (Day 28, one week after the booster shot) with relative smaller interpersonal variation (Day 21, CV: 0.09; Day 28, CV: 0.10) ((C)), indicating a strong vaccine-induced humoral immune response and good correlation with the increased plasma sVNT titre over time ((B)).
Next, we studied the kinetics of antibody class along the vaccination process in groups with different sVNT titres. Strikingly, the “Lo” group showed a distinct trend, compared to those in the “Hi” or “Me” group ((D)). The individuals in the “Lo” group had lower IgG1 + fraction measured not only before vaccination (mean: 15.2%) and also at the early time points ((D)). The IgG1 + fraction gradually increased to a similar level in the other two groups on Day 21 and 28 ((D)). In contrast, no detectable difference in IgA+ (combined IgA1 and IgA2) faction was observed among the three groups (Figure S4B). We also checked the frequency of IgG3 and found a similar trend in the “Lo” group, albeit not significantly (Figure S4C). The pool of all IgG classes revealed a similar phenotype as IgG1 (Figure S4D). Thus, the IgG class switch dynamics is associated with the differential immune response.
Convergent antibody response in vaccinated individuals
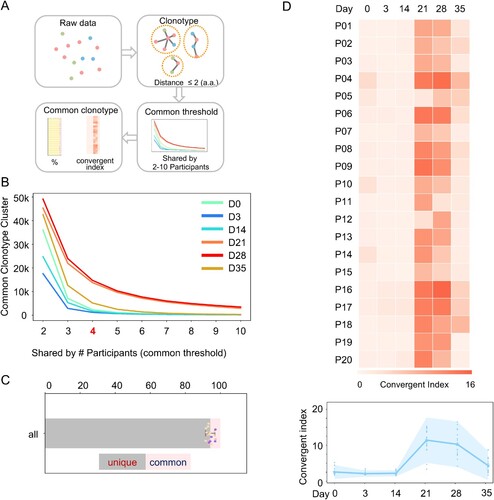
Some of the current defined IgH V3J clonotypes (same CDR3), have only a few mismatches in the sequences, which may be the product of SHM. Thus, we clustered the clonotypes by allowing 2 amino acid mismatches at CDR3 ((A)). We identified 3.7 million clusters from 12 million clonotypes. For each cluster, we calculated the numbers of participants harbouring this cluster at each time point. When we plotted the number of common clusters against the number of shared participants, we identified significant more shared clonotype clusters in the Day 21 and 28 samples ((B)). On day 35, the number of shared clusters decreased but still was higher than the numbers before vaccination and early time points after vaccination ((B)). We arbitrarily set a threshold index as 4 (shared by 4 individuals) and found that the common clusters only dominated a minor fraction in the IgH repertoires at each time points ((D)). At Day 21 and 28, a greater proportion of shared clonotype clusters was observed ((D)), suggesting a convergent antibody response. We further analysed the clusters in different sVNT titre groups and observed a similar convergent antibody response ((D) and S5). Thus, the convergent antibody response is a common feature upon vaccination.
Figure 5. Convergent antibody response among the vaccinated individuals. (A) Schematic illustration of the procedure to identify common antibody clonotypes. The antibody clonotypes were identified from the raw data and clustered by allowing 2 amino acid mismatches at CDR3. For each cluster, convergent response was determined by the co-occurrence of a particular clonotype cluster in difference individuals. Clonotype clusters shared by at least 4 individuals (threshold) were subjected to downstream analysis. The convergent index is defined as the percentage of common clonotype clusters in the total IgH repertoire. (B) The identified common clonotype cluster numbers when the different thresholds were applied. Samples from each timepoint are plotted with indicated colours. (C) The fraction of common and unique clonotypes in the total IgH repertoire, when the threshold is set as “4”. Each dot represents a number from each individual. (D) The IgH repertoire convergent index of each participant (P01-P20) along the different timepoint is shown as a heatmap (upper). A combined convergent index is shown as an interval plot (bottom) with the mean and 95% confidence interval. Dots indicate numbers from each individual.
Evolution of SARS-CoV-2-neutralizing antibodies in vaccinated individuals
In the COVID-19 pandemic, a few hundred SARS-CoV-2-neutralizing antibodies had been characterized. We downloaded 687 sequences of SARS-CoV-2-neutralizing antibodies from the CoV-Ab database [Citation25] and searched the IgH repertoires in our samples for similar V3J clonotypes by allowing one a.a. mismatch at CDR3 ((A)). Consistent with previous reports [Citation32,Citation33], pre-existing SARS-CoV-2-neutralizing antibody clonotypes were found before vaccination ((B)). However, the frequency of known pre-existing clonotypes did not predict the neutralizing antibody titres upon vaccination ((D) and (B)). With these 687 sequences, we found an increased frequency of these antibody clonotypes in the samples from Days 21, 28 and 35 ((B)), correlating with the increased sVNT titres in the time points ((C)). Again, the frequency of known SARS-CoV-2-neutralizing antibody clonotypes did not correlate with the sVNT titre on Day 28, suggesting these clonotypes comprised a small fraction in the whole repertoire or more neutralizing antibody clonotypes exist beyond the current knowledge.
Figure 6. SARS-CoV-2 nAb clonotypes in vaccinated individuals. (A) Schematic illustration of the procedure to identify known SARS-CoV-2 nAb clonotype in the IgH repertoires of vaccinated individuals. SARS-CoV-2 nAbs were retrieved from the CoVAb-Database. The SARS-CoV-2 nAb clonotypes were identified by allowing 1 amino acid mismatches at CDR3. (B) The frequency of SARS-CoV-2 nAb clonotype in the individual at the indicated timepoint is plotted as a heatmap. Scale is shown at the bottom. (C) A representative SARS-CoV-2 nAb clonotype phylogenetic tree is shown. The longitudinal distance indicates the absolute Hamming Distance of the CDR3 amino acid sequence between each node. Of each node, antibody class is indicated by colour, and the node size corresponds to the sequence counts. The clonotype with identical CDR3 sequence with the published SARS-CoV-2 nAb is marked with a star, and its CDR3 sequence is listed. For nodes with different antibody classes, an enlarged panel is shown at the bottom with an indicated magnitude. The sequence is named by participant number and timepoint, e.g. P13D0 indicates a sequence found in the repertoire of participant #13 on day 0. (D) Four antibodies were picked from the clonal cluster shown in Panel C. Recombination antibody protein was purified and tested in the pseudotyped virus-based neutralization assay.
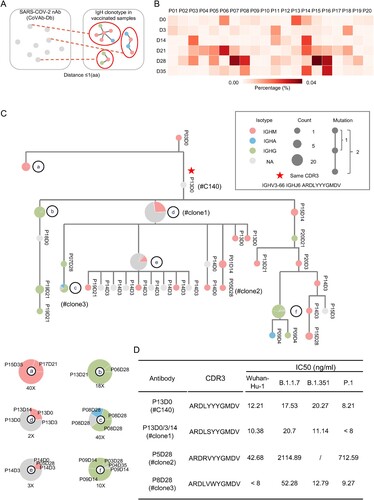
Combining all the IgH repertoires of known neutralizing antibodies from the current cohort, we observed their evolution relationship through a phylogenetic analysis. Approximately 16 antibody trees were identified across all the participants and time points. As shown in the phylogenetic tree, we observed on-going antibody CSR and the accumulated process of SHM. For example, the exact SARS-CoV-2-neutralizing antibody V3J clonotypes were retrieved in the cohort ((C) and Figure S6, star). In one of the exemplars ((C)), we found convergent antibody responses in different individuals (including P03, 04, 05, 06, 07, 08, 09, 13, 14, 15, 17, 18, 19, and 20), antibody CSR to IgG or IgA (Node C in (C)). Among the antibodies in this clonotype cluster, we picked four heavy chains and paired them with a light chain previously identified in a SARS-CoV-2-neutralizing antibody. The recombination antibody protein was purified and tested in a pseudotyped virus-neutralizing assay. The antibodies showed neutralizing activities against pseudotyped SARS-CoV-2 and VOC viruses ((D)). Thus, SARS-CoV-2 neutralizing antibodies can be convergently elicited by the inactivated vaccines in different individuals.
Discussion
Upon vaccination, different individuals elicit heterogeneous antibody responses, while the underline mechanism(s) is poorly understood. In this study, we studied the common and unique features of inactivated SARS-CoV-2 vaccine-induced antibody response with a special cohort, in which age, gender and BMI are strictly controlled. Convergent antibody response was observed in the vaccinated cohort, and known SARS-CoV-2-neutralizing antibodies were identified in different individuals. Furthermore, we observed several features associated with low antibody immune response, including a significant drop of antibody diversity at an early time point (Day 3), preferential usage of several VH gene segments, and different IgG class switch dynamics. Thus, beyond age, gender and other factors associated with antibody response, this study reveals molecular markers potentially associated with the antibody response levels. However, we cannot establish a causal relationship between these features and the magnitude of the immune response.
These uncovered features imply that B cell-intrinsic characteristics could contribute to the heterogeneous antibody responses of the population, in the context of virus infection or vaccination. The peripheral blood IgH repertoire assayed in the current study represents a small portion of circulating B cells, including naïve, memory B cells and plasma cells. The varied B cell biological processes, underlining the low IgG fraction or decreased diversity, represent interesting future lines of research. Appropriate cellular or animal models may be required to recapitulate the phenotypes observed in the human population. The human immune variation leads to heterogeneous post-vaccine responses [Citation34], even in the current cohort with many well-controlled factors (age, gender, etc.). In this context, the B cell receptor repertoire analysis from the drawn blood samples can reveal baseline predictors of antibody response [Citation35].
The inactivated SARS-CoV-2 vaccines have shown effective immune response in eliciting neutralizing antibodies in multiple clinic trials [Citation12,Citation13,Citation29,Citation36–38]. The human immune variation results in heterogeneous antibody responses and a broad range of neutralizing activity in the vaccinated individuals regardless of difference-formed vaccines [Citation10,Citation11,Citation14]. The emerging breakthrough infections caused by SARS-CoV-2 variants pose a serious challenge, and the plasma-neutralizing activity from vaccinated peoples against several variants significantly decreased [Citation14,Citation39] (). However, the individuals in the high plasma sVNT titre group still showed higher neutralizing activity against VOCs, vice versa (). In this context, biomarkers associated with antibody response should be of great value to design a future vaccination strategy.
Limitations of the study: Because of the nature of the real-world study, we note that our study was limited in some respects. First, the size of the studied cohort (n = 20) is limited as we applied a stringent enrolment criterion. Although the participants’ race, age, gender and BMI are well-controlled and they live in the same area, the genetic background of the participants was not assayed in the study. Additionally, the collected blood cell samples were frozen in Trizol reagent, which is only suitable for several molecular assays. Immune cell profiling was not performed using cell cytometry or other cellular assays. The underlying mechanisms of the current descriptions need further experimental validation and extensive investigation.
Supplemental Material
Download Zip (390.5 KB)Acknowledgements
We thank all participants in the study; Peiyao Li, Liu Daisy Liu, Pengfei Dai, Yapeng Hao, Dengzhan Wang, Fubin Li and Ningshao Xia for technical supports. W.Z, H.L, F.L.M, J.A and C.Q conceived of the experiments. K.L, Y.Z, S.Z analyzed the data with inputs from Y.A.Z, J.A, C.Q and X.Z. Experiments were performed by K.L, Y.Z, H.W, H.Z, Y.Z, Z.F, D.L, Y.O.W, S.S, Q.L, and Y.G. We thank for the support from Shanghai Key Laboratory of Infectious Diseases and Biosafety Emergency Response, and Key Discipline Construction Plan from Shanghai Municipal Health Commission.
Disclosure statement
No potential conflict of interest was reported by the author(s).
Additional information
Funding
References
- Team CC-VBCI. COVID-19 Vaccine breakthrough infections reported to CDC – United States, January 1–April 30, 2021. MMWR Morb Mortal Wkly Rep. 2021;70(21):792–793.
- Pollett SD, Richard SA, Fries AC, et al. The SARS-CoV-2 mRNA vaccine breakthrough infection phenotype includes significant symptoms, live virus shedding, and viral genetic diversity. Clin Infect Dis. 2021 Jun 12:ciab543. DOI:10.1093/cid/ciab543.
- Kroidl I, Mecklenburg I, Schneiderat P, et al. Vaccine breakthrough infection and onward transmission of SARS-CoV-2 Beta (B.1.351) variant, Bavaria, Germany, February to March 2021. Euro Surveill. 2021 Jul;26(30):2100673. DOI:10.2807/1560-7917.ES.2021.26.30.2100673.
- Strafella C, Caputo V, Guerrera G, et al. Case report: SARS-CoV-2 infection in a vaccinated individual: evaluation of the immunological profile and virus transmission risk. Front Immunol. 2021;12:708820.
- Duerr R, Dimartino D, Marier C, et al. Dominance of alpha and iota variants in SARS-CoV-2 vaccine breakthrough infections in New York City. J Clin Invest. 2021 Sep 15;131(18):e152702. DOI:10.1172/JCI152702.
- Hacisuleyman E, Hale C, Saito Y, et al. Vaccine breakthrough infections with SARS-CoV-2 variants. N Engl J Med. 2021;384(23):2212–2218.
- Estofolete CF, Banho CA, Campos GRF, et al. Case study of two post vaccination SARS-CoV-2 infections with P1 variants in CoronaVac vaccinees in Brazil. Viruses. 2021;13(7):1237.
- Brodin P, Davis MM. Human immune system variation. Nat Rev Immunol. 2017;17(1):21–29.
- Chen Y, Zuiani A, Fischinger S, et al. Quick COVID-19 healers sustain anti-SARS-CoV-2 antibody production. Cell. 2020;183(6):1496–1507.e16.
- Jackson LA, Anderson EJ, Rouphael NG, et al. An mRNA vaccine against SARS-CoV-2 – preliminary report. N Engl J Med. 2020;383(20):1920–1931.
- Sahin U, Muik A, Derhovanessian E, et al. COVID-19 vaccine BNT162b1 elicits human antibody and TH1 T cell responses. Nature. 2020 Oct;586(7830):594–599.
- Wu Z, Hu Y, Xu M, et al. Safety, tolerability, and immunogenicity of an inactivated SARS-CoV-2 vaccine (CoronaVac) in healthy adults aged 60 years and older: a randomised, double-blind, placebo-controlled, phase 1/2 clinical trial. Lancet Infect Dis. 2021;21(6):803–812.
- Xia S, Zhang Y, Wang Y, et al. Safety and immunogenicity of an inactivated SARS-CoV-2 vaccine, BBIBP-CorV: a randomised, double-blind, placebo-controlled, phase 1/2 trial. Lancet Infect Dis. 2021;21(1):39–51.
- Wang Z, Schmidt F, Weisblum Y, et al. mRNA vaccine-elicited antibodies to SARS-CoV-2 and circulating variants. Nature. 2021;592(7855):616–622. doi:10.1038/s41586-021-03324-6.
- Alt FW, Zhang Y, Meng FL, et al. Mechanisms of programmed DNA lesions and genomic instability in the immune system. Cell. 2013;152(3):417–429.
- Nielsen SCA, Boyd SD. Human adaptive immune receptor repertoire analysis-past, present, and future. Immunol Rev. 2018;284(1):9–23.
- Briney B, Inderbitzin A, Joyce C, et al. Commonality despite exceptional diversity in the baseline human antibody repertoire. Nature. 2019;566(7744):393–397.
- Soto C, Bombardi RG, Branchizio A, et al. High frequency of shared clonotypes in human B cell receptor repertoires. Nature. 2019;566(7744):398–402.
- Bergwerk M, Gonen T, Lustig Y, et al. Covid-19 breakthrough infections in vaccinated health care workers. N Engl J Med. 2021 Oct 14;385(16):1474–1484. DOI:10.1056/NEJMoa2109072.
- Tsang JS, Dobano C, VanDamme P, et al. Improving vaccine-induced immunity: can baseline predict outcome? Trends Immunol. 2020;41(6):457–465.
- Pulendran B. Immunology taught by vaccines. Science. 2019;366(6469):1074–1075.
- Zimmermann P, Curtis N. Factors that influence the immune response to vaccination. Clin Microbiol Rev. 2019 Mar 13;32(2):e00084–18. DOI:10.1128/CMR.00084-18.
- Nie J, Li Q, Wu J, et al. Quantification of SARS-CoV-2 neutralizing antibody by a pseudotyped virus-based assay. Nat Protoc. 2020;15(11):3699–3715.
- Kaplinsky J, Arnaout R. Robust estimates of overall immune-repertoire diversity from high-throughput measurements on samples. Nat Commun. 2016;7:11881.
- Raybould MIJ, Kovaltsuk A, Marks C, et al. CoV-AbDab: the coronavirus antibody database. Bioinformatics. 2021;37(5):734–735.
- Robbiani DF, Gaebler C, Muecksch F, et al. Convergent antibody responses to SARS-CoV-2 in convalescent individuals. Nature. 2020;584(7821):437–442.
- Gao M, Piernas C, Astbury NM, et al. Associations between body-mass index and COVID-19 severity in 6.9 million people in England: a prospective, community-based, cohort study. Lancet Diabetes Endocrinol. 2021;9(6):350–359.
- Takahashi T, Ellingson MK, Wong P, et al. Sex differences in immune responses that underlie COVID-19 disease outcomes. Nature. 2020;588(7837):315–320.
- Zhang Y, Zeng G, Pan H, et al. Safety, tolerability, and immunogenicity of an inactivated SARS-CoV-2 vaccine in healthy adults aged 18-59 years: a randomised, double-blind, placebo-controlled, phase 1/2 clinical trial. Lancet Infect Dis. 2021;21(2):181–192.
- Wong WS, Lo AW, Siu LP, et al. Reference ranges for lymphocyte subsets among healthy Hong Kong Chinese adults by single-platform flow cytometry. Clin Vaccine Immunol. 2013;20(4):602–606.
- Bolotin DA, Poslavsky S, Mitrophanov I, et al. MiXCR: software for comprehensive adaptive immunity profiling. Nat Methods. 2015;12(5):380–381.
- Ng KW, Faulkner N, Cornish GH, et al. Preexisting and de novo humoral immunity to SARS-CoV-2 in humans. Science. 2020;370(6522):1339–1343.
- Paschold L, Simnica D, Willscher E, et al. SARS-CoV-2-specific antibody rearrangements in prepandemic immune repertoires of risk cohorts and patients with COVID-19. J Clin Invest. 2021 Jan 4;131(1):e142966. DOI:10.1172/JCI142966.
- Tsang JS, Schwartzberg PL, Kotliarov Y, et al. Global analyses of human immune variation reveal baseline predictors of postvaccination responses. Cell. 2014;157(2):499–513.
- Davis MM, Brodin P. Rebooting human immunology. Annu Rev Immunol. 2018;36:843–864.
- Xia S, Duan K, Zhang Y, et al. Effect of an inactivated vaccine against SARS-CoV-2 on safety and immunogenicity outcomes: interim analysis of 2 Randomized Clinical trials. JAMA. 2020;324(10):951–960.
- Al Kaabi N, Zhang Y, Xia S, et al. Effect of 2 inactivated SARS-CoV-2 vaccines on symptomatic COVID-19 infection in adults: a randomized clinical trial. JAMA. 2021;326(1):35–45.
- Han B, Song Y, Li C, et al. Safety, tolerability, and immunogenicity of an inactivated SARS-CoV-2 vaccine (CoronaVac) in healthy children and adolescents: a double-blind, randomised, controlled, phase 1/2 clinical trial. Lancet Infect Dis. 2021 Dec;21(12):1645–1653. DOI:10.1016/S1473-3099(21)00319-4.
- Cao Y, Yisimayi A, Bai Y, et al. Humoral immune response to circulating SARS-CoV-2 variants elicited by inactivated and RBD-subunit vaccines. Cell Res. 2021;31(7):732–741.