
 ?Mathematical formulae have been encoded as MathML and are displayed in this HTML version using MathJax in order to improve their display. Uncheck the box to turn MathJax off. This feature requires Javascript. Click on a formula to zoom.
Abstract
Wind energy is becoming gradually more important as a power production source in distributed generation. In the present study, based upon the mesoscale wind data in the year of 2016, a microscale wind resource analysis of Huairou district with a resolution of 500 × 500 m was developed by applying computational fluid dynamics method. Wind speed and wind power density were simulated and analyzed at the height of 50, 80 and 100 m over the whole district. The obtained results revealed that wind resource is relatively abundant in some central mountain regions of Huairou, while other regions have poor reserves. It was also concluded that the wind potential in those mountain areas is suitable for constructing a distributed wind farm with an install capacity of 30 MW by applying low speed wind turbine groups.
1. Introduction
There is an increasing awareness of environmental protection and stimulating renewable generation over the world. Wind power generation is one of the most mature forms of renewable energy utilization. This is mainly because wind energy can be economically viable and does not produce any physical pollution. As the largest developing country, China is facing great pressure from the international community to reduce its CO2 emission. In order to fulfilling the commitment that reaching the CO2 emission peak around 2030, Chinese government is seeking to change nation’s unreasonable energy structure. China Wind Energy Association statistics showed that the total national wind power installed capacity of China (excluding Taiwan) is 169000 MW 2016. However, it has been found that wind curtailment is deteriorating after years of rapid development in large scale wind farm construction. One solution is making efforts for distributed wind power generation, which is also listed in ‘the 13th Wind Power Five Year Plan’ [Citation1].
Based on the above situation, Beijing Development and Reform Commission has policed to explore distributed wind power application in Beijing and planned to conducted wind energy evaluation in Yanqing, Changpin and Huairou districts [Citation2]. Huairou, located in northern Beijing, was chosen as the target area of this study. The purpose of the research is to provide an initial evaluation of wind resource for over Huairou district by developing a microscale wind map and offer a rough estimation of distributed wind power capacity.
2. Study site and method
2.1. Main title and author affiliation
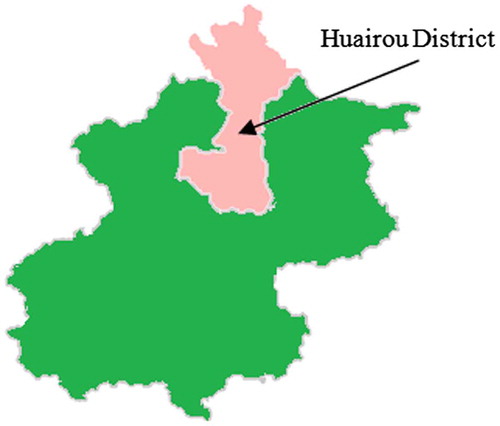
Huairou District (40.32 N 116.62E) is located in northern Beijing (as illustrated in ), covering an area of 2,557.3 square kilometres It is 50 km from the center of Beijing city. 90 percent of Huairou is mountainous area.
Figure 1. Site location.
2.2. Data-set
As the unavailability of measured wind data-set, data modeled by numerical tool has been included. CA9, a free online mesoscale wind data-set, was used as input data for computational fluid dynamics (CFD) calculation. This data-set is provided by DX WIND which is a facilitator focusing on renewable energy. CA9 is generated by weather research and forecasting (WRF) modeling, it provides China wind data at a spatial resolution of approximately 9 × 9 km grid size with hourly temporal resolution since 2010. The wind data is provided at five different heights (10, 50, 70, 80, and 100 m) above ground level that applied to obtain the wind speed and direction. The wind data of four sites in Huairou district were extracted from CA9 data-set as virtual met masts in this study. The coordinate values of four virtual met masts are listed in . In view of the present study was a preliminary assessment, the mesoscale wind data in the year of 2016 was applied.
Table 1. The coordinate values of virtual met masts.
2.3. Microscale modeling
The microscale modeling applied in the followed analysis is based upon Meteodyn WT which is a CFD software for wind energy assessment. The solver is based on the Reynolds Averaged Navier-Stokes (RANS) equations. It solves the atmospheric flow for a steady state case by implementation of a transportation equation for turbulence kinetic energy (as known as one equation k closure scheme) with considering topography and thermal effects [Citation3]. The RANS equations are shown as (1).
U, V, W are the components of the mean wind vector in a cartesian the horizontal coordinates and z is the vertical coordinate. P is the mean pressure value and ρ is the air density. u, v and w are the turbulence fluctuations components.
The k closure scheme is based on the hypothesis of proportionality between these correlations and the mean gradients, the following equations are introduced as (2) to (6). Details of the k closure scheme can be found in reference [Citation4–Citation7].
The calculation was made with a grid step size of 500 m on the domain covering the whole Huairou district. Mesoscale wind data at the height of 50, 80 m and 100 m combining with topographic and roughness data were applied as inputs for defining the study site. Figures and illustrated the digital topographic and roughness contours.
Figure 2. Digital topographic contour of Huairou district.
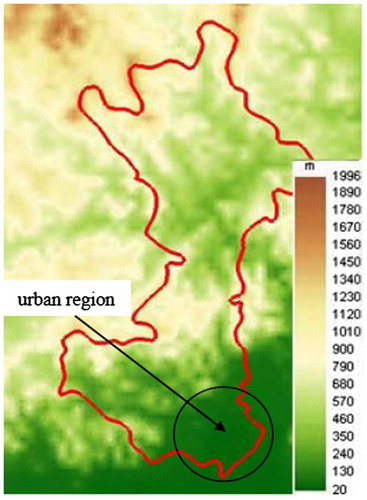
Figure 3. Roughness contour of Huairou district.
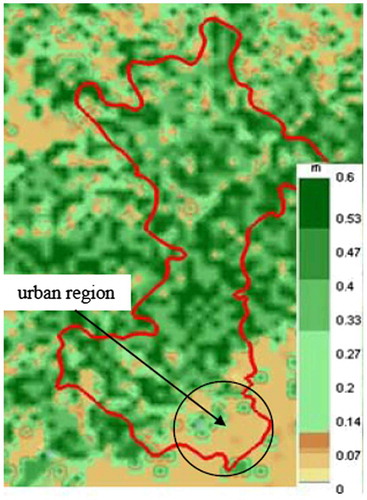
Digital topographic data was derived from NASA’s Shuttle Radar Topography Mission (SRTM) data-set. Surface roughness data was provided by Meteodyn WT. The atmospheric thermal stability was kept as neutral during the computation. As illustrated in the two figures, the urban region is the part which accounting roughly 10% of the total district area located in the southeast part of Huairou, and the surface roughness value is lower than 0.2. Other regions are mountains covered forests, which have a relatively higher altitude and surface roughness values.
3. Results and discussion
3.1. Wind speed and power density analysis
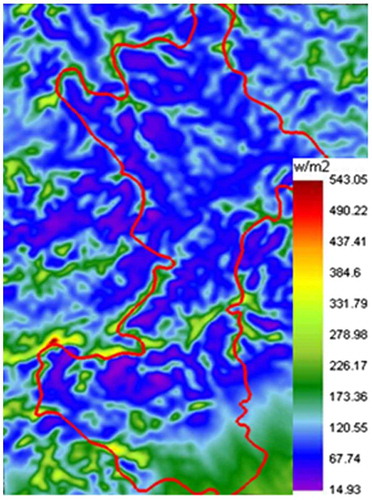
summarizes some typical values of wind speed and power density at different heights. The microscale wind speed and wind power density distribution over Huairou district are presented as yearly average results from to . As described in , wind speed and wind power density are relatively low over Huairou. As shown from to , the simulation results revealed the spatial variation of wind speed and wind power density over Huairou and the distribution pattern of wind speed and wind power density is similar at different height. Wind speed of most areas in the district is found less than 5 m/s at all three heights. Those areas with highest wind speed and wind power density is located in some mountain regions which are on higher altitude. Also, the wind speed and wind power density increase with the rising height. Based on the above simulation results, it would be a better alternative to arrange low speed wind turbines in those mountain areas where the most abundant wind resource is reserved when planning a wind farm.
Table 2. Typical values of wind speed and power density.
Figure 4. Wind speed contour over Huairou district at the height of 50 m.
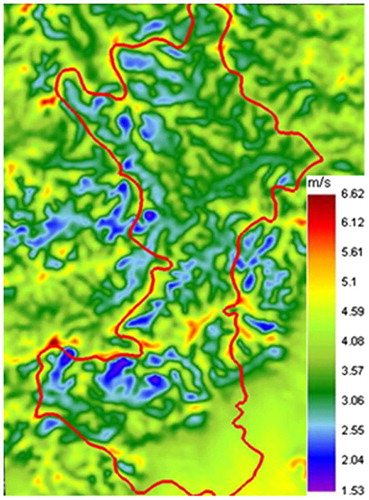
Figure 5. Wind speed contour over Huairou district at the height of 80 m.
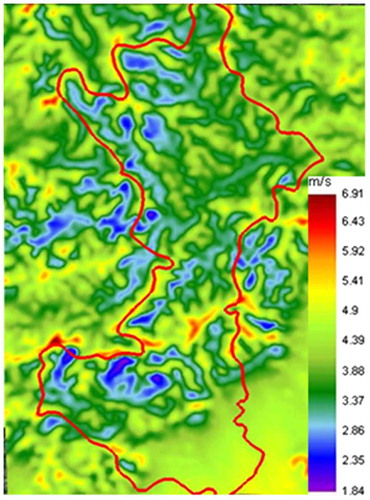
Figure 6. Wind speed contour over Huairou district at the height of 100 m.
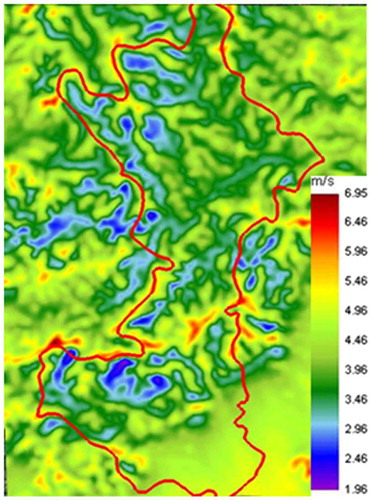
Figure 7. Wind power density contour over Huairou district at the height of 50 m.
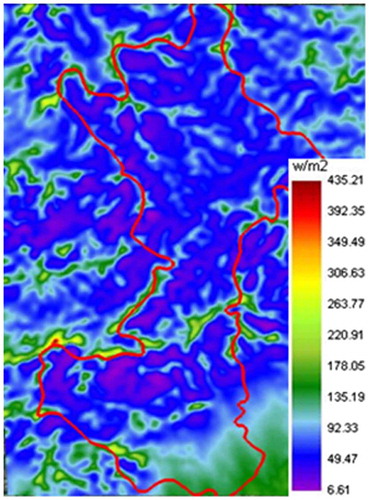
Figure 8. Wind power density contour over Huairou district at the height of 80 m.
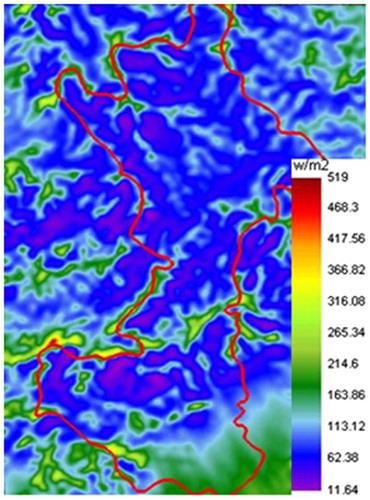
Figure 9. Wind power density contour over Huairou district at the height of 100 m.
3.2. Initial estimation of distributed wind power capacity
Considering the wind turbine technology for low wind speed, the wind turbine hub height can be chosen as 100 m. According to CA9 data-set, wind energy distribution at the height of 100 m is presented in . It is illustrated that northwest is the main wind energy direction at the height of 100 m. If arranging wind turbines along the main wind energy direction is taken into consideration, then three ridges, denoted by three white lines in , are selected as the site of wind farm. Those are areas with the highest wind power density in Huairou, As can be seen in , the distance between the selected site and Huairou urban area is approximately 23 km. It is relatively close to the user side and suitable for distributed wind power generation. If wind turbines, each of which has 2 MW single turbine capacity and a rotor diameter of 121 m are arranged along the primary wind energy direction with the distance between two adjacent wind turbines kept as 363 m, the total quantity of wind turbines is 15 and installed capacity of wind farm is 30 MW.
Figure 10. Wind energy distribution at the height of 100 m.
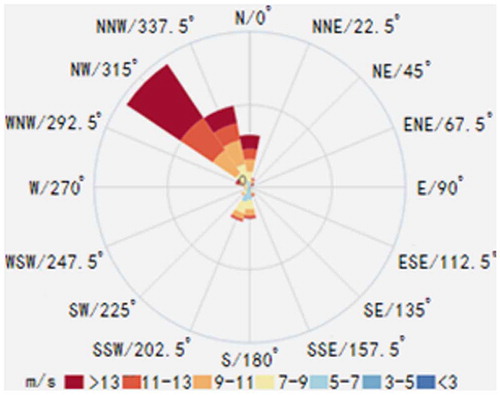
Figure 11. The selected site for distributed wind farm. Source: Ovitalmap Web which is provided free by Beijing Ovital Software Co., Ltd. [http://www.ovital.com/en/introduction/ the original map source can be obtained on http://www.gpsov.com/cn/main.php.].
![Figure 11. The selected site for distributed wind farm. Source: Ovitalmap Web which is provided free by Beijing Ovital Software Co., Ltd. [http://www.ovital.com/en/introduction/ the original map source can be obtained on http://www.gpsov.com/cn/main.php.].](/cms/asset/09402c40-0584-4c7f-bc99-c2801427a6e8/tjee_a_1466527_f0011_oc.jpg)
The above analysis is a rough estimation on the feasibility of installing wind turbines in Huairou as distributed generation. It is necessary to conduct works as installing real met mast, topographic field survey, accessing power system investigation, et al. before wind farm construction.
4. Conclusion
Microscale wind resource analysis of Huairou district with a resolution of 500 × 500 m was developed by applying Meteodyn WT based upon the mesoscale wind data in the year of 2016. Wind speed and wind power density were simulated and analyzed at the height of 50, 80 and 100 m over the whole district. The most important outcomes of the study can be summarized as follows:
Wind speed and wind power density are relatively low in Huairou, low speed wind turbine would be the best alternative.
Highest wind speed and wind power density is located in some mountain regions which are on higher altitude.
The installed capacity of a wind farm in Huairou could be 30 MW based on a rough estimation.
Future work, such as installing real met mast, topographic field survey, accessing power system investigation, et al., has to be completed before wind farm construction.
Notes on contributor
 Yi Mei
received PhD. degree in mechanical engineering from Harbin Institute of Technology. He is now mainly engaged in wind power engineering design and renewable energy economics and policy research.
Yi Mei
received PhD. degree in mechanical engineering from Harbin Institute of Technology. He is now mainly engaged in wind power engineering design and renewable energy economics and policy research.
Disclosure statement
No potential conflict of interest was reported by the author.
Funding
This work was supported by the scientific & technological project of North China Power Engineering Co., Ltd of China Power Engineering Consulting Group under [grant number K2017-A402].
References
- Xiong MP, Zhang Y, Yuan JH, et al. China wind power economic assessment and policy suggestions (in Chinese). Energy of China. 2016;38(10):20–26.
- Beijing Municipal Development and Reform Commission. Beijing “13th Five-Year” New Energy and Renewable Energy Development Plan. 2016
- Meteodyn. Meteodyn WT User Manual. 2015
- Yamada T. Simulations of nocturnal drainage flows by a q2 l turbulence closure model. J Atmos Layer Meteorol. 1983;25:63–88.
- Arritt RW. The effect of water surface temperature on lake breezes and thermal internal boundary layers. Boundary Layer Meteorology. 1987;40(1–2):101–125.
- Van Wijk AJM, Beljaars ACM, Holtslag AAM, et al. Evaluation of stability corrections in wind speed profiles over the North Sea. J Wind Eng Ind Aerod. 1990;33:551–566.10.1016/0167-6105(90)90007-Y
- Barthelmie RJ. The effects of atmospheric stability on coastal wind climates. Meteorol Appl. 1999;6:39–47.10.1017/S1350482799000961