
Abstract
Using N2 or dry air to replace SF6 as high-voltage switchgear insulation media is a hot topic in the development of environmental friendly switching equipment. In order to make switchgear equipment with N2 has a much compact structure in space, engineers should fully understand the insulation characteristics of N2. In this paper, the breakdown characteristics of N2 at power frequency and with lightning pulse in the sphere-plate electrodes has been investigated and the effect of humidity on breakdown voltage analyzed. From the test results, it was revealed that the AC and impulse breakdown voltages of N2 were not seriously affected by different moisture content ranging from 0 to 1000 μL/L in N2. And the breakdown voltage was decreased 8~15% with increasing moisture contents from 1500 to 2000 μL/L.
1. Introduction
SF6 gas has an excellent insulation and interruption performance, so that it has been extensively used as an insulating medium in high-voltage electric devices [Citation1]. However, in 1997, by Kyoto Protocol, SF6 gas was classified as a greenhouse gas because it has 23,900 times higher GWP (global warming potential) than that of CO2 [Citation2,3]. Therefore, it is needed to reduce the total usage of SF6 in electric power industries [Citation4–Citation7].
In order to decrease and substitute SF6 gas, many research works have been done, and one of the candidates which could replace SF6 gas in the medium voltage-level is the application of N2 as an insulating medium. N2 has been received noticeable attraction due to its environment-friendly characteristics. Recently, many manufactures announced that 12~24 kV C-GIS has been successfully developed using N2 as a main insulating medium [Citation8–Citation10].
Although the history of the insulation performance of N2 is very long, there is a grave shortage of the complete data for the disruptive discharge voltage of N2. In order to expand the usage of N2 for extra high voltage level, detailed knowledge and experimental works on the breakdown characteristics of N2 should be proceeded. Up to now, however, only a few fundamental research works of N2 have been reported compared to those of SF6. And it was generally accepted that the control of moisture content in N2 is the critical factor to determine the performance of N2 but, there are only a few fundamental research works regarding the insulation characteristics affected by the ratio of moisture content in N2 [Citation11–Citation14]. There are only some papers dealing with humidity effects regarding the atmospheric conditions (see ).
Table 1. Comparison of main characteristic of N2 and SF6.
In this paper, the author study the relation between moisture content in N2 and breakdown characteristics of N2. The humidity of N2 has been controlled by mixing the dry-N2 with the N2 which has a certain moisture content (2000 μL/L). And then AC withstand tests and lightning impulse breakdown tests were performed using sphere to plane electrode N2 gap configurations.
2. Experimental setup
The experimental setup is illustrated in . Tests were made between a stainless steel electrode and a horizontal plate electrode in a cylindrical closed chamber made of stainless steel. The diameter of the sphere electrode was 100 mm and the diameter of the plate diameter was 400 mm. The discharge gap can be changed from 0 to 100 mm. The calculated inhomogeneity factors for the gas-gaps used in the test are shown in . The chamber could withstand the pressure varied from 0.0 to 1.0 MPa. And the observation window was set up to watch to watch the discharge path during breakdown tests. A 300 kV AC transformer was used in the AC withstand test. The rising rate of AC voltage was 1 kV/s, and it was increased continuously until the breakdown took place. AC withstand voltage was obtained from the average of 10 measurements by the voltage increasing method. Lightning impulse breakdown test was carried out by using a 400 kV impulse voltage generator. The waveform was ±1.2/50 μs. The breakdown voltage characteristics were determined by the ‘Up & Down’method with 5 kV steps.
Figure 1. Schematic diagram of the test rig.
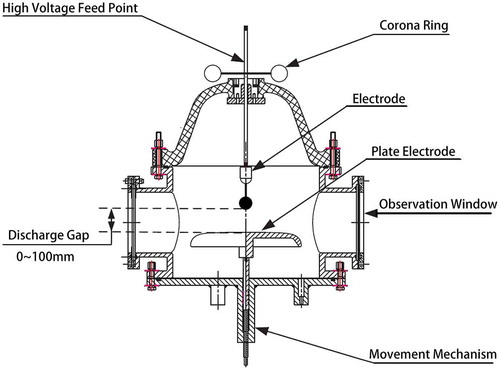
Table 2. Non-uniform coefficient for electric field at different gap distance.
2.1. Control of gas moisture
The artificial moisture content in N2 was controlled by mixing the specific humidity N2 (2000 μL/L) with dry-N2. Four kinds of N2 with different moisture content were obtained (see Table 3). Humidity readings before and after each set of breakdown measurements were obtained using a water analyzer. The accuracy of the instrument used was 10 μL/L.
Table 3. Moisture content of N2.
The saturation vapor pressure is the level at which air is saturated with water vapor and condensation occurs for further increases in water vapor content. And saturated vapor pressure is only determined by temperature. Absolute humidity in the air is the amount of water (by mass) present in the volume divided by the N2 volume. In order to use the N2 as electrical insulation medium in higher voltage level, pressurization is inevitable. It is possible that the liquefaction of water occurs when highly pressurized condition with high humidity. Thus, the water content would not increase with the pressure. In this paper, we experiments were carried out under 0.1 MPa which is the 12 kV C-GIS working pressure (see ).
Figure 2. H2O saturated steam pressure curve [Citation15].
![Figure 2. H2O saturated steam pressure curve [Citation15].](/cms/asset/d19e0a8a-9205-4b00-b782-334cea8f90fd/tjee_a_1471864_f0002_b.gif)
3. Result and discussion
The effect of humidity on the lightning impulse breakdown characteristics of N2 was shown in Figures and .The positive and negative lightning impulse have shown the same characteristics. There were no significant changes of breakdown voltage of N2 at the prepared humidity range from 0 to 1000 μL/L. The breakdown voltage increases slightly when the moisture contents change from 0 to 500 μL/L. When the moisture content increased to 1500 μL/L, the breakdown voltage reduces about 5% compared with the dry-N2. And the value reduces about 15% when the moisture content increased to 2000 μL/L.
Figure 3. Breakdown characteristics of N2 in the condition of different moisture content under lightning impulse (Li−).
Figure 4. Breakdown characteristics of N2 in the condition of different moisture content under lightning impulse (Li+).
shows AC withstand characteristics of N2 for different humidity respectively. The breakdown voltage was reduced linearly with increasing the moisture content in N2. The decline of the result is the same with that of the lightning impulse breakdown result. The breakdown voltage was decreased 8~15% with increasing moisture contents from 0 to 2000 μL/L.
Figure 5. Breakdown voltage of N2 with different moisture content.
This is separate to the trend for short spere/plane and uniform gaps presented in previous papers. Short non-uniform field gaps exhibit increasing breakdown voltage with increasing humidity. Reinforcement of breakdown strength due to the humidity can be observed when the relative humidity is higher than 60~90%. However, in this work, breakdown strength decreased slightly due to the humidity. From this result, it could be deduced that the rather small water vapor up to approximately 1000 μL/L could not affect the breakdown strength in dry-N2.
4. Conclusions
The relation between moisture content in N2 and breakdown characteristics of N2 was analyzed.
The positive and negative lightning impulse have shown the same characteristics. There were no significant changes of breakdown voltage of N2 at the prepared humidity range from 0 to 1000 μL/L. When the moisture content increased to 2000 μL/L, the breakdown voltage reduces about 10~15% compared with the dry-N2.
The breakdown voltage was reduced linearly with increasing the moisture content in N2. The breakdown voltage was decreased 8~15% with increasing moisture contents from 0 to 2000 μL/L.
Funding
This work was supported by Science and Technology Project of SGCC (Research on SF6 Alternative Gas for Insulation and Arc Quenching Application, 524606160173).
Disclosure statement
No potential conflict of interest was reported by the authors.
Notes on contributors
Fanyi Cai was born in Changzhou City, Jiangsu Province, China in 1987. He received the Ph.D. degree in natural science chemistry from the University of Science and Technology of China in 2014. He is with the Smart Electrification Equipment Bussiness Unit of Nari Group Corporation as a R&D Engineer for the benign solid insulated materials and SF6 alternatives gas in high voltage equipment.
Baijie Zhou was born in Jiangsu provice, China. He received the Ph.D. degree from NanJing University, currently he works as engineer in NARI GROOUP CORPORATION. He is working on the development of solid insulated and green-gas insulated switchgears, and failure analysis of electrical insulation of high voltage equipment.
Jian Xue was born in LiaoNing provice, China in 1986. He received the Ph.D. degree from NanJing University, China in 2014, currently he works as engineer in NARI GROOUP CORPORATION. He is working on the development of solid insulated and green-gas insulated switchgears, and failure analysis of electrical insulation of high voltage equipment.
References
- Luo X. SF6 gas insulated metal-enclosed swichgear. Beijing: China Electric Power Press; 1998.
- Maiss M, Brenninkmeijer CA. Atmospheric SF6: trends, sources, and prospects. Environ Sci Tech. 1998;32(20):3077–3086.10.1021/es9802807
- Xiang Z. SF6 emission reduction to deal with the global climate change. Environmental Conformity Assessment. 2010;2:23–27.
- Takeda T, Matsuoka S, Kumada A, et al. Sparkover characteristics in CF3I gas and CF3I/N2 gas mixture under non-uniform field gaps. IEEJ Transactions on Power and Energy. 2010;130(9):813–818.10.1541/ieejpes.130.813
- Kasuya H, Kawamura Y, Mizoguchi H, et al. Interruption capability and decomposed gas density of CF3I as a substitute for SF6 gas. IEEE Trans Dielectr Electr Insul. 2010;17(4):1196–1203.10.1109/TDEI.2010.5539690
- Cressault Y, Connord V, Hingana H, et al. Transport properties of CF3I thermal plasmas mixed with CO2, air or N2 as an alternative to SF6 plasmas in high-voltage circuit breakers. J Phys D-Appl Phys. 2011;44(49):495202.10.1088/0022-3727/44/49/495202
- Qian L, Chen S. Research and design of 12~24 kV nitrogen insulated ring main unit. High Voltage Eng. 2014;40(12):3717–3724.
- Hyrenbach M, Hintzen T, Muller P, et al. Alternative gas insulation in medium-voltage switchgear. 23rd International Conference on Electricity Distribution, Lyon; 2015.
- Simka P, Ranjan N. Dielectric strength of C5 perfluoroketone. The 19th International Symposium on High Voltage Engineering, Pilsen; 2015.
- Lim SB. Study on oxygen/nitrogen gas mixtures for the surface insulation performance in gas insulated switchgear. IEEE Trans Dielectr Electr Insul. 2015;22(3):1567–1576.10.1109/TDEI.2015.7116352
- Kim JY, Kim YM, Seok BY, et al. A study on the lightning impulse breakdown characteristics of dry air for design of eco-friendly electric power apparatus. 18th International Symposium on High Voltage Engineering; Seoul: ISH; 2013.
- Madarász GA, Choi BH, Lee J. Application of dry-air insulating media in 170 kV GIS. 2011 Electrical Insulation Conference, Annapolis (MD); 2011.
- Zhang X. Influence of humidity on the decomposition products and insulating characteristics of CF3I. IEEE Trans Dielectr Electr Insul. 2016;23(2):819–828.10.1109/TDEI.2015.005456
- Harrison JA. A computer study of uniform-field electrodes. Br J Appl Phys. 1967;18(11):1617–1627.10.1088/0508-3443/18/11/316
- Martin C. Water phase diagram. Available from: http://www1.lsbu.ac.uk/water/phase.html.