
ABSTRACT
The Indigenous Sami population have inhabited rural northern areas of Norway, Sweden, Finland and the Kola Peninsula in Russia for thousands of years. Today, many Sami live in cities. No large quantitative studies have investigated the health and life of urban Sami in Norway. As a basis for further research, this paper describes the background, methods, participation and sample characteristics of the survey From Rural to Urban Living, conducted in 2014. The unique sampling design is based on internal migration records. Those invited were everyone born 1950–1975 who had relocated from preselected rural Sami core areas to cities in Norway. Their children above the age of 18 were also invited. The paper is descriptive with some basic statistical tests. In total, 2058 (response rate 34%) first-generation and 1168 (response rate 19%) second-generation migrants responded. The response rate was lowest in the younger age groups and among men. One out of three reported Sami background. The education level was in general high. From Rural to Urban Living enables numerous research possibilities within health and social sciences, and may contribute to new insight into the health, culture and identity of the growing Sami population in urban areas of Norway.
Introduction
After World War II, there has been a substantial urbanisation in Norway [Citation1–Citation4]. At the same time, there has been a shift from primary to service industries, while education levels have increased, especially among women [Citation4]. Today, more than 80% of the Norwegian population live in urban settlements, and one out of three lives in one of the country’s five largest cities [Citation5].
Sápmi – an overall sparsely populated region covering northern and central parts of Norway and Sweden, northern Finland, and the Kola Peninsula in Russia – has been inhabited by the Sami people for thousands of years [Citation6]. The majority of the Sami live in Norway where they are acknowledged as an Indigenous people. No reliable or updated demographic record on the Sami exists, although a vague estimate of 40,000 Norwegian Sami has been presented [Citation7,Citation8]. There are several Sami languages, forming a branch of the Uralic language family. Assimilation policies strongly affected the Sami culture and the use of the Sami languages, with the result that today many Sami do not consider themselves Sami nor speak a Sami language. In the Norwegian part of Sápmi, the Sami live side-by-side with ethnic Norwegians and Kvens, an ethnic minority of Finnish descent. In this region, many people have multiple ethnic backgrounds.
Today, many Sami live outside Sápmi. For decades, there has been a large migration from the north to the south of Norway. Official numbers from Statistics Norway show a net migration loss both in Northern Norway as a whole and also in selected Sami settlement regions [Citation9]. A register-based study showed that in the period 2000–2005, 20% of young adults (aged 18–25 years) relocated from northern to southern districts of Norway [Citation10]. The Sami Parliament electoral roll increases more in the south compared to the north; while the two southernmost constituencies accounted for only 17% of the total electoral roll in the 2005 election, the proportion was 24% in 2017 [Citation9,Citation11]. In addition to migration from north to south, urbanisation takes place both within and outside Sápmi. The fact that the Sami parliament electoral roll increases more in the cities compared to the traditional rural Sami core areas indicates that urbanisation also affects the Sami [Citation12].
There is increasing focus on the urbanisation of the Sami [Citation13]. There have been some qualitative research and master projects regarding how Sami identity is expressed in an urban setting [Citation14–Citation18] and register-based analyses of migration from rural Sami areas to cities in Norway [Citation13,Citation19,Citation20]. The book City-Saami provides an overview of research and knowledge available on the growing urban Sami societies in Norway, Sweden and Finland [Citation12]. In addition to increased migration, a revitalisation among Sami already living in the cities has taken place after 1990. The book emphasises the establishment of Sami institutions, organisations, and arenas for Sami to meet in the cities.
Sami (and non-Sami) who have moved from their original home place can be particularly vulnerable to bullying and social exclusion due to their different dialect, habits and behaviour. Research has shown that being a minority group in an area increases the risk of victimisation [Citation21,Citation22], and that bullying and discrimination due to Sami ethnicity may have health consequences [Citation23–Citation25]. It is therefore important to increase the knowledge of the health and wellbeing of Sami who have moved to cities in Norway.
The Centre for Sami Health Research (CSHR) at UiT The Arctic University of Norway has through the Population-based Study on Health and Living Conditions in Regions with Sami and Norwegian Populations – the SAMINOR Study, contributed to new knowledge about the health of Sami and non-Sami inhabitants in rural areas of Sápmi [Citation26–Citation28]. However, no large quantitative studies have been conducted in order to investigate the health and living conditions of Sami residing in urban areas. This was the reason for initiating the survey From Rural to Urban Living (in Norwegian “Fra bygd til by”).
The aim of this paper is to describe the background, methods, data collection, and participation of the survey From Rural to Urban Living. The paper will serve as a reference paper for future researchers using these data. Selected sample characteristics of first- and second-generation rural-urban migrants are presented. The problem of non-response is thoroughly discussed.
Materials and methods
The survey From Rural to Urban Living was conducted in 2014 by CSHR, in collaboration with the Norwegian Institute for Urban and Regional Research (NIBR), the Sami University of Applied Sciences, and Statistics Norway. The survey is part of a larger study that also included register-based analyses of migration patterns [Citation19,Citation20].
Study design
The study has a cross-sectional design, where all data were collected through self-administered questionnaires. As registration of ethnicity is prohibited in national registries in Norway, it would be impossible to draw a sample consisting solely of Sami people. A random draw of the population would consist mainly of non-Sami. Instead, the sampling design was based on historical migration records. The Norwegian National Population Register contains information about name, address, and other personal information of all citizens in the country, connected to a unique 11-digit personal identification number assigned to each citizen for life. Since its establishment in 1964, the register has recorded all reported changes of address within the country. Hence, each person’s migration history can be tracked. Based on these migration records, inhabitants in selected cities in Norway who originated from rural Sami core areas were identified and invited, regardless of ethnic background.
Sample
The survey consists of two separate samples: first-generation and second-generation internal migrants. First-generation invitees were everyone born 1950–1975 (aged 39–64 years at invitation) who, at the time they turned 15 years, lived in one out of 23 preselected rural municipalities, and by the time of invitation lived in one out of 51 cities or urban municipalities in Norway. In this paper, we refer to the municipal and county names and regional structure that existed at the time of sampling, that is, prior to the local government reform that started in 2017, with the aim to reduce the number of municipalities and counties in Norway. All children of first-generation invitees aged 18 years or older were also invited (second-generation).
All the 23 rural municipalities have a considerable Sami population and are located in the four northernmost counties in Norway: Finnmark, Troms, Nordland, and Nord-Trøndelag. Moreover, most of these municipalities were included in the SAMINOR Study [Citation26,Citation27] ():
Figure 1. Map of study area of the survey From Rural to Urban Living, 2014. The figure shows the included places of origin (municipalities at the age of 15) and cities where participants currently live. The figure is designed for this paper by the main author and is used with permission from the Centre for Sami Health Research at UiT The Arctic University of Norway.
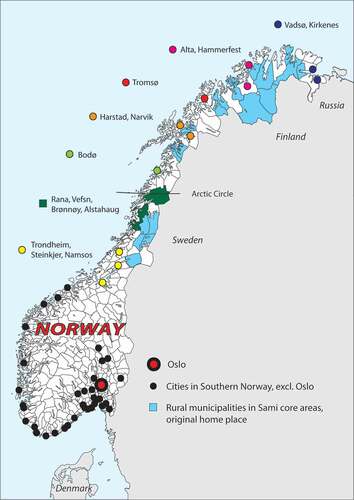
Karasjok, Kautokeino, Nesseby, Tana, Porsanger, Gamvik, Kvalsund and Loppa in Finnmark; Kåfjord, Storfjord, Lyngen, Kvænangen, Skånland, Gratangen and Lavangen in Troms; Evenes, Hamarøy, Tysfjord, Hattfjelldal and Grane in Nordland; Namsskogan, Røyrvik and Snåsa in Nord-Trøndelag.
First-generation invitees were at the time of invitation residents in one of the 51 cities in Norway that were selected for this survey. Except for the small city of Vardø in Finnmark County (approximately 2000 inhabitants), all Norwegian cities that had city status prior to 1996 were included. In addition, some newer cities in Northern Norway were included. The municipality wherein a city is located often carries the same name as the city. Many of the urban municipalities, especially in Northern Norway, cover a large geographic area. To avoid inclusion of rural areas surrounding the city, invitees were sampled based on their address (postal codes/city names) rather than the municipality of residence. The municipalities Rana, Vefsn, Brønnøy and Alstahaug in Nordland County were exceptions. As these municipalities are important receivers of migrants from the Southern Sami area, it was decided to include their entire area. The cities were categorised into nine urban regions ():
1. Oslo
2. Trondheim, Steinkjer, Namsos
3. Tromsø
4. Bodø
5. Vadsø, Kirkenes
6. Alta, Hammerfest
7. Harstad, Narvik
8. Rana, Vefsn, Brønnøy, Alstahaug (the entire municipalities were included)
9. Southern Norway (excl. Oslo): Kongsvinger, Hamar, Lillehammer, Gjøvik, Hønefoss, Kongsberg, Notodden, Sarpsborg, Fredrikstad, Halden, Moss, Drammen, Holmestrand, Horten, Tønsberg, Sandefjord, Larvik, Skien, Porsgrunn, Risør, Arendal, Grimstad, Kristiansand, Mandal, Farsund, Flekkefjord, Eigersund, Stavanger, Sandnes, Haugesund, Bergen, Florø, Molde, Ålesund, Kristiansund
Second-generation invitees were categorised into seven geographic regions, according to their county of residence:
1. Oslo
2. Eastern Norway (Østfold, Akershus, Hedmark, Oppland, Buskerud, Vestfold, Telemark)
3. Southern and Western Norway (Aust-Agder, Vest-Agder, Rogaland, Hordaland, Sogn og Fjordane, Møre og Romsdal)
4. Trøndelag (Nord-Trøndelag and Sør-Trøndelag)
5. Nordland
6. Troms incl. Svalbard
7. Finnmark
Statistics Norway provided names and addresses for all who fulfilled these criteria. Invitations were sent to 6176 first-generation migrants, whereof 143 letters were returned unopened, leaving an eligible sample of 6033 individuals. A total of 2058 (34.1%) responded. Respondents who did not provide information about sex (n = 9), birth year (n = 2) or current municipality (n = 24) were excluded, together with those who reported place of residence outside the selected cities (n = 27). The analyses are therefore based on 1996 persons.
Invitations were sent to 6433 second-generation migrants, and 236 invitations were returned. Out of 6197 eligible individuals, 1168 responded (18.8%). Respondents who did not report their sex (n = 3), birth year (n = 7) or current municipality (n = 11) or reported to live abroad (n = 3) were excluded, leaving 1144 participants to our calculations.
Logistics
Together with required information about the survey, the questionnaires were distributed from Statistics Norway on 6 March 2014. The information and questionnaire were available in Norwegian only. The questionnaire could alternatively be accessed and completed online, using a unique code assigned to each participant. A reminder was sent after four weeks. As an incentive to participate, two travel gift cards of 10 000 NOK were drawn among respondents. The questionnaires were returned in self-addressed stamped envelopes to CSHR. Paper questionnaires were digitally scanned. Questionnaires received after 14 October 2014 were excluded.
The data are stored de-identified in EUTRO, a unique module-based database solution for research, developed by the Department of Community Medicine, UiT The Arctic University of Norway. CSHR administers the use of the data.
Questionnaires
CSHR developed the questionnaires, in collaboration with researchers from NIBR, the Sami University of Applied Sciences, and the University of Bergen. Prior to the invitation, a small pilot was conducted, resulting in minor alterations to some questions. Both the first- and second-generation questionnaires were eight pages long and contained a mixture of newly developed questions and questions previously used in other studies. The questionnaire focussed on health, lifestyle, living conditions, identity, traditional skills, reasons for moving to the city, and whether moving had affected their culture and sense of belonging to the place they grew up. Most questions were independent of ethnic background, while some questions addressed Sami participants only. Some questions to the second-generation were slightly altered. The questionnaires can be accessed on the project’s website (https://uit.no/prosjekter/prosjekt?p_document_id=262973).
Questions regarding ethnicity were identical to those used in the SAMINOR Study [Citation27]: What languages do/did you, your parents and grandparents speak at home? What is your, your father’s and your mother’s ethnic background? and What do you consider yourself to be? Response options were: Norwegian; Sami; Kven; Other. Multiple languages/ethnicities were allowed. In the present paper, participants were categorised as Sami if they answered Sami to at least one of these questions. In addition, we asked: Did at least one of your great grandparents have Sami as home language? (Yes; No; Do not know).
Participants were asked to state their sex, year of birth and current municipality of residence. Age was calculated as participation year minus birth year and categorised into two age groups: 39–49/50–64 years and 19–29/30–46 years for first- and second-generation, respectively. Other background variables included in this paper may be reviewed on the project website, as described above.
Statistical analyses
This paper is descriptive with some basic statistical tests. Categorical variables are presented as numbers and percentages, and continuous variables as means and standard deviations. The median number of days until the response is also presented. When testing for differences between groups, two-sample t-tests were used for comparisons of means, allowing for unequal variances, while Pearson’s chi-square tests were used when comparing categorical variables [Citation29]. Comparisons of medians were done by the Kruskal–Wallis test [Citation29].
As Statistics Norway did not register sex, age and municipality for the invitations that were returned unopened, response rates according to these variables were based on the original samples (n = 6176 for first-generation and n = 6433 for second-generation). The calculations were performed using aggregated data on the number of invitees and the number of respondents in each subgroup.
The SAS statistical software for Windows version 9.4 (SAS Institute Inc., Cary, NC, USA) was used for data management, calculations and statistical analyses. All tests were two-sided, and the significance level was set to 5%.
Ethics
The data collection and storage were approved by the Norwegian Data Protection Authority (https://www.datatilsynet.no/en/). The Regional Committee for Medical and Health Research Ethics (REC North, https://helseforskning.etikkom.no/?_ikbLanguageCode=us) decided that ethical approval for the present study was not required under the Norwegian Act on medical and health research (ACT 2008–06-20-44, https://app.uio.no/ub/ujur/oversatte-lover/data/lov-20080620-044-eng.pdf), as no health data are presented. However, the use of health data from the survey and linkages to other registers will require approval from REC North. All invitees received written information about the survey and consented by returning the completed questionnaire.
Results
First-generation sample
The invited sample consisted of 3394 (55%) women and 2782 (45%) men. Almost 60% of the invitees lived in cities within Northern Norway (Nordland, Troms and Finnmark counties) (). There were no respondents from the cities of Eigersund and Florø.
Table 1. Participation of first-generation internal migrants, by sex, age group and city region. The survey From Rural to Urban Living, 2014 (N = 6176 invitees and n = 1996 participants).
includes response rates by sex, age, and urban region. Participation was higher among women than men, with a very low response seen among men younger than 50 years. Participation was lowest in Alta/Hammerfest, where the response rate for men below the age of 50 years was as low as 13%.
Median response time was 12 days. A comparison of early (within 15 days), median (in 16–30 days), and late respondents (more than 30 days, i.e. after reminder was sent) is presented in . Being male, young, Sami and in a full-time job were associated with late response.
Table 2. Characteristics of first-generation internal migrants, by early, median, late and no-response and median number of days to respond. The survey From Rural to Urban Living, 2014 (n = 1996).
shows selected sample characteristics, stratified by sex and two age groups. A total of 730 participants (37%) were categorised as Sami according to our definition. In addition, 60 reported to have had at least one Sami-speaking great grandparent. Approximately half of the respondents were married, and women reported to have 1.94 children, on average. Eighty-four per cent had lived in their current municipality/city for more than 10 years. Although similar proportions of men and women reported education at university/college level, university education of at least 4 years was more common among women than men.
Table 3. Characteristics of first-generation internal migrants, by sex and age group. The survey From Rural to Urban Living, 2014 (n = 1996).
The web-based questionnaire was chosen by 23% of first-generation participants, and more often by men, younger participants and those with high education and income (results not shown).
Second-generation sample
The invited sample of second-generation migrants consisted of 3150 (49%) women and 3283 (51%) men, out of which more than half lived in Northern Norway (). The response rate among men was half the rate among women and lowest in the youngest age group. Participation was highest in Oslo and lowest in Finnmark. Almost one out of three chose the web-based questionnaire (results not shown).
Table 4. Participation of second-generation internal migrants, by sex, age group, and geographic region. The survey From Rural to Urban Living, 2014 (N = 6433 invitees and n = 1144 participants).
Selected characteristics by sex and two age groups are shown in . A total of 945 participants (83%) reported to live in one of the selected urban regions. Four out of ten reported to live in the same municipality as they did when they were 15 years of age (results not shown). Higher education was more common among women.
Table 5. Characteristics of second-generation internal migrants, by sex and age group. The survey From Rural to Urban Living, 2014 (n = 1144).
A total of 376 (34%) of second-generation participants were categorised as Sami (), out of which 288 lived within the selected urban area. Adding these to the 730 first-generation Sami migrants, there were in total 1018 urban Sami participants.
Discussion
The survey From Rural to Urban Living aims to study health, living conditions and ethnic identity of internal migrants from rural Sami core areas to cities in Norway. In this paper, we have described the background, methods, data collection, and participation of the survey, and presented some sample characteristics with basic statistical tests. The survey has collected data on 1996 first-generation and 1144 second-generation rural-urban migrants, whereof more than one-third reported Sami background. The main observation was a low participation rate, especially among men and young people. Participation was particularly low for second-generation migrants. Both samples are characterised by a high education level.
There are various reasons for why people chose to relocate. Their decision is influenced by both structural factors such as access to work and housing, as well as individual values, desires and family situation [Citation30,Citation31]. In his “Push-and-pull” theory, Lee mentions four types of factors: factors associated with the area of origin; factors associated with the area of destination; intervening obstacles; personal factors [Citation32]. It is beyond the scope of this paper to discuss all these aspects, but they will be addressed in a coming publication.
Although there is a moving flow from north to south [Citation9], most of the migrants in this study still live in northern parts of the country. A previous report showed that four out of 10 had moved to the city that was closest to their home place [Citation19]. The composition of the invited sample shows that more women than men have relocated to cities. A study based on Norwegian registry data of birth cohorts 1967–1972 revealed that at age 34, men were more likely than women to live in the same neighbourhood as their parents [Citation33]. Women who were married lived farther away from parents than did their husbands, and women who originated from rural areas, were more likely than men to live in urban areas at age 34. Rural areas are dominated by primary industries, which traditionally have been occupied by men. These communities may have less work opportunities for unskilled women, leading them to move in order to find a job or to pursue education.
The survey had a low response rate, especially among second-generation invitees. This is a concern as it may have caused selection bias. Due to strict privacy regulations in Norway, we have limited information about non-respondents. We were, however, able to calculate response rates by sex, age, and place of residence. In both samples, response rates varied between regions and women responded to a higher degree than men did, with the lowest response among the youngest men. This is in line with reports from several other studies [Citation26,Citation27,Citation34,Citation35]. We also found that male and younger participants responded later, indicating that late respondents resemble non-respondents with regard to age and sex. However, we cannot assume the same to be true in relation to other variables. More than half of the participants responded within two weeks. Sending out a reminder had limited effect, suggesting that invitees had already decided not to participate.
As national registers in Norway do not contain ethnicity information, it was not possible to calculate response rates separately for Sami and non-Sami. By examining early and late responders, we observed that Sami participants to a greater extent responded late. If late respondents resemble non-respondents, this could indicate lower response among the Sami. The collective memory of the longstanding discrimination and forced assimilation of the Sami people, together with examples of unethical research in the past [Citation36], could have affected response among Sami invitees. On the other hand, it may have felt reassuring that the survey was conducted by a Sami research centre. Non-Sami invitees might consider the survey as intended for people of Sami origin only. Despite a much lower response rate among second-generation invitees, the proportion of Sami was quite similar in the two samples, 37% and 34%, respectively. This indicates that ethnicity does not have a strong effect on response rates.
Low response rates are not uncommon in questionnaire surveys. Already in the late 1960s, researchers reported a decline in survey response [Citation37]. The decline is seen in both telephone surveys, face-to-face interviews, questionnaire surveys and in clinical health surveys [Citation34,Citation35,Citation38–Citation40]. Questionnaire-based postal surveys seem to have lower response rates compared to surveys where the participants receive a health check-up or other incentives. The SAMINOR 2 Survey (2012–2014), which included two separate surveys, may serve as an example. The first survey, the SAMINOR 2 Questionnaire Survey [Citation27], had a similar design as From Rural to Urban Living. In the age group 40–69 years, the response rate was 32% [Citation27]. In comparison, the second part, the SAMINOR 2 Clinical Survey, achieved a response rate of 47% within the same age span [Citation28]. In the latter survey, the respondents received a limited health check-up, which we believe enhanced the attendance rate.
There might be several reasons why people choose not to participate. A large number of research projects, market research surveys, opinion polls and telemarketing may tire the population. The length of our eight-page questionnaire could be a disadvantage. However, the association between response rates and questionnaire size or survey length is seen to be weak [Citation41,Citation42].
Some invitees might have considered themselves outside the target group of the survey. Many of the included cities are small, and in some cases, the entire municipality was included, covering also surrounding rural areas. Residents herein may have found the survey irrelevant, as they do not regard their home place a city. This might explain the low response in some of the city regions of Northern Norway. The lowest response among first-generation invitees was found in Alta/Hammerfest in Finnmark County. This region has received a considerable number of migrants from other parts of Finnmark [Citation11]. A high number of invitees in this region, combined with a low response rate, contributed to the low overall response rate.
People, who had recently moved to the city, may have found the survey irrelevant, as they might not yet feel fully at home in the city, but consider themselves just visiting. On the other hand, those who have resided in a city for a long period of time might find questions on rural traditions and way of life, with a special focus on Sami culture and identity irrelevant. However, the low response in Northern Norway, where the influence of Sami culture and rural traditions may be considered greater, contradicts this.
The lower response rate observed for second-generation (18.8%) compared to first-generation invitees (34.1%), can partly be explained by their younger age. The age group 30–46 years, however, had response rates more similar to the age group 39–49 years of the first-generation sample. Another reason for low response among second-generation invitees might be that some of them were not part of their parents’ moving process and have never lived in a city.
Sociodemographic characteristics correspond well with national numbers. The mean number of children reported by women in our first-generation sample (1.94) is the exact same as found in a registered-based analysis of migration patterns that was conducted prior to the survey [Citation19]. This indicates that our female response sample is representative when it comes to the number of children. Women reported higher education level than men did, which is also the case nationally. Since 1985, there have been more female than male students in Norway, and today, 60% of students in higher education are women [Citation4]. However, more men than women reported to be in a full-time job, and men reported a higher gross family income. National numbers show that women have almost caught up with men with regards to participation in the labour force, but there are still more women working part-time, and women earn on average less than men [Citation4]. Cohabiting is common in this sample, and a large proportion is living alone. This is especially the case for the youngest participants. More than half of the respondents in the age group 19–29 years (second-generation sample) were living alone, and very few in this age group reported to be married. Nationally, the number of people living alone is increasing and is particularly high in the centres of the largest cities, and it is more common among young people to cohabit than to be married [Citation4]. The high education level observed in both samples is not surprising. People with higher education tend to be more willing to respond to surveys [Citation43]. In addition, the education level in Norway is generally high and highest in densely populated municipalities [Citation4]. Furthermore, those invited to this survey were people who had moved from rural to urban areas, and education is an important reason to do so. Job opportunities for highly educated people are also better in a city. In Norway, public education at university level is free. Grants and loans from the Norwegian State Educational Loan Fund make education possible for all. During the 1960s and 1970s, a number of new schools and colleges were established, including universities in Tromsø and Trondheim, which substantially improved the education possibilities for youth from Northern and Central Norway. At the same time, a revitalisation process among the Sami took place, and young Sami were encouraged to pursue education. Several Sami institutions were established, such as the Sami Parliament in Karasjok [Citation44], and the Sami University College (later named the Sami University of Applied Sciences) in Kautokeino [Citation8]. This contributed to strengthening the Sami language and culture and produced jobs for Sami with tertiary education. UiT The Arctic University of Norway has a special responsibility for education and research on Sami issues and offers allocated seats for Sami students in certain fields, such as medicine, odontology, and law. Allocated seats and other incentives for Sami student have also been implemented at other universities and colleges. As a result of all these efforts, the Sami today are highly educated, just as the general population in Norway. This is in stark contrast to Indigenous peoples in many other parts of the world [Citation45].
Fewer participants than expected used the online questionnaire, considering their high education level and that most inhabitants in Norway have internet access. Possible reasons could be concerns regarding data safety, that the paper questionnaire was easily at hand or that they did not read the information that the questionnaire was available online. The use of both paper and net-based questionnaires provides more options for the invitees to respond, but it is unclear whether it improves response rates [Citation46,Citation47].
Strengths and limitations
A strength of this study is that it includes everyone born 1950–1975 who, within the period 1965–2013, relocated from 23 rural municipalities to 51 cities in Norway. This sampling procedure was possible due to the high-quality migration records of the Norwegian National Population Register.
The unique design of the survey may serve as an example of how historical relocation records may be applied to sample Indigenous people in urban areas. The 1018 urban Sami participants in this study are as far as we know the largest sample ever collected to investigate the living condition and health of Sami residing in urban areas in Norway. By targeting people who originate from traditional Sami areas, we maximised the number of Sami participants. By asking respondents several ethnicity-related questions, those with a Sami background may be identified. Sami participants can be compared to non-Sami who originates from the same areas and have been through the same relocation process. Inclusion of children of the migrants gives valuable information about second-generation internal migrants. Ethnic categorisation can be done in various ways, and researchers should consider what is appropriate for their specific research theme.
The main limitation of the study is the low participation rate, especially among younger men. We cannot rule out selection bias, and the small sample size may lead to insufficient power in statistical tests. This is particularly a problem for the second-generation male sample; analyses on this data can at best be used for hypothesis-generating analyses. However, we suppose some of the non-response is due to invitees regarding themselves outside the target population.
Another limitation is that the National Population Registry was not established until 1964. Hence, no information is available on relocations prior to that year. Additionally, since only migrants from some preselected municipalities were included in the survey, relocations of Sami (and non-Sami) from other parts of the country are not taken into account.
In 1996, it was decided that the municipal councils could declare city status for a community. This resulted in a number of new cities. It is a limitation that only a few of these are included in the present survey. Although most of the new cities are small, some of the excluded cities/municipalities have a large number of inhabitants. Especially, it is a limitation that densely populated municipalities in close proximity to Oslo are not included, as many families chose to move out of the city to the surrounding county Akershus [Citation48]. These issues may affect the external validity of our study; generalisations to the entire urban Sami and non-Sami populations in Norway should be avoided.
Concluding remarks and future research possibilities
The survey From Rural to Urban Living enables numerous research possibilities within the health and social sciences. A broad range of topics regarding people’s life circumstances, including traditional activities, experienced discrimination, social support, family ties and sense of belonging, may be analysed in connection to various health outcomes. More than one-third of both first- and second-generation participants reported Sami background, which allows for ethnic comparisons. The sample characteristics correspond well with national numbers and trends, including a high education level, especially for women. This gives reason to believe that the samples are representative of the source population. However, the low response rate, among younger men in particular, must be taken into account in future research when analysing the data and interpreting the results.
The national personal identification number enables linkages to national registers and other surveys. The first and second-generation samples may be combined and analysed together, and there is a possibility to link the second-generation participants to their parents. The survey was conducted close in time to the SAMINOR 2 Questionnaire Survey (2012) and the SAMINOR 2 Clinical Survey (2012–2014). The regions where the migrants grew up partly overlap with these two surveys, and several questions on health and living conditions were identical. Results may therefore be compared within overlapping regions and age groups.
The survey From Rural to Urban Living provides data for research that may contribute to new insight into the health, living conditions, culture and identity of the growing Sami population in urban areas of Norway. As data about the health status and challenges of Sami in Norwegian cities are limited, results from the survey will be valuable for health authorities when planning and implementing health services to the Sami in urban areas.
Acknowledgments
The Norwegian Ministry of Government Administration, Reform and Church Affairs (from 2013 the Norwegian Ministry of Local Government and Modernisation) provided funding for planning and data collection. The Centre for Sami Health Research receives basic funding from the Norwegian Ministry of Health and Care Services. The publication charges for this article have been funded by a grant from the publication fund of UiT The Arctic University of Norway. The authors would like to thank project coordinator Anne Karen Hætta for her important work during planning, questionnaire development, and data collection. We also thank Jon Todal, Kjetil Sørlie, and Per Selle for contributing to the development of the questionnaires. Finally, we are indebted to the participants for their valuable contributions.
Disclosure statement
The authors report no conflict of interest.
References
- Berg PO. Ulik respons på fraflytting og sentralisering. In: Bore RR, editor. Hundre års ensomhet? Norge og Sverige 1905-2005. Oslo, Norway: Statistics Norway; 2005. p. 110-118.
- Pedersen P. Applying longitudinal statistics in migration analysis: A case study of migration among young adults in Northern Norway. Norsk Geogr Tidsskr. 2013;67(5):295–12.
- Statistics Norway. Migration to/from the whole country, counties and municipalities (M) 2002-2019 [Web page]. Oslo, Norway: Statistics Norway; 2020. cited https://www.ssb.no/en/statbank/table/09588/?rxid=9a8299f9-14ac-4e2a-bef3-b1c12de7bb96
- Modig I. This is Norway 2019. Oslo, Norway: Statistics Norway; 2019. p. 88.
- Hartvedt H, Høydahl E. Population and land area in urban settlements [Web page]. Oslo, Norway:Statistics Norway; 2017. https://www.ssb.no/en/befolkning/statistikker/beftett.
- Hansen LI, Olsen B. Hunters in transition: an outline of early Sámi history. Leiden, The Netherlands: Koninklijke Brill NV; 2014. p. 416.
- Aubert V Den samiske befolkning i Nord-Norge - The lappish population in Northern Norway. Report. Oslo: Statistics Norway; 1978.
- Solbakk JT. The Sámi people: a handbook. Oslo, Norway: Davvi Girji OS; 2006. p. 295.
- Sønstebø A. Samisk statistikk 2018. Oslo, Norway: Statistics Norway; 2018. p. 75.
- Pedersen P, Moilanen M. The north Scandinavian pattern of migration among the young adult population 2000-2005. In: UDK B, Paulsgaard G, editors. Rural futures? Finding one’s place within changing labour markets. Stamsund, Norway: Orkana akademisk; 2012. p. 51–82.
- Slaastad TI. Samisk statistikk 2008. Oslo, Norway: Statistics Norway; 2008. p. 86.
- Pedersen P, Nyseth T. City-Saami: same i byen eller bysame? Skandinaviske byer i et samisk perspektiv. Karasjok, Norway: CálliidLágádus; 2015.
- Broderstad AR, Broderstad EG. Flytting og urbanisering: sapmi i forandring. In: Nystø SR, Guhttor M, Pedersen S, editors. Sametinget 25 år. Karasjok, Norway: Sametinget; 2014. p. 153–170.
- Dankertsen A “Men du kan jo snakke frognersamisk”: tradisjon og kulturell innovasjon blant samer i Oslo [Master thesis]. Oslo, Norway: University of Oslo; 2006.
- Gjerpe KK “The Best of Both Worlds” – Conceptualising an Urban Sámi Identity [Master thesis]. Tromsø, Norway: UiT The Arctic University of Norway; 2013.
- Nyseth T, Pedersen P. Urban Sami Identities in Scandinavia: hybridities, Ambivalences and Cultural Innovation. Acta Boreal. 2014;31(2):131–151.
- Vuolab SE Negotiating an Urban Indigenous Identity: – expectations, prejudices and claims faced by urban Sámi in two contemporary Norwegian cities [Master thesis]. Tromsø, Norway: UiT The Arctic University of Norway; 2016.
- Hudson C, Nyseth T, Pedersen P. Dealing with difference. City. 2019;23(4–5):564–579.
- Sørlie K, Broderstad AR. Flytting til byer fra distriktsområder med samisk bosetting. Oslo, Norway: Norwegian Institute for Urban and Regional Research (NIBR)/UiT The Arctic University of Norway; 2011. p. 76.
- Broderstad A, Sørlie K. Bo- og flyttetrender i norsk-samiske kommuner gjennom 40 år i relasjon til sysselsetting. Samiske tall forteller 5, kommentert samisk statistikk 2012. Samiske tall forteller. 1/2012. Kautokeino, Norway: Samisk høgskole; 2012. p. 44–71.
- Schumann L, Craig W, Rosu A. Minority in the majority: community ethnicity as a context for racial bullying and victimization. J Community Psychol. 2013;41(8):959–972.
- Hansen KL, Melhus M, Høgmo A, et al. Ethnic discrimination and bullying in the Sami and non-Sami populations in Norway: the SAMINOR study. Int J Circumpolar Health. 2008;67(1):97–113.
- Hansen KL. Ethnic discrimination and health: the relationship between experienced ethnic discrimination and multiple health domains in Norway’s rural Sami population. Int J Circumpolar Health. 2015;74:25125.
- Hansen KL, Melhus M, Lund E. Ethnicity, self-reported health, discrimination and socio-economic status: a study of Sami and non-Sami Norwegian populations. Int J Circumpolar Health. 2010;69(2):111–128.
- Hansen KL, Sorlie T. Ethnic discrimination and psychological distress: a study of Sami and non-Sami populations in Norway. Transcult Psychiatry. 2012;49(1):26–50.
- Lund E, Melhus M, Hansen KL, et al. Population based study of health and living conditions in areas with both Sami and Norwegian populations–the SAMINOR study. Int J Circumpolar Health. 2007;66(2):113–128.
- Brustad M, Hansen KL, Broderstad AR, et al. A population-based study on health and living conditions in areas with mixed Sami and Norwegian settlements - the SAMINOR 2 questionnaire study. Int J Circumpolar Health. 2014;73:23147.
- Broderstad AR, Hansen S, Melhus M. The second clinical survey of the population-based study on health and living conditions in regions with Sami and Norwegian populations - the SAMINOR 2 Clinical Survey: performing indigenous health research in a multiethnic landscape. Scand J Public Health. 2019;1403494819845574.
- Bhattacharyya G, Johnson RA. Statistical concepts and methods. New York, London: Wiley; 1977.
- Massey DS, Arango J, Hugo G, et al. Theories of international migration - a review and appraisal. Popul Dev Rev. 1993;19(3):431–466.
- Hagen-Zanker J Why do people migrate? A review of the theoretical literature. Maastricht Graduate School of Governance Working paper 2008/WP002, https://ssrn.com/abstract=1105657
- Lee ES. A theory of migration. Demography. 1966;3(1):47–57.
- Løken KV, Lommerud KE, Lundberg S. Your place or mine? On the residence choice of young couples in Norway. Demography. 2013;50(1):285–310.
- Krokstad S, Langhammer A, Hveem K, et al. Cohort Profile: the HUNT Study, Norway. Int J Epidemiol. 2013;42(4):968–977.
- Galea S, Tracy M. Participation rates in epidemiologic studies. Ann Epidemiol. 2007;17(9):643–653.
- Kyllingstad JR. Norwegian physical anthropology and the idea of a nordic master race. Curr Anthropol. 2012;53:S46–S56.
- Goyder J, Leiper JM. The Decline in Survey Response - a Social Values Interpretation. Sociology. 1985;19(1):55–71.
- Brick JM, Williams D. Explaining rising nonresponse rates in cross-sectional surveys. Ann Am Acad Polit Ss. 2013;645(1):36–59.
- Frøyland LR, von Soest T. Trends in the perpetration of physical aggression among norwegian adolescents 2007-2015. J Youth Adolesc. 2018;47(9):1938–1951.
- Jensen HAR, Ekholm O, Davidsen M, et al. The Danish health and morbidity surveys: study design and participant characteristics. BMC Med Res Methodol. 2019;19(1):91.
- Rolstad S, Adler J, Ryden A. Response burden and questionnaire length: is shorter better? A review and meta-analysis. Value Health. 2011;14(8):1101–1108.
- Bogen K The effect of questionnaire length on response rates - A review of the literature. American Statistical Association - 1996 Proceedings of the Section on Survey Research Methods. Washington, DC: American Statistical Association; 1996. p. 1020–1025.
- Tolonen H, Dobson A, Kulathinal S, et al. Effect on trend estimates of the difference between survey respondents and non-respondents: results from 27 populations in the WHO MONICA Project. Eur J Epidemiol. 2005;20(11):887–898.
- Norwegian official report. NOU No. 18. Om samenes rettsstilling. Oslo, Norway: Universitetsforlaget; 1984.
- Anderson I, Robson B, Connolly M, et al. Indigenous and tribal peoples’ health (The Lancet-Lowitja Institute Global Collaboration): a population study. Lancet. 2016;388(10040):131–157.
- Hohwu L, Lyshol H, Gissler M, et al. Web-Based versus traditional paper questionnaires: a mixed-mode survey with a nordic perspective. J Med Internet Res. 2013;15(8):e173.
- Sax LJ, Gilmartin SK, Bryant AN. Assessing response rates and nonresponse bias in web and paper surveys. Res High Educ. 2003;44(4):409–432.
- Stambøl LS. Flytting til og fra Oslos bydeler. Oslo, Norway: Statistics Norway; 2013. p. 1–102.