
ABSTRACT
Understanding ethnic variations in body composition is crucial for assessing health risks. Universal models may not suit all ethnicities, and there is limited data on the Inuit population. This study aimed to compare body composition between Inuit and European adults using computed tomography (CT) scans and to investigate the influence of demographics on these measurements. A retrospective analysis was conducted on 50 adults (29 Inuit and 21 European) who underwent standard trauma CT scans. Measurements focused on skeletal muscle index (SMI), various fat indices, and densities at the third lumbar vertebra level, analyzed using the Wilcoxon-Mann-Whitney test and multiple linear regression. Inuit women showed larger fat tissue indices and lower muscle and fat densities than European women. Differences in men were less pronouncehd, with only Intramuscular fat density being lower among Inuit men. Regression indicated that SMI was higher among men, and skeletal muscle density decreased with Inuit ethnicity and age, while visceral fat index was positively associated with age. This study suggests ethnic differences in body composition measures particularly among women, and indicates the need for Inuit-specific body composition models. It higlights the importance of further research into Inuit-specific body composition measurements for better health risk assessment.
Introduction
Body composition is strongly associated with overall health and well-being [Citation1,Citation2]. Its dynamic attributes are influenced by factors such as ageing, disease, or lifestyle [Citation2,Citation3], notably ethnicity and genetics [Citation4–8]. Although studies have investigated body composition among European, Asian, and African populations [Citation1,Citation9,Citation10], leading to a comprehensive insight into their body composition dynamics [Citation1,Citation2,Citation10], there remains a substantial gap in our understanding of the Inuit population. Indigenous to the Arctic region, the Inuit population traditionally had a way of life characterised by unique dietary patterns and environmental factors until the 1950–1960s [Citation11,Citation12]. However, subsequent decades have seen a shift towards more sedentary occupations and the inclusion of imported foods, replacing the traditional diet [Citation12]. Additionally, the Inuit population also possesses unique genetic variations when compared to other ethnic populations, such as European, African, and Asian populations [Citation7,Citation13,Citation14], along with distinct ethnic physiological traits, such as larger torso and shorter extremities [Citation15–17]. Given the distinct genetic makeup, dietary patterns, and environmental influence of the Inuit population, it is plausible to expect variations in their body composition when compared to other ethnic groups such as Europeans.
Skeletal muscle and various fat deposits are highly influential in health and disease [Citation1,Citation2,Citation18,Citation19]. Skeletal muscle is pivotal for physical function, metabolic health, and overall well-being [Citation1,Citation10]. Consequently, a decrease in skeletal muscle mass or excess fat infiltration is associated with adverse health outcomes, such as longer hospital stay, increased risk of complications, and even death [Citation1,Citation2,Citation20]. Different fat deposits, such as subcutaneous, visceral, and inter-/intramuscular fat deposits, have distinct metabolic implications. Visceral fat is associated with a higher risk of cardiovascular disease, diabetes, and metabolic syndrome, but the risk differs across ethnicity [Citation6,Citation7], making it a key focus in health research. Subcutaneous fat is less metabolically active than visceral fat; however, it still plays a role in overall health, insulation, and energy storage [Citation21].
Various methods have been employed to assess body composition, including anthropometric measurements and imaging tools [Citation22]. In recent decades, quantitative imaging tools such as computerised tomography (CT), have gained prominence, becoming essential for diagnostics and clinical evaluations [Citation23,Citation24]. This increase is not merely due to technological advancements but also because of the inherent advantages of CT over other methods [Citation3,Citation19]. Specifically, CT provides high-precision, detailed cross-sectional and 3D images and the ability to differentiate between tissue types [Citation3,Citation25]. As a result, CT scans contain invaluable information regarding body composition, enabling detailed quantification of muscle, and fat distributions [Citation3,Citation25]. The third lumbar vertebra level is commonly considered the gold standard for assessing CT-based body composition [Citation26–30], and recent studies have begun to account for differences in weight, height, and BMI [Citation26,Citation31]. Body composition measures based on a single axial slice are typically categorised by their respective compartments.
For skeletal muscle, it is quantified in terms of area (SMA, cm2) and height-adjusted muscle index (SMI, cm2/m2) [Citation26,Citation32–35]. Muscle quality is assessed through skeletal muscle density (SMD, mean Hounsfield Unit [HU]), with higher HU values indicating less fat infiltration, serving as a proxy for better muscle quality [Citation36]. Similar practices apply to different fat tissues, including subcutaneous fat area (SFA, cm2), visceral fat area (VFA, cm2), and inter- and intramuscular fat area (IMFA, cm2) [Citation35,Citation37]. Some studies also include height adjusted fat measures to accommodate for body size; subcutaneous fat index (SFI, cm2/m2) and visceral fat index (VFI, cm2), and density of subcutaneous fat (SFD, mean HU), visceral fat (VFD, mean HU) and inter and intra-muscular fat (IMFD, mean HU) [Citation30,Citation35,Citation38,Citation39]. Notably, CT-based body composition assessment is often conducted on individuals with different, if not multiple, comorbidities that can affect the body composition. Few studies have focused on CT-based body composition assessments among healthy study populations [Citation26,Citation30], and the Inuit population remains unexplored in this regard.
Given these considerations, we hypothesised that Inuit and European body composition measures are comparable.
Primary aim: To compare skeletal muscle and fat tissue height adjusted indices and densities between the Inuit and European populations stratified by sex.
Secondary aim: To explore whether demographic data; ethnicity, age, and sex can predict body composition measurements.
Methods
Study population
This was a retrospective comparative pilot study consisting of two pooled study populations from Queen Ingrid’s Hospital, Nuuk, Greenland, and The Northern Region of Denmark, respectively. Individuals were selected based on all trauma CT scans listed in Greenland from 2018 to 2022 and in the Northern Region of Denmark between 2012 and 2014. All individuals were consecutive throughout the study period. Eligibility required a standardised trauma CT scan with consecutive contrast-enhanced thoracic and abdominal CT scans. Individuals from Greenland were considered to be of Inuit descent if they had native names and were born in Greenland, thus excluding individuals with Western names or birthplaces outside Greenland. Conversely, individuals in Denmark were considered of European descent if they had Western names, which served as an ethnic origin indicator. The data collection period was limited to these specific time periods because of comparable standardised trauma CT protocols. The European study population from the Northern Region Denmark was previously described in detail by Brath et al. [Citation40].
Trauma CT protocols were selected due to the use of intravenous contrast (IVC), the included body area, and presumably healthy individuals. The inclusion criteria were as follows: ≥18 years, Inuit (Greenland), or European (Denmark) ethnicity. The individuals’s’ medical records were accessed at the time of the scanning procedure to evaluate the exclusion criteria. The exclusion criteria were previously described [Citation36], but were, in summary; no abdominal CT available, technical issues such as deviation from the standardised protocol and too narrow field of view, clinical issues, such as previous abdominal surgery, acute damage to the torso, intubation, or signs of circulatory shock at the time of the scan. Furthermore, individuals with comorbidities such as inflammatory diseases, diabetes, thyroid diseases, chronic obstructive pulmonary diseases, renal failure, and cancer, were excluded.
Trauma CT protocol
In Greenland, trauma scans were identified using a picture archiving and communication system (PACS). These scans were conducted with a Toshiba Aquilion One/Prime CT scanner (Toshiba America Medical Systems, USA). Individuals in Nuuk were positioned primarily in the supine position with arms down during the scans, necessitating the inclusion of individuals in both arms-down and arms-up positions. A single breath-hold was instructed during the scanning process. The individuals received 100 mL of 350 mg/ml IVC solution.
In Denmark, trauma scans were identified using PACS. Trauma scans from Denmark were conducted using the SOMATOM Definition Flash (Siemens Healthineers, Germany), or Light Speed Pro32, or Discovery CT750HD (General Electric Healthcare, USA). Individuals from the Northern Region of Denmark were exclusively in the supine position, with their arms above their heads. They were also instructed to perform a single breath-hold during the scan. The individuals received 100 mL of 400 mg/ml IVC solution. To ensure accuracy and consistency, all scanners underwent daily air calibration and monthly constancy testing utilising water and air phantoms provided by the manufacturers.
Bolus tracking was applied to optimise the timing of contrast injection. The CT parameters, contrast specifications, and bolus tracking parameters are listed in Supplementary Table S1.
Segmentation and body composition assessment
Rater 1 selected all images for segmentation in the study population from Greenland, based on a previously described method: A single axial slice at the anterior midline of the third lumbar vertebra was selected for body composition assessment [Citation41].
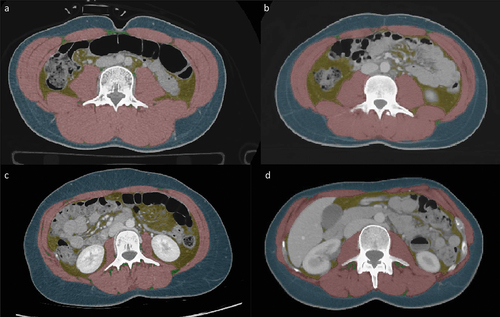
A feasible and validated semi-automated software known as “Viking slice” was used for the segmentation process [Citation37]. Muscle tissue was identified based on pixel signal intensities falling within the range of −29 to + 150 HU, whereas fat tissue was identified within the range of −190 to −30 HU. Intestinal organs and the gut lumen with pixel intensities within the defined ranges were manually excluded from further analysis. An example of the segmentation is shown in .
Figure 1. Show the CT derived body composition at third lumbar level. (a) A 24 year-old man of inuit decent with BMI 23.9; (b) A 19 year-old man of European decent with BMI 23.6; (c) A 29 year-old women of inuit decent with BMI 23.4; (d) A 40 year-old women of European decent with BMI 22.5. BMI: body mass index.
Two raters independently conducted the segmentation, as previously described. Rater 1: A pulmonologist fellow with five years of experience, and three years of experience in CT-derived body composition assessment. Rater 2 had 12 years of experience as a resident and about two years of experience as a radiologist fellow.
Low muscle threshold
Low skeletal muscle index and density were based on a previous mixed healthy study population and reported SMI and SMD cut-off of 34.4 cm2/m2 and 34.3 HU in women, and 45.4 cm2/m2, and 38.5 HU in men [Citation29].
Statistical analysis
Demographic data were reported as descriptive statistics. Continuous data were tested for normal distribution using the Shapiro-Wilk test. For normally distributed data, the mean (95% confidence interval (CI)) was used, whereas for non-normally distributed data, the median (range) was used. Categorical data were reported as total number (%). Missing data on body composition measures were removed from the specific analysis.
For normally distributed data, a variance deviation test was used to assess equal variance prior to using an independent t-test. An independent t-test was used to assess the differences between the two ethnic groups and between the sexes.
For non-normally distributed data, the Wilcoxon-Mann-Whitney test was used to assess differences between sexes and ethnic groups.
shows the selected variables for the linear regression based on the directed acyclic graph. A univariate linear regression model with robust variance was used to predict body composition based on individual demographic variables such as ethnicity, age, height, and sex. Height was not included as a separate variable in the height-adjusted index analysis. Weight was not included in the analysis because it was not available for most of the included individuals.
Figure 2. The selected variables are based on the following the simplified directed acyclic graph (DAG).
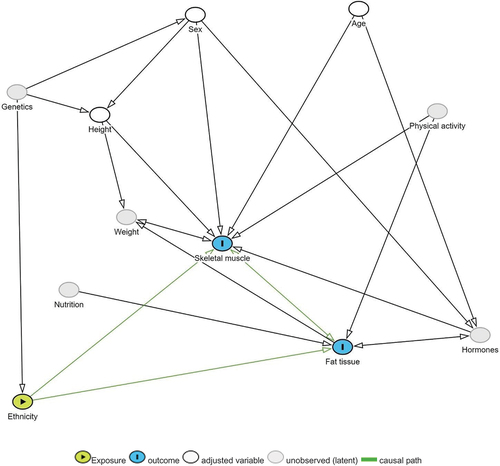
Multiple linear regression with robust variance was used to predict each of the body composition measures of skeletal muscle, subcutaneous fat, and visceral fat by ethnicity, age, height, and sex.
Ethical approval
This study was approved by the National Danish Scientific Ethics Committee (2300176), Scientific Ethics Committee of Greenland (2023–1344), and the Danish Data Protection Agency (F2023–121).
Results
As depicted in , our study included 29 individuals in the Inuit study population from Greenland, comprising 10 women and 19 men. The European study population comprised 21 individuals, including 10 women and 11 men. As shown in , there were no differences between the Inuit and Europeans in terms of age or height.
Figure 3. Shows the flow diagram of exclusion and inclusion of individuals from Nuuk, Greenland. CT: computed tomography.
Table 1. Shows the demographic characteristic for the total study population and stratified by Inuit and European study population.
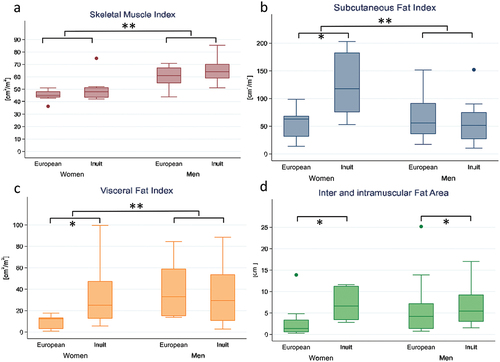
Differences in height between sexes wereobserved among both the Inuit and European populations, with men being taller than women. shows the body composition measurements in both populations stratified by sex. Women, regardless of ethnicity, exhibited lower height, SMI, SFD, VFI, and VFA/FSA than men. No individuals were considered to have a low SMI or SMD.
Table 2. Shows the body composition measures (median, (min, max)) between Inuit and European study population.
Body composition measures and differences between Inuit and European stratified by sex
Women
illustrates that Inuit women had a higher median SMI than European women did. Notably, Inuit women had a significantly lower SMD, and narrower range than European women did. illustrates the differences in both muscle and fat tissue measurements, indicating that Inuit women had a larger median SFI, VFI, and VFA/SFA ratio. Additionally, the range of these measurements was wider than that of European women, and the density of the fat tissue was significantly lower.
Figure 4. Shows the boxplots of the of body composition measures divided by sex and ethnicity. *p – value < 0.05 between ethnicity stratified by sex **p – value < 0.05 between sexes.
Men
Inuit men exhibited a larger median SMI with a broader range than European men. However, the median SMD was similar in both groups. European men had larger median SFI and VFI, but smaller range compared to Inuit men. The ratio between VFA and SFA was similar in both groups.
Unadjusted linear regression: body composition measures and demographics
A univariate linear regression analysis was used to predict skeletal muscle, subcutaneous and visceral fat measures based on the following variables: ethnicity, age, height, and sex considered independently. These variables were selected based on expected causality, as shown in .
Demographic predictors
As presented in , SMI was positively associated with both ethnicity and sex. Specifically, Inuit individuals exhibited higher SMI values. Men displayed larger SMI values than women. SMD was negatively associated with ethnicity and age, suggesting that Inuit individuals had a lower muscle density and that muscle density, or SMD, generally decreased with advancing age. There were no discernible associations between demographic variables and SFI, or SFD. The VFA/SFA ratio showed positive associations with age and sex. This ratio increased with both age, and men exhibited a higher VFA/SFA ratio compared to women. Lastly, SMD had a negative association with ethnicity, indicating that Inuit individuals possess a lower density in both inter and intra-muscular fat.
Table 3. Shows the univariate linear regression models for each of the body composition measures and each of the demographic variables ethnicity, age, height, and sex. Results are presented as estimates and 95% confidence intervals.
For detailed results of the univariate linear regression analysis for each of the body composition measures and each of the variables can be seen in supplementary linear regression – model fit plots.
Adjusted multiple linear regression: body composition measures and demographics
presents the multiple linear regression models for all body composition measures, incorporating demographic variables such as ethnicity, age, and sex. All models underwent assessments for multicollinearity and interactions between variables. Unless otherwise specified, no interaction or multicollinearity issues were found.
Table 4. Shows the multiple linear regression predictions for each of the body composition measures based on the variables ethnicity, age, height, and sex.
In the SMI model, it was significant that men had larger SMI values than women, The SMD model highlighted significant differences based on ethnicity and age, with Inuit individuals showing lower muscle density than Europeans and a decrease in SMD with advancing age. Moreover, in this model, there were notable positive interactions between ethnicity and sex, as well as between ethnicity and height.
For the measures SFI, SFD, and VFD, no significant models emerged. However, SFI, and SFD, significant interactions were found between ethnicity and sex, rendering these variables significant within their respective models. The models for VFA and VFI revealed a positive association with age, indicating an increase in VFI with age. The VFA/SFA ratio model showed positive associations with age and sex, suggesting a larger VFA/SFA ratio with increasing age and higher ratios in men than women. Lastly, the IMFD model illustrated a negative association with ethnicity, revealing that Inuit individuals had lower IMFD values than Europeans.
For detailed breakdown of results look at supplementary material S3, Fig. S3, and Table S3.
Discussion
This is the first study to assess CT-derived body composition in an Inuit population and contributes to a unique insight into Inuit body composition. Our findings suggest significant disparities in body composition measurements, particularly among women, suggesting that distinct ethnic traits need to be considered. Specifically, Inuit women had larger fat tissue indexes, coupled with lower muscle and fat densities, compared to their European counterparts. However, Inuit and European men showed more similar body composition measurements, with the notable exception of IMFD, which is lower in Inuit men. Demographic variables such as ethnicity, age, height, and sex were associated with certain body composition measures. We found that, Inuit was associated with lower SMD values, which also declined with increasing age. Observations also highlighted an increase in VFI and the VFA/SFA ratio with age, and Inuit individuals consistently presented with lower IMFD.
Skeletal muscle: clinical implications and ethnic considerations
An intriguing observation from our study was that Inuit women consistently exhibited larger fat tissue measurements and lower densities than their European counterparts did.
Notably, both Inuit men and women tended to have higher SMI values than Europeans. These observations may be attributed to the distinct body build of Inuit populations compared to Europeans, characterised by larger torsos and shorter limbs [Citation15,Citation16], which might result in larger muscles relative to body size, a trait that may not be captured by height alone. Despite previous findings suggesting that European men are taller than Inuit men [Citation42], our study found no significant height differences between the groups, possibly explaining the similarities in body composition measurements between European and Inuit men. In addition, the previously described height difference may also explain why the Inuit population was found to have a higher BMI than Europeans and Africans [Citation17,Citation42], and using the European BMI cut-off overestimates obesity among the Inuit population [Citation15,Citation17,Citation42]. Likewise, sex-specific cut-off values for SMI and SMD based on healthy Caucasian or mixed populations [Citation26,Citation29] may fail to reflect muscle characteristics in the Inuit. In our study, none of the individuals were considered to have reduced SMI or low muscle quality according to previous cut-off values presented by Van der Werf et al. or Derstine et al. [Citation26,Citation29]. Applying these thresholds could lead to a more extensive muscle reduction among the Inuit population before the detection of pathological changes, potentially delaying the necessary interventions. In addition, Inuit displayed a much lower SMD than Europeans, even with IVC-enhanced CT scans, suggesting a risk of misclassifying the normal muscle quality in Inuit as low and a need for ethnic-specific health metrics. This discrepancy could stem from common genetic differences unique to the Inuit population, such as reduced insulin-mediated glucose uptake in muscles [Citation43], necessitating alternate muscle metabolism. This genetic variation has also been linked to Inuit, which has a lower hand grip strength than Europeans [Citation43]. It is intriguing whether this genetic factor might also contribute to lower SMD in Inuit, an area warranting further research given the established link between lower SMD and reduced muscle strength [Citation43].
Moreover, SMD decreased across all populations, reflecting the shift in muscle fibres, and increasing fat [Citation1,Citation6,Citation18,Citation44–47]. However, this has primarily been assessed in European and Asian populations [Citation1,Citation6,Citation9,Citation10]. Our finding of significant associations between SMD and VFD with ethnicity raises intriguing questions about fat tissue type content and potential brown fat deposits in Inuit. Therefore, care should be taken when interpreting body composition as it may result in misinterpretation as unhealthy body composition with increased health risk compared to Europeans.
Fat tissue: clinical implications and ethnic considerations
In our study, we observed significant differences in fat tissue measurements between Inuit and European women. Inuit women had larger SFI, VFI, and VFA/SFA ratio, along with lower fat densities than European women. These findings may represent a healthy and typical fat distribution pattern in the Inuit female population. In contrast, fat distribution and median values were more similar between the Inuit and European men.
Although there was no significant difference in female height across groups, Inuit women generally had a lower height than European women. This lower stature may partially explain the higher height-adjusted indices observed among the Inuit women. However, it is important to note that the VFA/SFA ratio has been previously identified as an independent predictor of cardiovascular risk in Japanese patients with diabetes [Citation48]. In another study, abdominal fat distribution assessed by ultrasound imaging showed Europeans have higher levels of VFA than Inuit and Africans, increasing with BMI [Citation42]. A third study reported aa mean VFA of 77.0 ± 50.9 cm2 among women of mixed ethnicities [Citation30], which is considerably larger than any of our median VFA measurements observed in the current study. The larger average VFA might be attributed to the fact that more than 60% of the study population was considered overweight or obese [Citation30] and obesity is a much larger health issue than in European countries and Greenland [Citation49]. Consequently, it remains unclear whether the differences observed between the two study populations can be explained entirely by ethnic traits or other factors. In addition, VFA VFI, and VFA/SFA ratio increased with age, while IMFD was lower among the Inuit population. One could speculate whether the density and larger fat tissue measures could be linked to some of the genetic variations and brown fat storage.
Historical and genetic context
To gain deeper insights into the body composition of Inuit and Europeans, and how they potentially differ, it is essential to consider the historical context in which the lifestyle and genetics of the Inuit population have evolved. As a founder population, the Inuit traditionally maintained a highly active lifestyle combined with unique dietary patterns, with high protein and fat intake [Citation11,Citation12,Citation50] coupled with genetic variations resulting from multiple genetic bottlenecks [Citation12].
In the Arctic environment, the Inuit genome has evolved with specific variations, distinguishing it from the European and Han Chinese lineages [Citation51]. These genetic variations in the Inuit populations contribute to the conversion of dietary fatty acids to their active forms and mitigate the oxidative challenges of a high-fat diet [Citation51]. Some of these genetic variations are related to brown fat formation [Citation8]. Notably, some Inuit genetic markers are linked to insulin resistance and decreased glucose uptake in skeletal muscle [Citation43,Citation52], whereas others are related to cold climate adaptation and are vital regulators of fatty acid metabolism [Citation5,Citation53].
Changes in the way of life have significantly affected the prevalence of obesity, metabolic syndrome, and diabetes in the Inuit [Citation54] and European populations [Citation6]. Metabolic risk factors have been shown to differ across ethnicities [Citation6,Citation7,Citation15,Citation42,Citation55] and definitions of skeletal muscle cut-off values vary [Citation1,Citation9]. However, questions remain regarding what contributes to healthy body composition and the appropriate standards to apply. Factors governing fat distribution, including sex, genetics, epigenetics, and the environment [Citation6] may collectively explain the greater fat distribution in Inuit women. Dietary intake, sedentary occupation, and genetic factors may have influenced these changes. Nevertheless, the precise mechanisms underlying the observed differences between muscle and fat tissues remain unknown and require further investigation before application and clinical interpretation is possible.
Considerations in body composition analysis
Anthropometric measures, such as BMI and circumference, are beneficial for broad population assessment, as they are easy to use in many clinical settings. However, they are often limited in their ability to provide detailed information on tissue-specific distribution and density [Citation19,Citation22]. Ultrasound imaging can visualise subcutaneous and visceral fat layers, as well as muscle tissue. However, it can be operator-dependent and may not capture the comprehensive body composition [Citation22]. Bioelectric impedance estimates the body composition based on the conductivity of various tissues. Despite being quick and non-invasive it can be influenced by hydration status and does not provide detailed anatomical tissue distribution [Citation22]. Dual-energy X-ray absorptiometry is often referred to as the gold standard in body composition analysis, as it presents detailed insights on bone, and lean mass distribution, but can be influenced by the thickness of the tissue with potential underestimation of fat and overestimation of muscle in obese patients [Citation19,Citation22]. On the other hand, CT offers a comprehensive three-dimensional view of muscle and fat tissue distribution and densities with layer-by-layer precision that is not easily achieved with other modalities [Citation3,Citation22]. A downside is the exposition of radiation. However, it has diminished over the years and CT scans have become more frequently used and implemented as part of clinical controls in a wide range of acute and chronic diseases [Citation19]. However, with CT, there are some methodological considerations that need to be considered such as CT parameters and usage of IVC.
Methodological considerations
Notably, this study comprises a pooled population of 21 individuals of European descent and 29 individuals of Inuit descent. The patient’s ethnicity was selected based on name and place of birth. There may be a risk that individuals considered Inuit are mixed Inuit and European descent or of European descent and vice versa. It has previously been observed that the Inuit population has an average of 25% European ancestry [Citation14]. Another important consideration is that this study did not know the dietary patterns, nutritional intake, physical activity, or occupation of the individuals included. Individuals were presumed healthy, but undiagnosed comorbidities may occur, though the risks are considered minor based on cross-referencing with verified diagnoses and medical prescriptions at the time of the CT scan. Despite efforts to ensure equivalent CT protocols across the study populations, there were differences in the positioning of the individuals, the iodine concentration of the IVC, and the reconstruction slice thickness.
Firstly, given the difference in patient positioning, individuals of Inuit descent were primarily positioned with arms down during the CT scans. In the population of individuals of European descent, all were positioned with arms raised above the head. There may be a theoretical stretch on the muscles when the arms are up versus down. However, whether the arm’s position affects body composition measures is unknown.
Secondly, the Inuit population received 50 mg/mL less iodine in the IVC than Europeans. This difference could influence tissue density, making it less prominent in the Inuit population, given the properties of iodine in scattering and absorbing an energy beam [Citation56]. One contributing factor to our results might be the fixed volume of 100 mL for the IVC, which did not account for differences in body size between women and men and across ethnicity. As a result, the European population received more iodine than Inuit, which may be more prominent in European women, given the higher iodine concentration. Another point regarding IVC could be that the steatotic muscle area is more vulnerable to the effects of IVC enhancement than healthier muscle, as described by Morsbach et al. [Citation35]. At the same time, another study has shown that IVC affected the SFA by a median of −0.4% (limits of agreement −9.9 to 6.9 cm2), VFA −2.0% (limits of agreement −22.7 to 18.3 cm2), IMFA − 9.3% (limits of agreement −6.4 to 1.2 cm2) [Citation57].
Thirdly, there are some discrepancies regarding the effect of reconstructed slice thickness. One study found an increase in SMA of 1.11% with an increase in slice thickness from 2 to 5 mm and a decrease in SMD by 11.64% [Citation33], whereas others have found a decrease of 0.8% in muscle measures ranging from 2 mm to 5 mm [Citation35]. For fat tissue, a study has shown that a thinner slice increased SFA by 0.2%, VFA by 3%, and IMFA by 17.3% [Citation57]. One could speculate whether slice thickness has a clinically relevant impact on body composition measurements as differences are minor and fall within the expected uncertainties of manual or semi-automated segmentation with intra-analyst variation described in other studies [Citation35,Citation40]. An improvement could be to resample with the same slice thickness using fully automated solutions to save precious staff resources and avoid inter and intra-rater variations and intra-patient variability in measurements [Citation58]. However, this requires fully automated software programs achieve higher inter and intra-rater agreement [Citation27,Citation58,Citation59].
It is crucial to exercise caution when interpreting the study’s findings and avoid generalising them to larger populations, as this study is based on a small, underpowered study population. Nevertheless, this pilot study lays the groundwork for further research in this field, providing valuable insights into the CT-based body composition of the Inuit population. Given the unique variations, larger, more extensive studies are needed to ensure power, generalisability, and other factors, such as nutrition, physical activity, and genetics.
Conclusion
This study indicates that Inuit and European women were not comparable on most of the CT-based body composition measures, whereas men seemed to be comparable across ethnicity. Some of the demographic variables may be used to predict skeletal muscle and visceral fat measures. There was high inter-rater agreement of the measurements. Therefore, further investigations into Inuit CT-based body composition measures are needed to accommodate an appropriate definition of a healthy body composition.
Abbreviations
| BMI | = | Body mass index |
| CT | = | Computerized tomography |
| HU | = | Hounsfield unit |
| IMFA | = | Inter and intramuscular fat area |
| IMFD | = | Inter and intramuscular fat density |
| IVC | = | Intravenous contrast |
| SFA | = | Subcutaneous fat area |
| SFD | = | Subcutaneous fat density |
| SFI | = | Subcutaneous fat index |
| SMA | = | Skeletal muscle area |
| SMD | = | Skeletal muscle density |
| SMI | = | Skeletal muscle index |
| VFA | = | Visceral fat area |
| VFD | = | Visceral fat density |
| VFI | = | Visceral fat index |
Supplementary material clean revised.docx
Download MS Word (1.7 MB)Acknowledgments
Radiographer Pernille Veiss-Pedersen, Aalborg University Hospital, Denmark, deserves a special acknowledgement for her assistant invaluable assistance in identification of CT protocols, providing training in various programs, and unwavering support.
Radiologist Alexandra Kramarz from Queen Ingrid hospital, Nuuk, Greenland, made a significant contribution by facilitating the comparability of the CT protocols from Greenland.
All authors have contributed significantly to this study and manuscript.
The AI-based grammar tool “Paperpal” by Researcher.life was used only for grammatical purposes to refine language and enhance the quality of the manuscript.
Data availability statement
Data is not available due to ethical and legal data policies.
Disclosure statement
No potential conflict of interest was reported by the authors.
Supplementary material
Supplemental data for this article can be accessed online at https://doi.org/10.1080/22423982.2024.2312663
Additional information
Funding
References
- Cruz-Jentoft AJ, Bahat G, Bauer J, et al. Sarcopenia: revised European consensus on definition and diagnosis. Age Ageing. 2019;48(4):601. doi: 10.1093/ageing/afz046
- Cederholm T, Jensen GL, Correia M, et al. GLIM criteria for the diagnosis of malnutrition – a consensus report from the global clinical nutrition community. Clin Nutr. 2019;38(1):1–13. doi: 10.1016/j.clnu.2018.08.002
- Prado CM, Heymsfield SB. Lean tissue imaging: a new era for nutritional assessment and intervention. JPEN J Parenter Enteral Nutr. 2014;38(8):940–953. doi: 10.1177/0148607114550189
- Heymsfield SB, Peterson CM, Thomas DM, et al. Why are there race/ethnic differences in adult body mass index–adiposity relationships? A quantitative critical review. Obes Rev. 2016;17(3):262–275. doi: 10.1111/obr.12358
- Andersen MK, Hansen T. Genetics of metabolic traits in greenlanders: lessons from an isolated population. J Intern Med. 2018;284(5):464–477. doi: 10.1111/joim.12814
- Sun C, Kovacs P, Guiu-Jurado E. Genetics of body fat distribution: comparative analyses in populations with European, Asian and African ancestries. Genes (Basel). 2021;12(6):841. doi: 10.3390/genes12060841
- Jørgensen ME, Borch-Johnsen K, Stolk R, et al. Fat distribution and glucose intolerance among Greenland Inuit. Diabetes Care. 2013;36(10):2988–2994. doi: 10.2337/dc12-2703
- Racimo F, Gokhman D, Fumagalli M, et al. Archaic adaptive introgression in TBX15/WARS2. Mol Biol Evol. 2017;34:509–524. doi: 10.1093/molbev/msw283
- Rush EC, Freitas I, Plank LD. Body size, body composition and fat distribution: comparative analysis of European, Maori, Pacific Island and Asian Indian adults. Br J Nutr. 2009;102(4):632–641. doi: 10.1017/s0007114508207221
- Chen LK, Woo J, Assantachai P, et al. Asian working group for Sarcopenia: 2019 consensus update on Sarcopenia diagnosis and treatment. J Am Med Dir Assoc. 2020;21(3):300–307.e2. doi: 10.1016/j.jamda.2019.12.012
- Mullie P, Deliens T, Clarys P. East-Greenland traditional nutrition: a reanalysis of the Inuit energy balance and the macronutrient consumption from the høygaard nutritional data (1936-1937). Int J Circumpolar Health. 2021;80(1):1932184. doi: 10.1080/22423982.2021.1932184
- Senftleber NK, Overvad M, Dahl-Petersen IK, et al. Diet and physical activity in Greenland: genetic interactions and associations with obesity and diabetes. Appl Physiol Nutr Metab. 2021;46(8):849–855. doi: 10.1139/apnm-2021-0020
- Pedersen CT, Lohmueller KE, Grarup N, et al. The effect of an extreme and prolonged population bottleneck on patterns of deleterious variation: insights from the Greenlandic Inuit. Genetics. 2017;205(2):787–801. doi: 10.1534/genetics.116.193821
- Moltke I, Fumagalli M, Korneliussen TS, et al. Uncovering the genetic history of the present-day Greenlandic population. Am J Hum Genet. 2015;96(1):54–69. doi: 10.1016/j.ajhg.2014.11.012
- Charbonneau-Roberts G, Saudny-Unterberger H, Kuhnlein HV, et al. Body mass index may overestimate the prevalence of overweight and obesity among the inuit. Int J Circumpolar Health. 2005;64(2):163–169. doi: 10.3402/ijch.v64i2.17969
- Charbonneau-Roberts G, Young TK, Egeland GM. Inuit anthropometry and insulin resistance. Int J Circumpolar Health. 2007;66(2):129–134. doi: 10.3402/ijch.v66i2.18242
- Andersen S, Fleischer Rex K, Noahsen P, et al. Raised BMI cut-off for overweight in Greenland Inuit–a review. Int J Circumpolar Health. 2013;72(1):21086. doi: 10.3402/ijch.v72i0.21086
- Prado CM, Purcell SA, Alish C, et al. Implications of low muscle mass across the continuum of care: a narrative review. Ann Med. 2018;50(8):675–693. doi: 10.1080/07853890.2018.1511918
- Mareschal J, Achamrah N, Norman K, et al. Clinical value of muscle mass assessment in clinical conditions associated with malnutrition. J Clin Med. 2019;8(7):1040. doi: 10.3390/jcm8071040
- Holst M, Beck AM, Rasmussen HH, et al. Insufficient intake of energy and protein is related to physical functional capacity among COPD patients referred to municipality based pulmonary rehabilitation. Clin Nutr ESPEN. 2019;30:35–41. doi: 10.1016/j.clnesp.2019.02.009
- Małodobra-Mazur M, Cierzniak A, Pawełka D, et al. Metabolic differences between subcutaneous and visceral adipocytes differentiated with an excess of saturated and monounsaturated fatty acids. Genes (Basel). 2020;11(9):1092. doi: 10.3390/genes11091092
- Barazzoni R, Jensen GL, Correia M, et al. Guidance for assessment of the muscle mass phenotypic criterion for the global leadership initiative on malnutrition (GLIM) diagnosis of malnutrition. Clin Nutr. 2022;41(6):1425–1433. doi: 10.1016/j.clnu.2022.02.001
- Winder M, Owczarek AJ, Chudek J, et al. Are we overdoing it? Changes in diagnostic imaging workload during the years 2010–2020 including the impact of the SARS-CoV-2 pandemic. Healthcare. 2021;9(11):1557. doi: 10.3390/healthcare9111557
- Radiological procedures in Denmark. eSundhed, the Danish Health Data Authority. [cited 2022 Nov 08]. Available from: https://www.esundhed.dk/Emner/Operationer-og-diagnoser/Radiologiske-undersoegelser.
- Heymsfield SB, Gonzalez MC, Lu J, et al. Skeletal muscle mass and quality: evolution of modern measurement concepts in the context of sarcopenia. Proc Nutr Soc. 2015;74(4):355–366. doi: 10.1017/S0029665115000129
- van der Werf A, Langius JAE, de van der Schueren MAE, et al. Percentiles for skeletal muscle index, area and radiation attenuation based on computed tomography imaging in a healthy Caucasian population. Eur J Clin Nutr. 2018;72:288–296. doi: 10.1038/s41430-017-0034-5
- Paris MT, Tandon P, Heyland DK, et al. Automated body composition analysis of clinically acquired computed tomography scans using neural networks. Clin Nutr. 2020;39(10):3049–3055. doi: 10.1016/j.clnu.2020.01.008
- Derstine BA, Holcombe SA, Goulson RL, et al. Quantifying Sarcopenia reference values using lumbar and thoracic muscle areas in a healthy population. J Nutr Health Aging. 2018;22(1):180–185. doi: 10.1007/s12603-017-0983-3
- Derstine BA, Holcombe SA, Ross BE, et al. Skeletal muscle cutoff values for sarcopenia diagnosis using T10 to L5 measurements in a healthy US population. Sci Rep. 2018;8(1):11369. doi: 10.1038/s41598-018-29825-5
- Derstine BA, Holcombe SA, Ross BE, et al. Healthy US population reference values for CT visceral fat measurements and the impact of IV contrast, HU range, and spinal levels. Sci Rep. 2022;12(1):2374. doi: 10.1038/s41598-022-06232-5
- Derstine BA, Holcombe SA, Ross BE, et al. Optimal body size adjustment of L3 CT skeletal muscle area for sarcopenia assessment. Sci Rep. 2021;11(1):279. doi: 10.1038/s41598-020-79471-z
- van der Werf A, Dekker IM, Meijerink MR, et al. Skeletal muscle analyses: agreement between non-contrast and contrast CT scan measurements of skeletal muscle area and mean muscle attenuation. Clin Physiol Funct Imaging. 2018;38(3):366–372. doi: 10.1111/cpf.12422
- Fuchs G, Chretien YR, Mario J, et al. Quantifying the effect of slice thickness, intravenous contrast and tube current on muscle segmentation: implications for body composition analysis. Eur Radiol. 2018;28(6):2455–2463. doi: 10.1007/s00330-017-5191-3
- Rollins KE, Javanmard-Emamghissi H, Awwad A, et al. Body composition measurement using computed tomography: does the phase of the scan matter? Nutrition. 2017;41:37–44. doi: 10.1016/j.nut.2017.02.011
- Morsbach F, Zhang YH, Martin L, et al. Body composition evaluation with computed tomography: contrast media and slice thickness cause methodological errors. Nutrition. 2019;59:50–55. doi: 10.1016/j.nut.2018.08.001
- Goodpaster BH, Kelley DE, Thaete FL, et al. Skeletal muscle attenuation determined by computed tomography is associated with skeletal muscle lipid content. J Appl Physiol (1985). 2000;89(1):104–110. doi: 10.1152/jappl.2000.89.1.104
- Anyene I, Caan B, Williams GR, et al. Body composition from single versus multi-slice abdominal computed tomography: concordance and associations with colorectal cancer survival. J Cachexia Sarcopenia Muscle. 2022;13(6):2974–2984. doi: 10.1002/jcsm.13080
- Paris MT, Furberg HF, Petruzella S, et al. Influence of contrast administration on computed tomography–based analysis of visceral adipose and skeletal muscle tissue in clear cell renal cell carcinoma. JPEN J Parenter Enteral Nutr. 2018;42(7):1148–1155. doi: 10.1002/jpen.1067
- Ahn H, Kim DW, Ko Y, et al. Updated systematic review and meta-analysis on diagnostic issues and the prognostic impact of myosteatosis: a new paradigm beyond sarcopenia. Ageing Res Rev. 2021;70:101398. doi: 10.1016/j.arr.2021.101398
- Brath MSG, Sahakyan M, Mark EB, et al. Association between thoracic and third lumbar CT-derived muscle mass and density in Caucasian patients without chronic disease: a proof-of-concept study. Eur Radiol Exp. 2023;7(1):26. doi: 10.1186/s41747-023-00340-1
- Ozola-Zalite I, Mark EB, Gudauskas T, et al. Reliability and validity of the new VikingSlice software for computed tomography body composition analysis. Eur J Clin Nutr. 2019;73(1):54–61. doi: 10.1038/s41430-018-0110-5
- Rønn PF, Andersen GS, Lauritzen T, et al. Ethnic differences in anthropometric measures and abdominal fat distribution: a cross-sectional pooled study in Inuit, Africans and Europeans. J Epidemiol Community Health. 2017;71(6):536–543. doi: 10.1136/jech-2016-207813
- Moltke I, Grarup N, Jørgensen ME, et al. A common Greenlandic TBC1D4 variant confers muscle insulin resistance and type 2 diabetes. Nature. 2014;512(7513):190–193. doi: 10.1038/nature13425
- Goodpaster BH, Carlson CL, Visser M, et al. Attenuation of skeletal muscle and strength in the elderly: the health ABC study. J Appl Physiol (1985). 2001;90(6):2157–2165. doi: 10.1152/jappl.2001.90.6.2157
- Miljkovic I, Kuipers AL, Cauley JA, et al. Greater skeletal muscle fat infiltration is associated with higher all-cause and cardiovascular mortality in older men. J Gerontol A Biol Sci Med Sci. 2015;70(9):1133–1140. doi: 10.1093/gerona/glv027
- Wilkinson DJ, Piasecki M, Atherton PJ. The age-related loss of skeletal muscle mass and function: measurement and physiology of muscle fibre atrophy and muscle fibre loss in humans. Ageing Res Rev. 2018;47:123–132. doi: 10.1016/j.arr.2018.07.005
- Amini B, Boyle SP, Boutin RD, et al. Approaches to assessment of muscle mass and myosteatosis on computed tomography: a systematic review. J Gerontol A Biol Sci Med Sci. 2019;74(10):1671–1678. doi: 10.1093/gerona/glz034
- Fukuda T, Bouchi R, Takeuchi T, et al. Ratio of visceral-to-subcutaneous fat area predicts cardiovascular events in patients with type 2 diabetes. J Diabetes Investig. 2018;9(2):396–402. doi: 10.1111/jdi.12713
- Janssen F, Bardoutsos A, Vidra N. Obesity prevalence in the long-term future in 18 European Countries and in the USA. Obes Facts. 2020;13(5):514–527. doi: 10.1159/000511023
- Jeppesen C, Bjerregaard P. Consumption of traditional food and adherence to nutrition recommendations in Greenland. Scand J Public Health. 2012;40(5):475–481. doi: 10.1177/1403494812454467
- Fumagalli M, Moltke I, Grarup N, et al. Greenlandic Inuit show genetic signatures of diet and climate adaptation. Science. 2015;349(6254):1343–1347. doi: 10.1126/science.aab2319
- Overvad M, Diaz LJ, Bjerregaard P, et al. The effect of diabetes and the common diabetogenic TBC1D4 p.Arg684Ter variant on cardiovascular risk in Inuit in Greenland. Sci Rep. 2020;10(1):22081. doi: 10.1038/s41598-020-79132-1
- Rajakumar C, Ban MR, Cao H, et al. Carnitine palmitoyltransferase IA polymorphism P479L is common in Greenland Inuit and is associated with elevated plasma apolipoprotein A-I. J Lipid Res. 2009;50(6):1223–1228. doi: 10.1194/jlr.P900001-JLR200
- Pedersen ML. Diabetes care in the dispersed population of Greenland. A new model based on continued monitoring, analysis and adjustment of initiatives taken. Int J Circumpolar Health. 2019;78(sup1):1709257. doi: 10.1080/22423982.2019.1709257
- Ronn PF, Andersen GS, Lauritzen T, et al. Abdominal visceral and subcutaneous adipose tissue and associations with cardiometabolic risk in Inuit, Africans and Europeans: a cross-sectional study. BMJ Open. 2020;10(9):e038071. 10.1136/bmjopen-2020-038071
- Rogers DC, Tadi P. Intravenous contrast. Treasure Island (FL): StatPearls; 2023.
- Troschel AS, Troschel FM, Fuchs G, et al. Significance of acquisition parameters for adipose tissue segmentation on CT images. AJR Am J Roentgenol. 2021;217(1):177–185. doi: 10.2214/ajr.20.23280
- Koitka S, Kroll L, Malamutmann E, et al. Fully automated body composition analysis in routine CT imaging using 3D semantic segmentation convolutional neural networks. Eur Radiol. 2021;31(4):1795–1804. doi: 10.1007/s00330-020-07147-3
- Mai DVC, Drami I, Pring ET, et al. A systematic review of automated segmentation of 3D computed-tomography scans for volumetric body composition analysis. J Cachexia Sarcopenia Muscle. 2023;14(5):1973–1986. doi: 10.1002/jcsm.13310