
ABSTRACT
In Alaska, the 1918–20 influenza pandemic was devastating, with mortality rates up to 90% of the population, while in other arctic regions in northern Sweden and Norway mortality was considerably lower. We investigated the timing and age-patterns in excess mortality in Greenland during the period 1918–21 and compare these to other epidemics and the 1889–92 pandemic. We accessed the Greenlandic National Archives and transcribed all deaths from 1880 to 1921 by age, geography, and cause of death. We estimated monthly excess mortality and studied the spatial-temporal patterns of the pandemics and compared them to other mortality crises in the 40-year period. The 1918–21 influenza pandemic arrived in Greenland in the summer of 1919, one year delayed due to ship traffic interruptions during the winter months. We found that 5.2% of the Greenland population died of the pandemic with substantial variability between counties (range, 0.1% to 11%). We did not see the typical pandemic age-pattern of high young-adult mortality, possibly due to high baseline mortality in this age-group or remoteness. However, despite substantial mortality, the mortality impact was not standing out relative to other mortality crises, or of similar devastation reported in Alaskan populations.
Introduction
The 1918–20 influenza pandemic remains the deadliest influenza pandemic in recorded history. Although its origins remain contested, it is widely believed that it began in the spring of 1918, after which it spread across the globe and resulted in 50–100 million deaths worldwide [Citation1,Citation2]. There were, however, large regional disparities in the mortality experience of the pandemic. Previous studies have concluded that Indigenous populations were harder hit than the European and white North American populations [Citation3,Citation4]. In Alaska, half of the indigenous villages on the Seward Peninsula had mortality rates that ranged between 47 and 90%, which contrasts the non-Indigenous populations’ mortality rates of 0.47% [Citation3]. These staggering mortality rates, however, do not seem to be generalisable for all Arctic Indigenous populations. Among the Sami in Norway and Sweden, mortality rates were up to 3%, and a study of Egedesminde (today Aasiaat) in Greenland found a similar 2% mortality rate [Citation3,Citation5–7]. Whether the mortality rate in Aasiaat is representative of the rest of Greenland, is unclear, as no other studies have been done. The purpose of this study is to investigate the spatial and temporal trends of excess mortality associated with the 1918–20 influenza pandemic in Greenland. Specifically, we aim to 1) investigate how and when the pandemic arrived in Greenland and how it spread; 2) estimate the total mortality burden that can be attributed to the pandemic and any regional differences and to 3) estimate the age-pattern of excess mortality. Lastly, we compare the estimates from the 1918–20 pandemic to those of the earlier 1889–92 pandemic. Earlier research has shown that the high young-adult mortality seen during the 1918–20 pandemic in mainly Europe as well as other regions, may be related to early life exposure during the 1889–92 pandemic [Citation7,Citation8]. We will investigate whether this pattern exist in Greenland as well.
Materials and methods
Geographic context
Greenland was first colonised by the kingdom of Denmark-Norway in 1721, when the pastor Hans Egede established a colony at the site of Greenland’s current capital Nuuk. The trade between Denmark-Norway and the Inuits that inhabited Greenland intensified during the eighteenth century because of a growing European desire for whale and seal blubber. Greenland became a colony under Denmark-Norway, and during the nineteenth century a series of trade posts (known as colonies) were established along Greenland’s west coast. While the Europeans that moved to Greenland lived in these trade posts as missionaries or traders, most Inuit lived in small settlements along the coasts in a hunter-gatherer lifestyle. The Inuit hunter-gatherer lifestyle remained important into the twentieth century, and in 1953, Greenland formally ceased to be a Danish colony and became a county instead.
Europe and the non-Indigenous North America had undergone an epidemiological transition from high infectious disease mortality to a pattern of lower mortality dominated by deaths due to cardiovascular and degenerative diseases in the late nineteenth and early twentieth centuries [Citation9]. Greenland, however, first underwent the epidemiological transition after its decolonisation in the second half of the twentieth century [Citation10,Citation11]. At the time of the 1918–20 pandemic, respiratory diseases were therefore the leading cause of death, and the population was vulnerable to the novel influenza virus [Citation10]. At the time of the pandemic, most contact between Greenland and the outside world took place via ships from Denmark and Norway. The pandemic hit Norway in June 1918 and Denmark in July 1918. A herald wave hit Copenhagen and spread to the rural districts in August before declining once more in September. While the herald wave was benign in mortality, the second wave during the fall and winter of 1918–19 was much more devastating [Citation12–15]. When the second wave hit Europe, the coasts of Greenland were frozen and the only accessible point of entry for ships was Disco Bay. In addition, the North Atlantic experienced fierce storms during the winter, which made seafaring dangerous. This meant that connectivity to and from Greenland was very limited during the winter and spring of 1919.
Greenland was divided into 15 parishes in 1918 that each spanned hundreds of kilometres of coastline. The centre of each parish was the trade station, but most of the population lived in small, scattered coastal settlements and often moved between coastal settlements during the summer and winter settlements in the highlands. According to a 1912 survey there were 191 settlements, and the population recorded at the census of 1911 was 13.459 [Citation16].
Data
The source material for this study is composed of burial records from Greenlandic parish registers. The burial records were accessed through the Greenlandic National Archive’s website and are available in scanned formats [Citation17]. We transcribed dates of death, age, sex, and causes of death for all burials from 1880 to 1921. In total, 12.855 deaths were transcribed. Out of the total 15 parishes, 12 have parish registers that date back to the 1880s. Cause-of-death registration was conducted by local clergy or colonial administrators with little medical certification, and consequently the causes of death are difficult to interpret from a modern medical perspective. While some, including “pneumonia”, “influenza”, “tuberculosis”, “erysipelas”, and “whooping cough” are recognisable, many others were non-specific, including “stomach affection”, “brain affection”, and “internal affection”. Finally, the causes of death among infants and children are vague, with “newbornness”, “convulsions”, with the non-specific cause “childhood disease” appearing frequently.
Medical historians of Greenland agree that the medical nomenclature used by Danish doctors in Greenland should be seen in the light of the biological typologies that characterised the colonial era. At the time, it was thought that there were fundamental biological differences between Europeans and Indigenous populations, and certain disease conditions became attributed to specific ethnicities [Citation18]. Historian Søren Rud exemplifies this with a neurological condition called “kayak dizziness”, where the hunters lost sense of time and space while on the water, and it could have fatal outcomes [Citation18]. While kayak dizziness does not appear in the cause-of-death nomenclature in the parish registers, another diagnosis specific for Greenland does: “sting”. While the medical officers of health in the early twentieth century agreed that sting was a respiratory condition that only existed among the Inuit, they disagreed over whether it was a form of chronic tuberculosis or whether it was an epidemic disease [Citation19,p. 139–142]. Medical historians have been cautious in diagnosing sting as anything but a respiratory condition with an unclear definition [Citation20], and “sting” will be treated as a non-specific respiratory condition for this study too. Because some parish registers did not contain causes of death, we decided to use all-cause mortality data in our primary analysis of excess mortality, and cause-specific mortality information is used as supporting information.
We transcribed aggregate population statistics from 1901 and 1911 censuses. Although the 1921 census is closest to the pandemic period, the population size may have been affected by the pandemic itself. Therefore, we used the population by parish as well as the total age distribution of Greenland from the censuses of October 1911 and 1901 and assumed these were representative for the pandemic periods of 1918–21 and 1889–92, respectively.
Statistical methods
We aggregated all daily burial counts into monthly counts at the parish level and for all of Greenland. We constructed a monthly mortality baseline by taking the average of the same calendar month in the preceding and following five years not including the month of interest. The tail ends of the time series were included. We assume that the baseline monthly number of burials follows a Poisson distribution. To adjust the baseline for the effect of any unusual peak in mortality, we used an iterative process where we removed any significant outliers. These were defined as months when the burial count exceeded the 99% quantile of the estimated Poisson distribution. After removal, a new baseline was determined from the remaining data. We repeated this process until no monthly count exceeded this cut-off. To account for the impact of the low number of deaths in some periods, any outlier month also had to have at least three deaths to be considered an outlier for removal. This number was based on investigating the time series and picking a cut-off that seemed to identify outliers best.
The number of excess deaths was computed as the difference between the baseline mortality and the observed number of deaths. We calculated 95% confidence intervals as the difference between the observed deaths and the 2.5% and 97.5% quantiles of the baseline Poisson distribution. Similarly, confidence intervals for annual excess mortality were determined by the Poisson distribution with mean of the sum of the monthly baselines. Furthermore, we also estimated the excess mortality only during periods, with deaths exceeding the 99% quantile of the monthly Poisson distributions. This estimate gives a more precise indication of excess mortality during short periods of time. We used this method to investigated major mortality crises during the entire study period. We defined a mortality crisis as a period of one or more months where the monthly recorded deaths exceeded the 99% quantile the baseline Poisson distribution and at least 10 deaths were reported during that period.
To investigate the age patterns of mortality, we used the same baseline generation process for time-series data stratified by age groups: <1, 1–9, 10–20, 20–40, 40–60, and 60 + . To have sufficient counts at a high enough level of detail, we did the age analysis only for all parishes combined. To visualise the age-patterns, the excess mortality ratio was calculated as the observed mortality for a specific age-group divided by that age-groups estimated baseline mortality. Records with missing age were excluded from this analysis; for the 1889–92 pandemic period, 3.9% had missing information on age (47 of 1201 burial records), while for the 1919–21 influenza pandemic period this figure was 4.7% (75 out of 1604).
Results
Diffusion of the 1919–21 pandemic in Greenland
The pandemic hit the west coast of Greenland in the spring and summer of 1919 (). In May 1919, it arrived in Paamiut, after which it diffused northwards along the other Midwestern parishes and into the Disco Bay in June and July 1919. It reached the northwestern parishes of Upernavik and Uummannaq and the parishes on the south cape in August 1919. The pandemic was documented by the chief medical officer of the Egedesminde (Aasiaat) medical district. According to him, the first influenza cases appeared after a post ship had visited the Aasiaat trade station on 11 July 1919. The locals who had come to greet the ship were infected and carried the virus back to their settlements, which caused an explosive epidemic with morbidity rates close to 100% [Citation6]. In some regions, the pandemic continued well into 1921. shows the time series of monthly all-cause burials from 1916–21. Complete time series from 1880 to 1921 for Greenland and each parish are presented in Supplementary Figures S1–4. Ammassalik, the only parish on the east coast of Greenland, experienced excess mortality in August 1918, which coincided with the first wave of the 1918 pandemic in Europe [Citation12]. There were, however, only 12 deaths during this period, of which 7 were diagnosed with pneumonia, and the low number of deaths makes it unclear whether these deaths were due to the pandemic or any other respiratory condition [Citation6].
Figure 1. Geographical and temporal pattern of the first wave of the pandemic in Greenland in 1919. Colors indicate the presumed arrival of the pandemic in each parish. Size of the circles indicates the relative total excess mortality (see also ).
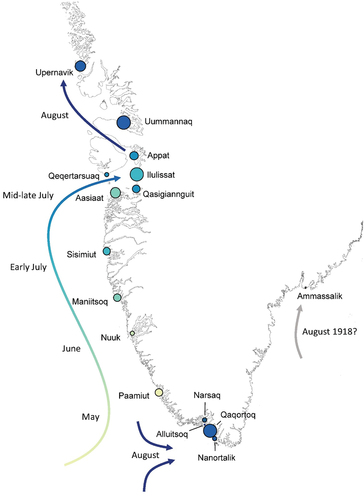
Figure 2. Time series of monthly burials in the parishes of Greenland 1916–1921. Vertical lines indicate the month July in each year. Red areas indicate the estimated excess mortality with the dark-red areas indicating the excess above the 0.99 quantile of Poisson distributions.
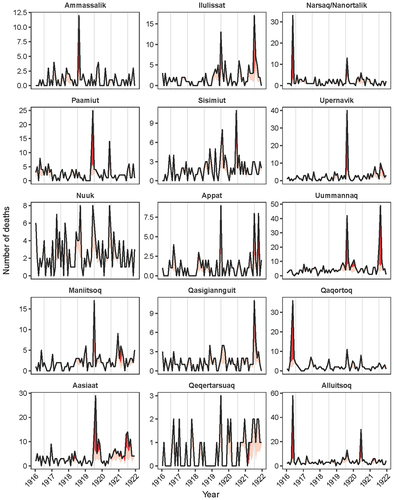
Table 1. Excess all-cause mortality estimates by parish for the pandemic period in Greenland (1919–1921).
Excess mortality
shows the excess all-cause mortality estimates by parish for the pandemic period 1919–21. In total, 1.604 burials were recorded in these three years. The total excess mortality during this period was estimated at 697 (95% CI: 637–756), corresponding to 43% of all deaths, or approximately 5.2% of the Greenland population. There were, however, large differences in mortality between the parishes. Nuuk, Ammassalik, Qaqortoq, Narsaq & Nanortalik, and Qeqertarsuaq experienced the lowest excess mortality, with under 2.5% of the population dying. The highest excess mortality was on the other hand found in Uummannaq and Ilulissat where over 10% of the population died. There were also differences in the timing in which parishes experiences mortality burden. Generally, excess mortality was highest in 1919 and 1921, except for the parishes in the Cape region, Alluitsoq and Narsaq & Nanortalik, and two parishes in the mid-west region, Nuuk and Sisimiut, where excess mortality was highest in 1920.
Age-patterns
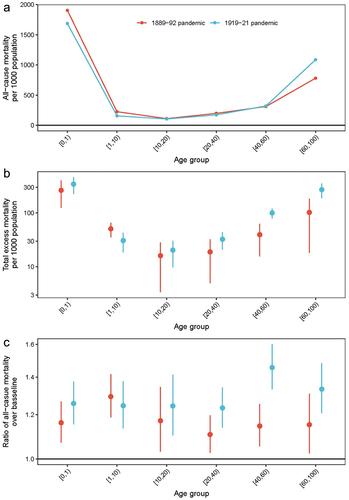
shows the age-distribution of all-cause deaths as well as excess mortality, for both the 1889–92 and 1919–21 pandemic periods (see Supplementary Figure 5 for age-specific time series). The overall age mortality pattern during the 1919–21 pandemic showed a U-shape, characteristic of seasonal influenza, with high infant and elderly mortality. All age groups experienced excess mortality with an overall 1.1 to 1.5-fold increase in mortality over baseline. There were no clear patterns in the age group findings, although those aged 40–60 had the highest excess mortality ratio of 1.5 (95% CI: 1.3–1.6). This corresponded to 204 (95% CI 163–246) excess deaths or 10.0% (95% CI: 8.0%-12.0%) in this age group. Using five-year age-bands indicated tentative evidence that the 25–30-year-old age group – corresponding to children born during the 1889–92 pandemic – had a slightly higher excess mortality than surrounding age-groups, though total deaths in this age-group were relatively small and confidence intervals were broad (Supplementary Figure S6).
Figure 3. Age-patterns of the 1889–92 and 1919–21 pandemics. (a) overall all-cause mortality per 1000 population; (b) excess mortality per 1000 population; (c) ratio of all-cause observed mortality and baseline. Vertical lines indicate 95% confidence intervals.
Comparison with the 1889–92 pandemic
The first wave of the 1889–92 pandemic reached Greenland in 1889. During the pandemic period 1889–92, fewer excess deaths occurred relative to the 1919–21 pandemic: 422 (95% CI: 366–476) deaths or 3.5% of the total population, see also Supplementary Table S1. Like the 1919–21 pandemic, large regional differences existed with the highest excess mortality found in Upernavik (13.9%, 95% CI: 11.9%-15.7%), and the lowest in Ilulissat, 0.5% (95% CI: −2.0%-2.8%). The overall age mortality pattern was similar to the 1919–21 pandemic – U-shaped – although the excess mortality was considerably higher among 40–60-year-olds during the 1919–21 pandemic than the 1889–92 pandemic (). Comparing the two pandemics on the parish level, there was no consistent pattern in whether a parish experienced high, low or the same excess mortality during both pandemics (Supplementary Table S1). For example, Qaqortoq experienced a lethal wave in 1892 and was not considerably affected during 1919–21 pandemic, while Ilulissat was spared in 1889–92 but experienced a high excess mortality in 1919 and 1921, and Upernavik, Appat and Paamiut were relatively hard hit during both pandemics.
Other mortality crises
In addition to the two pandemics, other respiratory epidemics with similar or higher levels of excess mortality took place during the study period. A list of periods of excess mortality is given in Supplementary Table S2. Several of the deadliest mortality crises during the 40-year period under study were not during the pandemic years. In 1916, a severe respiratory outbreak recorded as influenza in the parish registers occurred in Alluitsoq and Qaqortoq (and several other parishes), causing, respectively, 55 (95% CI: 52–58) and 50 (95% CI: 46–54) excess deaths. Outbreaks of whooping cough in 1891, 1912 and 1913 also caused a high mortality burden – the 1891 whooping cough epidemic is included in the excess mortality toll estimated for the pandemic period 1889–92 resulting in a possible overestimation. In 1881, Aasiaat, Qasigiannguit, Uummannaq and Ilulissat experienced a respiratory epidemic, which at the time was recorded as influenza. In Ilulissat, this epidemic led to 19 excess deaths increase in all-cause mortality (95% CI: 16–21) on-par with the pandemic wave in July 1921 (16, 95% CI: 14–17). In 1897, the north-western parishes experienced another respiratory epidemic recorded as influenza with an excess mortality of 47 (95% CI: 44–50) in Uummannaq, and in 1916, the cape region experienced a severe influenza epidemic with 32 (95% CI: 29–33) excess deaths in Narsaq & Nanortalik, mainly among the elderly.
Discussion
Timing and seasonality
The lack of connectivity between Greenland and Denmark explains why the pandemic first reached Greenland in the summer of 1919. In the account from Aasiaat, the chief medical officer explains that he expected its arrival in his district when the first post ship reached the Aasiaat trade station, but that it came with the second post ship on 11 July 1919 [Citation6]. The summer arrival is consistent with a pre-existing pattern of respiratory epidemics nearly always taking place during the summer due to ship arrivals bringing respiratory pathogens [Citation21]. The ship logs from the ship that arrived in Aasiaat show that it had departed from Copenhagen on 13 June 1919, and visited Nuuk, Sisimiut, Appat and Qeqertarsuaq before visiting Aasiaat as its last stop [Citation22,p. 31–51]. While the ship’s northward route is consistent with the observed temporal patterns, its visits to parishes north of Aasiaat before Aasiaat is puzzling. In total, there were five ships from Denmark sailing along the west coast of Greenland in the summer of 1919, and some parishes that did experience the pandemic were never visited by these ships. It was, and still is, common for Greenlanders to travel during the summer period to visit family living elsewhere. The pandemic could therefore have been introduced into communities that Danish ships did not visit.
The pattern of pathogens being introduced via ships is not unique for Greenland either. While the influenza pandemic reached communities in Alaska during the fall of 1918, other major epidemics have reached Inuit communities during the summers for the very same reason as the case of Greenland in 1919; frozen and dangerous waters prohibited travel and thereby contact with other regions of the world [Citation4].
Epidemic versus pandemics
We found that many other respiratory epidemics occurred, such as those in 1881, 1911 and 1916, that were equally deadly and, in some cases, more so than the 1889–92 and 1919–21 pandemics. Chief medical officers noted at the time that the so-called “cold epidemics” that occurred when traffic with Europe resumed after the winter, were highly variable in mortality [Citation21]. This pattern is common for Arctic regions in general. In 1900 for example, Alaska experienced a severe influenza epidemic [Citation23]. The reasons for this are not yet clear, but it has been suggested that geographical isolation and low population density may have played a role in this high variability [Citation3]. Several findings show that morbidity rates during epidemics were close to 100%, in which case entire populations were potentially immunised against certain pathogens [Citation3,Citation6]. The erratic introduction of new influenza strains and lack of immunity, especially among young children, thereby may explain high mortality rates.
Excess mortality
Overall, we found that the total excess mortality during the 1919–21 pandemic in Greenland was 5.2% of the population with large geographical differences, with some parishes experiencing over 10% mortality. An explanation for this geographical variation is still unclear. The 5.2% mortality rate was high compared to non-Indigenous populations in Europe and North America and is higher than the prior 2% estimate from Aasiaat in Greenland from 1920 [Citation6]. Compared to Inuit populations on both sides of the North American continents, it was, however, relatively low.
We also found that the characteristic age-pattern of high young-adult mortality during the 1918–20 pandemic was not evident in Greenland, except for a slight increase in the 30–40-year-olds in 1921. Rather, the mortality pattern resembled that typically seen with seasonal influenza epidemics. It also slightly resembles the age-pattern seen in Labrador and Alaska during the pandemic. [Citation3,Citation11,Citation24] (p. 5–11) Previous research has suggested that exposure to the earlier pandemic of 1889–92 might explain the high young-adult mortality – indeed the peak in age-specific mortality in other regions coincides with the birth cohorts born around the 1889–92 pandemic [Citation7,Citation25]. It is currently hypothesised that individuals, through repeated boosting with cross-reactive antibodies, have a stronger immunological recall of the first influenza virus they have encountered in life [Citation8,Citation26,Citation27]. When encountering a new influenza strain, this imprint may result in a mismatched immune-response, causing either a rampant immunological response, rampant infection, or perhaps a broader-scale immunological effect that increases susceptibility to other infections [Citation28]. The exact biological mechanism is likely a complex interplay of various parts of the immune system, and still mostly unclear [Citation29]. This phenomenon may explain the high mortality among young-adults during the 1918–20 pandemic, and one would expect that regions hard-hit during the 1889–92 pandemic would also have high young-adult mortality during the 1919–21 pandemic. We did not find clear evidence of such as link in Greenland, though there is tentative evidence that the 25–30-year-olds born during the 1889–92 pandemic period showed a slightly higher excess mortality. We do not have a clear reason for the regional differences or lack of extreme mortality in young adults. The age groups born before 1889 may have been less exposed to influenza due to the remote conditions, which meant that there was less pre-existing immunity among the elderly in 1919. This could explain the extreme mortality in all age groups and not just the young adults. It is, however, worth noting that the sex-ratios in mortality in Greenland at the time of the pandemic were skewed due to high male mortality mainly from kayaking accidents [Citation11,Citation24,p. 5–11]. The relatively high baseline mortality among young adults may have masked the expected peak in excess mortality in this age-group during the 1919–21 pandemic and any subsequent links to the 1889–92 pandemic.
Why Greenland experienced lower mortality than the Inuit populations in North America is unclear. Around 97% of Greenland’s population was Inuit [Citation16] and had similar diets to the Inuit of Alaska. During the 1919–21 pandemic in Greenland, no non-pharmaceutical interventions were instigated. On the contrary, the chief medical officer in Aasiaat described how the trade station lay empty at the height of the pandemic, as the inhabitants were all ill [Citation6]. The absence of basic care has, however, also been documented in Alaska and Labrador [Citation3]. More connectivity to Europe is one possibility. While some Inuit and Native-American settlements in North America had very little contact with the outside world [Citation4], the settlements in Greenland experienced contact with Europe through Denmark and Norway every spring and summer, causing the recurring before-mentioned “cold epidemics” [Citation21]. The contact was not new either; in the seventeenth and eighteenth centuries, Greenland was visited by Dutch whalers, who also interacted with the Inuit, and from the colonisation in 1721, the Inuit populations came into permanent contact with Europeans. Colonial attitudes towards the different Inuit populations may also have contributed to differences in excess mortality. The colonial policies in North America were aimed at turning the Indigenous populations into skilled workers [Citation30,p. 34–36], and scholars have since argued that this had adverse consequences for their health [Citation3,Citation31]. The colonial administration in Greenland was from the mid-nineteenth century, however concerned that the frequent contact with Europe would lead to an eradication of the Inuit culture, including the loss of seal hunting, and consequently adapted a “preservation” strategy. This meant that the Inuit in Greenland was prohibited from western food products and seal hunting remained their main vocation into the twentieth century [Citation30,p. 36–38]. This may have resulted in differences in background risk-factors, such as contact-patterns, general health, and nutritional status between Greenland Inuit populations and Inuit populations on both sides of the North American continent, potentially contributing to the differences in excess mortality.
Another possibility is genetics. Studies of the Inuit in Greenland have shown that they share 25% genes with Europeans today [Citation32,Citation33]. A higher genetic relation to Europeans may also help explain some of the differences between areas within Greenland, as well as the pandemic impact being more like that seen in other Nordic Arctic populations and different from other Arctic populations that may have been less mixed genetically.
Limitations
Our data and analyses have several limitations. First, the total number of deaths during pandemics is relatively low, precluding detailed regional age-stratified analyses. The parishes in Greenland were, as mentioned in the introduction, large, for which reason even more fine-grained local differences documented in studies of Alaska and Labrador have not been possible to document [Citation4]. It has not been possible for us to obtain qualitative accounts documenting the 1919–21 pandemic in Greenland other than the account from Aasiaat medical district. For this reason, our study has relied almost exclusively on the information provided by parish registers. Finally, the causes of death provided in the parish registers should be interpreted with caution [Citation15–17] for which reason we only using this as supplementary information. This limited the use of causes-of-death data and thus we cannot be sure that the excess mortality we estimated can be attributed to the pandemics.
Conclusion
We studied excess mortality in Greenland using burial records from parish registers in the four decades leading up to the 1919–21 pandemic. The pandemic arrived in Greenland by ship with a delay of one year, in the early summer of 1919 and diffused to all parts of western Greenland during that summer. All age groups were considerably affected by the pandemic and no particularly increased mortality was seen for young adults, which contrasts the European experience. Mortality was high (around 5%) albeit not higher than several other mortality crises and considerably lower than the devastation reported from Inuit populations in North America. The pandemic exhibited a significantly different epidemiological pattern in Greenland compared to other Arctic locations as well as Europe and North America. This leaves the question of how this pattern arose and whether it is possible that Greenland’s diverging historical experience with pandemic influenza and other respiratory pathogens may be the cause of these differences, or if other cultural and social factors play a stronger role in the susceptibility of Arctic populations to respiratory diseases. Investigations into the grey literature on infections and possibly respiratory mortality in the years before the 1889–92 pandemic may shed some light on these open questions.
Supplementary material anonymous.docx
Download MS Word (1.9 MB)Acknowledgments
We sincerely thank Lisa Sattenspiel for her valuable comments during the drafting of this manuscript. We are also grateful to the Nordemics Consortium for useful discussions.
Disclosure statement
No potential conflict of interest was reported by the authors.
Data availability statement
The data that support the findings of this study are available from the corresponding author, Mathias Mølbak Ingholt, upon reasonable request.
Supplementary material
Supplemental data for this article can be accessed online at https://doi.org/10.1080/22423982.2024.2325711
Correction Statement
This article has been republished with minor changes. These changes do not impact the academic content of the article.
Additional information
Funding
References
- Johnson NPAS, Mueller J. Updating the accounts: global mortality of the 1918–1920 “Spanish” influenza pandemic. Bull Hist Med. 2002;76(1):105–12. doi: 10.1353/bhm.2002.0022
- Murray CJ, Lopez AD, Chin B, et al. Estimation of potential global pandemic influenza mortality on the basis of vital registry data from the 1918–20 pandemic: a quantitative analysis. Lancet. 2006;368(9554):2211–2218. doi: 10.1016/S0140-6736(06)69895-4
- Mamelund SE. Geography may explain adult mortality from the 1918–20 influenza Pandemic. Epidemics. 2011;3(1):46–60. doi: 10.1016/j.epidem.2011.02.001
- Mamelund SE, Sattenspiel L, Dimka J. Influenza-associated mortality during the 1918–1919 influenza Pandemic in Alaska and Labrador: a comparison. Soc Sci Hist. 2013;37(2):177–229. doi: 10.1215/01455532-2074420
- Nygaard IH, Dahal S, Chowell G, et al. Age-specific mortality and the role of living remotely: the 1918–20 influenza pandemic in Kautokeino and Karasjok, Norway. International Journal Of Circumpolar Health. 2023;82(1). doi: 10.1080/22423982.2023.2179452
- Bichel J. Influenzaen i Egedesmindes Distrikt i Grønland. Ugeskr Laeger. 1920;82(2):1163–1167.
- van Wijhe M, Ingholt MM, Andreasen V, et al. Loose ends in the epidemiology of the 1918 pandemic: explaining the extreme mortality risk in young adults. Am J Epidemiol. 2018;187(12):2503–2510. doi: 10.1093/aje/kwy148
- Viboud C, Epstein SL. First flu is forever. Science (1979). 2016;354(6313):706–707. doi: 10.1126/science.aak9816
- Omran AR. The epidemiologic transition: a theory of the epidemiology of population change. Milbank Q. 1971;83(4):731–757. doi: 10.1111/j.1468-0009.2005.00398.x
- Hamilton LC, Rasmussen RO. Population, sex ratios and development in Greenland. Arctic. 2010;63(1):43–52.
- Marquardt O. Greenland’s demography, 1700–2000: the interplay of economic activities and religion. Etud Inuit. 2004;26(2):47–69. doi: 10.7202/007645ar
- Simonsen L, Chowell G, Andreasen V, et al. A review of the 1918 herald pandemic wave: importance for contemporary pandemic response strategies. Ann Epidemiol. 2018;28(5):281–288. doi: 10.1016/j.annepidem.2018.02.013
- Andreasen V, Viboud C, Simonsen L. Epidemiologic characterization of the 1918 influenza pandemic summer wave in Copenhagen: Implications for pandemic control strategies. J Infect Dis. 2008;197(2):270–278. doi: 10.1086/524065
- Ingholt MM, Simonsen L, van Wijhe M. Same place, different stories: the mortality burden of the 1918–1920 influenza pandemic in Denmark. Invest Hist Econ. 2020;16(4):49–67. doi: 10.33231/j.ihe.2020.10.005
- Mamelund SE. A socially neutral disease? Individual social class, household wealth and mortality from Spanish influenza in two socially contrasting parishes in Kristiania 1918–19. Soc Sci Med. 2006;62(4):923–940. doi: 10.1016/j.socscimed.2005.06.051
- Folketællingen i Grønland Den 1. Oktober 1911; 1913.
- Greenland National Museum & Archives. Parish registers. Published online 2023. https://en.nka.gl/the-archive/using-the-archive/family-history-research/online-church-ledgers/
- Christensen IL, Rud S. Arctic Neurasthenia - the case of Greenlandic Kayak fear 1864–1940. Soc History Medi. 2013;26(3):489–509. doi: 10.1093/shm/hkt008
- Meldorf G. Epidemiske Sygdomme i Grønland: Influenza og epidemiske katarrhalske affektioner af luftvejs-Slimhinderne. Meddelelser Om Grønland. 1907;33:129–304.
- Kristiansen P. Tuberkulosebekæmpelsen i Grønland - Udvikling Og Følger i Det Offentliges Tuberkuloseforanstaltninger i Vestgrønland 1900–1961. Nuuk: Ilisimatusarfik; 2004.
- Bertelsen A. Erfaringer om Luftvejskatarrers Optræden i Grønland. Ugeskr Laeger. 1912;31:1107–1114.
- Hansen HFV Ship log of S/S Hans Egede. Published online 1919.
- Wolfe RJ. Alaska’s great sickness, 1900: an epidemic of measles and influenza in a virgin soil population. Proceedings of the American Philosophical Society. 1982;126(2).
- Bertelsen A. Om Dødeligheden i Grønland og om nogle af Dødsaarsagerne Sammensteds. Copenhagen: J.D. Qvist & comp; 1919.
- Viboud C, Eisenstein J, Reid AH, et al. Age- and sex-specific mortality associated with the 1918–1919 influenza pandemic in Kentucky. J Infect Dis. 2013;207(5):721–729. doi: 10.1093/infdis/jis745
- Gostic KM, Ambrose M, Worobey M, et al. Potent protection against H5N1 and H7N9 influenza via childhood hemagglutinin imprinting. Science. 2016;354(6313):722–726. doi: 10.1126/science.aag1322
- Gostic KM, Bridge R, Brady S, et al. Childhood immune imprinting to influenza a shapes birth year-specific risk during seasonal H1N1 and H3N2 epidemics. PLoS Pathogens. 2019;15(12):e1008109. doi: 10.1371/journal.ppat.1008109
- Gagnon A, Miller MS, Hallman SA, et al. Age-specific mortality during the 1918 influenza pandemic: unravelling the mystery of high young adult mortality. PLoS One. 2013;8(8):e69586. doi: 10.1371/journal.pone.0069586
- Oidtman RJ, Arevalo P, Bi Q, et al. Influenza immune escape under heterogeneous host immune histories. Trends Microbiol. 2021;29(12):1072–1082. doi: 10.1016/j.tim.2021.05.009
- Rud S. Colonialism in Greenland - tradition. Governance And Legacy. 2017. Available from: http://www.springer.com/series/13937
- deValpine MG. Influenza in Bristol Bay, 1919: “the saddest repudiation of a benevolent intention”. Sage Open. 2015;5(1). doi: 10.1177/2158244015577418
- Moltke I, Fumagalli M, Korneliussen TS, et al. Uncovering the genetic history of the present-day greenlandic population. Am J Hum Genet. 2015;96(1):54–69. doi: 10.1016/j.ajhg.2014.11.012
- Waples RK, Hauptmann AL, Seiding I, et al. The genetic history of greenlandic-european contact. Curr Biol. 2021;31(10):2214–2219.e4. doi: 10.1016/j.cub.2021.02.041