
ABSTRACT
This study proposes the use of a level set incorporated with an improved Markov random field (MRF) model in unsupervised change detection for satellite images. MRF provides a means of modelling the spatial contextual information in the level set, and an edge indicator function is introduced into the MRF model to control the contribution of local information in the boundary areas to change detection. On the basis of the improved MRF model, local label relationships and edge information are considered in the level set energy functional to conduct a novel local term and attract the contours into desired objects. By merging the novel energy term, the proposed approach not only reduces noise but also obtains accurate outlines of the changed regions. Experimental results obtained with Landsat 7 Enhanced Thematic Mapper Plus and SPOT 5 data sets confirm the superiority of the proposed model when compared with state-of-the-art change detection methods.
Introduction
Change detection is the process of identifying changes in multitemporal satellite images that are acquired over the same geographical area at different points in time (Hussain, Chen, Cheng, Wei, & Stanley, Citation2013; Lu, Mausel, Brondízio, & Moran, Citation2004). Over the past few years, various change detection methods for different applications have been proposed. These methods can be divided into two kinds, namely, supervised methods and unsupervised methods (Bruzzone & Prieto, Citation2000). Unsupervised methods perform change detection by conducting a direct comparison of two multitemporal images without incorporating any additional information (Celik, Citation2009). The present study focuses on unsupervised change detection for multitemporal satellite images. Unsupervised change detection techniques are mainly developed on the basis of the so-called “difference images”, which are generated using image differencing, image rationing, principal component analysis, or change vector analysis (CVA) (Lu et al., Citation2004). A few automatic analysis methods for identifying changes in difference images have been applied to unsupervised change detection; these methods include fuzzy c-means (Ghosh, Mishra, & Ghosh, Citation2011), Markov random field (MRF) (Wang et al., Citation2013), particle swarm optimization (Kusetogullari, Yavariabdi, & Celik, Citation2015) and support vector machine (Bovolo, Bruzzone, & Marconcini, Citation2008).
In recent years, the active contour model (ACM) based on level set methods has gained popularity in the field of change detection for satellite images because it can achieve robust image segmentation and naturally handle topological changes (Bazi, Melgani, & Al-Sharari, Citation2010; Li, Gong, & Liu, Citation2015). The level set method was first introduced into the ACM by Osher and Sethian (Citation1988) to represent a contour as the zero level set of a function, and the level set function evolved according to a partial differential equation. Chan and Vese (Citation2001) improved this model as the Chan–Vese (CV) model based on the Mumford–Shah energy functional (Mumford & Shah, Citation1989). The overall premise of the CV model is to avoid using gradient information and consequently reduce the complexity of optimization problems. On the basis of the CV model, Bazi et al. (Citation2010) proposed multiresolution level set (MLS) methods for detecting changes using multispectral satellite images. In another study, wavelet transformation was adopted to obtain a multiresolution representation of the difference image and in turn reduce the effect of noise contamination; then, the ACM was applied to the transformed images for change detection (Celik & Ma, Citation2011). Ardila, Bijker, Tolpekin, and Stein (Citation2012) introduced ACMs with a localized data fitting energy term for identifying tree-crown image regions in high resolution multitemporal images. A fuzzy ACM and genetic algorithm were used in a previous study to analyse the difference image and reduce speckle noise for change detection in synthetic aperture radar images (Shi, Wu, Paul, Jiao, & Gong, Citation2014). Hao, Shi, Zhang, and Li (Citation2014) developed an expectation–maximization (EM)-based level set method for change detection, which did not require initial contours. Li, Shi, Myint, Lu, and Wang (Citation2016) proposed a semi-automated change detection approach based on a fast level set algorithm for landslide inventory mapping. Normally, level set methods based on the CV model assume that the label of each spatial location in an image is independent of others, thereby ignoring neighbouring label relationships among image pixels during the evolutions of the level set curves. Thus, change detection results may contain much salt-and-pepper noise or lose detailed changes such as accurate outlines. Within this context, the present work proposes a level set algorithm incorporating an improved MRF model for unsupervised change detection from satellite images. In order to generate accurate change detection results, a novel local energy term considering neighbouring label relationships and edge information is introduced into the energy functional on the basis of the improved MRF model.
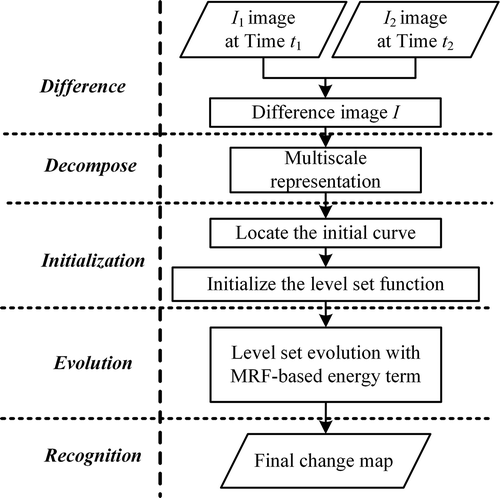
The flowchart of our algorithm is shown in . First, the CVA method is conducted on the multitemporal satellite images to generate a difference image. Second, image downsampling is performed to generate the multi-scale representation of the difference image. Next, the initial curves of the level set are located and the level set function is initialized as a signed distance function. The level curves can then evolve with the MRF-based local energy constraints in the multi-scale framework. Finally, the change map can be obtained by the improved level set algorithm.
Figure 1. Flow chart of the proposed change detection algorithm.
Proposed change detection method
Consider two coregistered multispectral satellite images, and
, acquired in the same geographical area at two different times. Both images have B bands. The difference image I is generated by the magnitude of the CVA method with the same size of M × N.
Change detection by level set
Change detection using level set methods aims to find an optimal contour C, which splits the difference image into non-overlapping regions associated with changed classes
and unchanged classes
. In the Bayesian framework, the optimal segmentation is given by the maximum a posteriori estimate, which is described as follows:
where is a label set of the difference image and n is the pixel number.
is a prior probability distribution of the class labels of the difference image and
is the probability density function of the pixel values in the difference image. In the variational framework, maximizing the posterior probability in Equation (1) is equivalent to minimizing the following energy functional (Brox & Weickert, Citation2006):
where is the level set function, such that
if
and
if
;
denotes the Heaviside step function, i.e.
if
and
if otherwise.
is a prior probability of class
(
) and
represents the probability density function, given class
(
). The parameter
is a constant that controls the trade-off between the goodness of fit and the length of the contour.
The minimization of the energy function is achieved by solving the associated Euler–Lagrange equation. The evolving equation of level set curves is given by
where denotes the Dirac function. The CV model assumes that the image is a piecewise constant function (Chan & Vese, Citation2001). If the prior probabilities
and
of both regions are considered equal, the associated evolving equation can be obtained as follows:
where and
are the intensity averages of image I inside and outside the contour C, respectively.
Level set incorporating MRF
In this study, the Markov prior information was incorporated into CV model to reduce spurious noisy regions. MRF is an effective approach to exploit the spatial contextual information within a Bayesian framework (Bruzzone & Prieto, Citation2000; Szeliski et al., Citation2008). Using the conditional distribution of pixel labels based on the Markov property, the prior probability distribution of class labels can be expressed as
where denotes the local neighborhood of the pixel x (
),
is the Gibbs energy function and
is a normalizing factor. In the MRF model, if the boundary pixels are not properly controlled, the result will reveal over-smooth boundaries and lose significant details (Tso & Olsen, Citation2005). Thus, in this study, the edge information is used to control the contribution of the spatial information in the boundary areas to change detection. In addition, the Potts model is utilized to model each of the conditional distributions of pixel labels in MRF. Then,
is given as follows:
where is a constant that controls the influence of the spatial contextual information in the MRF model.
Represents an edge indicator function, and
if the pixel x is recognized as an edge; otherwise, it is equal to 0. The function V is given by Equation (7):
By merging the prior probability distributions of the two class labels expressed as Equation (5), the evolving formulation of Equation (3) can be written as follows:
Then, the final evolving formulation can be expressed as follows:
where the term is the global data fitting term derived from the CV model and the term
refers to the proposed MRF-based local penalty term.
is set to
, which is calculated adaptively according to the intensity averages of image I inside and outside the contour during the evolution of level curves. When the value of
is very small, which means the intensity averages of the changed and unchanged class are close to each other, the global term will dominate to attract the contours to the objects rapidly. As the value of
increases, the local term will tend to control the neighbouring label relationships and generate an accurate change detection result.
Implementation
Multi-scale analysis was performed to reduce the search space and avoid being trapped into a local minimum (Bazi et al., Citation2010). The multi-scale images were generated by downsampling the difference image. The proposed model was then applied to the images with a coarse-to-fine evolving strategy. The main steps of the proposed level set algorithm are summarized as follows:
Decompose the difference image into K scales.
Let
and initialize the level set function
Evolve the level set function
Upsample the result of scale k to initialize the level set of scale k − 1.
Repeat Steps (3) and (4) until reaching the image scale of 0, i.e.
Return the final change detection result.
Experimental results and discussion
To assess the performance of the proposed model for change detection, two satellite image data sets were tested in the experiments. Three standard error measures were used to evaluate the results (Yetgin, Citation2012): (1) missed alarm rate (Pm): the number of changed pixels in the changed detection map that were incorrectly classified as unchanged pixels over the total number of changed pixels in the ground reference map; (2) false alarm rate (Pf): the number of unchanged pixels in the changed detection map that were incorrectly classified as changed pixels over the total number of unchanged pixels in the ground reference map; and (3) total error rate (Pt): the total number of detection errors caused by either missed or false detections over the total number of pixels.
In the experiments, the initial curves of the level set were small circles that evenly covered the entire difference image. The optimal Canny edge detector (Canny, Citation1986) was used in the proposed model to extract the edge information. We compare the proposed model with the MLS method, CV model, undecimated discrete wavelet transform and active contour (UDWTAC) approach (Celik & Ma, Citation2011), MRF model (Bruzzone & Prieto, Citation2000) and EM-based threshold method to prove the effectiveness of the proposed model.
Experiment on data set 1
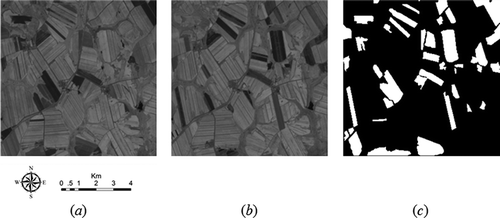
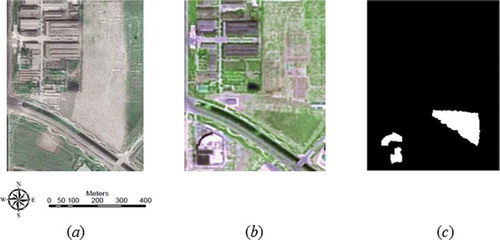
The first data set consisted of two satellite images acquired by the Landsat 7 Enhanced Thematic Mapper Plus (ETM+) in August 2001 and August 2002 over the Liaoning Province of China. Both images were coregistered, and the histogram matching method was implemented for the relative radiometric correction. shows band 4 of the 2001 and 2002 images, respectively. The ground reference map was created manually on the basis of the analysis of multitemporal input images. This map is shown in ).
Figure 2. Band 4 of data set 1 (the centre coordinate: 48°3ʹ N, 126°8ʹ E) acquired by Landsat 7 ETM+ sensor in (a) August 2001 and (b) August 2002, (c) ground reference map.
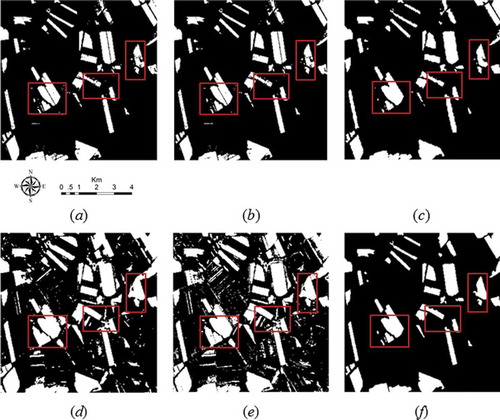
shows the change detection results generated by the MLS, CV, UDWTAC, MRF, EM and the proposed model. In the proposed model, we set the parameter of the level set , the time step ∆t = 0.1 and
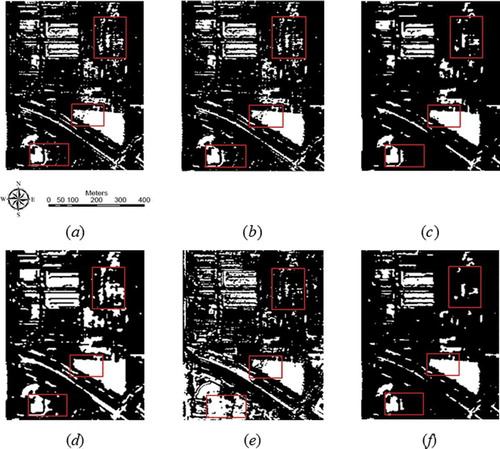
= 3.2. In addition, the β value of the MRF method is set to 0.8, and the CV model, MLS and UDWTAC are implemented with the same parameters of μ = 0.4 and ∆t = 0.1. The visual comparison between the different changed results confirms that the proposed model yields the closest change map to the ground reference. As marked by the rectangles in , the noise is reduced, and accurate outlines of the changed regions are detected in the proposed model. shows that the results of the other level set methods contain significant noise and lost certain detailed change information. Although the MRF and EM yield homogenous regions more effectively than the other level set methods, the former generates over-smooth results on the boundary areas, and the latter produces much “salt-and-pepper” noise, as shown in , respectively.
Figure 3. Change detection results of data set 1 obtained by (a) MLS, (b) CV, (c) UDWTAC, (d) MRF, (e) EM and (f) the proposed model.
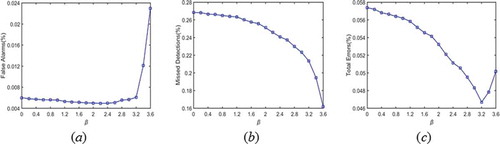
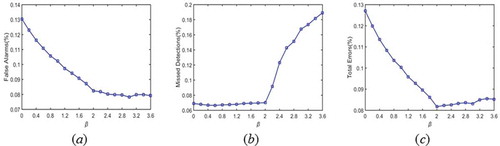
presents the variations in the missed detection rates, false alarm rates and total error rates when different β values are used in the proposed model. The change maps are generated using β values ranging from 0 to 3.6 with a step of 0.2. As the β value increases, the miss detection rates continuously decrease, while the false alarm rates first slightly drop and then increase. As a result, the total error rates decline and reach the minimum at the β value of 3.2. The change detection result with contains more error pixels than the result with the β value larger than 0, which reveals that the MRF-based local energy can improve the accuracy of change detection.
Figure 4. Variations in (a) false alarm rates, (b) missed detection rates and (c) total error rates of the proposed model when different change maps were generated by β values ranging from 0 to 3.6 with a step of 0.2 for data set 1.
To quantify the effectiveness of the proposed model, we compare the computations of Pm, Pf and Pt based on the change maps and the reference map, as depicted in . The values of Pm, Pf and Pt obtained by the proposed model are 21.23%, 0.58% and 4.62%, respectively. Thus, the proposed model can obtain more accurate change detection results than the other methods in this experiment.
Table 1. Quantitative change detection results in experiment 1.
Experiment on data set 2
The second data set represented two 2.5 m spatial resolution images acquired by the SPOT 5 satellite over the Wuqing district in Tianjin, China, in 2008 (t1, shown in )) and 2009 (t2, shown in )). The t1 image was registered to the t2 image, and the histogram matching method was used in the relative radiometric correction. ) displays the ground reference map that was collected manually by comparing the multitemporal images.
Figure 5. Data set 2 (the centre coordinate: 39°6ʹ N, 117°5ʹ W) acquired by SPOT5 on (a) April 2008 and (b) February 2009, (c) ground reference map.
In the proposed model, we set the parameter of the level set , the time step ∆t = 0.1 and β = 2. The MLS, CV and UDWTAC are also implemented to generate change detection maps with the same parameters
= 0.4 and ∆t = 0.1. Furthermore, the
value of the MRF method is set to 0.8 for change detection. All change maps are displayed in . From a qualitative point of view, the change map provided by the proposed model appears to be closer to the ground reference, compared with change detection maps. The rectangles in show that MLS, CV and UDWTAC yield several false alarms and generate certain noise in large change blocks. By contrast, the proposed model reduces the false alarms and retains detailed changes in the homogenous regions, as shown in ).
Figure 6. Change detection results of data set 2 obtained by (a) MLS, (b) CV, (c) UDWTAC, (d) MRF, (e) EM and (f) the proposed model.
The variations in the three indices (i.e. missed detection rate, false alarm rate and total error rate) with different β values in the proposed model are displayed in . Different change maps produced by β values ranging from 0 to 3.6 with a step of 0.2 are used to analyse the effects of different β values on change detection results. The false alarm rates decrease with an increase in the β value, while the miss detection rates first remain nearly constant and then increase. The total error rates decline and reach the minimum when the change map is generated by the β value of 2. As shown in ), the change detection method generates the largest number of error pixels when the β value equals 0, which proves the effectiveness of the local energy term.
Figure 7. Variations in (a) false alarm rates, (b) missed detection rates and (c) total errors rates of the proposed model when different change maps were generated by β values ranging from 0 to 3.6 with a step of 0.2 for data set 2.
illustrates the quantitative error measures obtained by all the change detection methods used in this research. For the proposed model, the Pm, Pf and Pt values calculated by comparing the generated change map with the ground reference map are equal to 6.97%, 8.24% and 8.17%, respectively. The proposed model generates the most accurate change detection result among all the methods in the experiment.
Table 2. Quantitative change detection results in experiment 2.
Discussion
Since the proposed level set model incorporates MRF-based local information to fully describe the mutual relationships of pixel labels in the spatial neighbourhood system, the noise in the change detection map can be reduced. In addition, an edge indicator function is used to avoid the excessive use of local information in the detailed areas and the proposed model can consequently retain accurate outlines of the changed regions. The experimental results confirm that the accuracy of the change detection result is adequately improved by the proposed model.
The penalty coefficient β in MRF controls the influence of the local term in the level set evolution functional. For the change detection result with the elimination of the local penalty term in the level set evolution, namely, , there exist more error pixels than the result with a larger β value. This indicates that the MRF-based local energy term can guide the level curve evolution correctly and improve the accuracy of change detection.
Conclusion
This study develops a novel change detection approach for satellite images using a level set method incorporated with an improved MRF model. Both local information considering neighbouring label relationships and edge information are introduced into the level set energy functional to conduct a local penalty term. Due to the introduction of the novel MRF-based term, the proposed model can reduce noise and while preserving the outlines in boundary areas. The experiments conducted on the multitemporal Landsat 7 ETM+ and SPOT 5 data sets confirm the superiority of the proposed approach in generating accurate change detection results when quantitatively and qualitatively compared with state-of-the-art change detection methods. Apart from spatial contextual information, other information, such as texture information and morphology characteristics, can be used in this method to improve the accuracy of change detection in future work.
Acknowledgements
The work presented in this paper was supported by the National Natural Science Foundation of China (41331175). The authors would like to thank the editors and reviewers whose suggestions have significantly improved this paper.
Disclosure statement
No potential conflict of interest was reported by the authors.
Additional information
Funding
References
- Ardila, J.P., Bijker, W., Tolpekin, V.A., & Stein, A. (2012). Multitemporal change detection of urban trees using localized region-based active contours in VHR images. Remote Sensing of Environment, 124, 413–210. doi:10.1016/j.rse.2012.05.027
- Bazi, Y., Melgani, F., & Al-Sharari, H.D. (2010). Unsupervised change detection in multispectral remotely sensed imagery with level set methods. IEEE Transactions on Geoscience and Remote Sensing, 48, 3178–3187. doi:10.1109/TGRS.2010.2045506
- Bovolo, F., Bruzzone, L., & Marconcini, M. (2008). A novel approach to unsupervised change detection based on a semisupervised SVM and a similarity measure. IEEE Transactions on Geoscience and Remote Sensing, 46, 2070–2082. doi:10.1109/TGRS.2008.916643
- Brox, T., & Weickert, J. (2006). Level set segmentation with multiple regions. IEEE Transactions on Image Processing, 15, 3213–3218. doi:10.1109/TIP.2006.877481
- Bruzzone, L., & Prieto, D.F. (2000). Automatic analysis of the difference image for unsupervised change detection. IEEE Transactions on Geoscience and Remote Sensing, 38, 1171–1182. doi:10.1109/36.843009
- Canny, J. (1986). A computational approach to edge detection. IEEE Transactions on Pattern Analysis and Machine Intelligence, 679–698. doi:10.1109/TPAMI.1986.4767851
- Celik, T. (2009). Unsupervised change detection in satellite images using principal component analysis and k-means clustering. IEEE Geoscience and Remote Sensing Letters, 6, 772–776. doi:10.1109/LGRS.2009.2025059
- Celik, T., & Ma, -K.-K. (2011). Multitemporal image change detection using undecimated discrete wavelet transform and active contours. IEEE Transactions on Geoscience and Remote Sensing, 49, 706–716. doi:10.1109/TGRS.2010.2066979
- Chan, T.F., & Vese, L.A. (2001). Active contours without edges. IEEE Transactions on Image Processing, 10, 266–277. doi:10.1109/83.902291
- Ghosh, A., Mishra, N.S., & Ghosh, S. (2011). Fuzzy clustering algorithms for unsupervised change detection in remote sensing images. Information Sciences, 181, 699–715. doi:10.1016/j.ins.2010.10.016
- Hao, M., Shi, W., Zhang, H., & Li, C. (2014). Unsupervised change detection with expectation-maximization-based level set. IEEE Geoscience and Remote Sensing Letters, 11, 210–214. doi:10.1109/LGRS.2013.2252879
- Hussain, M., Chen, D., Cheng, A., Wei, H., & Stanley, D. (2013). Change detection from remotely sensed images: From pixel-based to object-based approaches. ISPRS Journal of Photogrammetry and Remote Sensing, 80, 91–106. doi:10.1016/j.isprsjprs.2013.03.006
- Kusetogullari, H., Yavariabdi, A., & Celik, T. (2015). Unsupervised change detection in multitemporal multispectral satellite images using parallel particle swarm optimization. IEEE Journal of Selected Topics in Applied Earth Observations and Remote Sensing, 8, 2151–2164. doi:10.1109/JSTARS.2015.2427274
- Li, H., Gong, M., & Liu, J. (2015). A local statistical fuzzy active contour model for change detection. IEEE Geoscience and Remote Sensing Letters, 12, 582–586. doi:10.1109/LGRS.2014.2352264
- Li, Z., Shi, W., Myint, S.W., Lu, P., & Wang, Q. (2016). Semi-automated landslide inventory mapping from bitemporal aerial photographs using change detection and level set method. Remote Sensing of Environment, 175, 215–230. doi:10.1016/j.rse.2016.01.003
- Lu, D., Mausel, P., Brondízio, E., & Moran, E. (2004). Change detection techniques. International Journal of Remote Sensing, 25, 2365–2401. doi:10.1080/0143116031000139863
- Mumford, D., & Shah, J. (1989). Optimal approximations by piecewise smooth functions and associated variational problems. Communications on Pure and Applied Mathematics, 42, 577–685. doi:10.1002/(ISSN)1097-0312
- Osher, S., & Sethian, J.A. (1988). Fronts propagating with curvature-dependent speed: Algorithms based on Hamilton-Jacobi formulations. Journal of Computational Physics, 79, 12–49. doi:10.1016/0021-9991(88)90002-2
- Shi, J., Wu, J., Paul, A., Jiao, L., & Gong, M. (2014). Change detection in synthetic aperture radar images based on fuzzy active contour models and genetic algorithms. Mathematical Problems in Engineering, 2014,15.
- Szeliski, R., Zabih, R., Scharstein, D., Veksler, O., Kolmogorov, V., Agarwala, A., … Rother, C. (2008). A comparative study of energy minimization methods for Markov random fields with smoothness-based priors. IEEE Transactions on Pattern Analysis and Machine Intelligence, 30, 1068–1080. doi:10.1109/TPAMI.2007.70844
- Tso, B., & Olsen, R.C. (2005). A contextual classification scheme based on MRF model with improved parameter estimation and multiscale fuzzy line process. Remote Sensing of Environment, 97, 127–136. doi:10.1016/j.rse.2005.04.021
- Wang, F., Wu, Y., Zhang, Q., Zhang, P., Li, M., & Lu, Y. (2013). Unsupervised change detection on SAR images using triplet Markov field model. IEEE Geoscience and Remote Sensing Letters, 10, 697–701. doi:10.1109/LGRS.2012.2219494
- Yetgin, Z. (2012). Unsupervised change detection of satellite images using local gradual descent. IEEE Transactions on Geoscience and Remote Sensing, 50, 1919–1929. doi:10.1109/TGRS.2011.2168230