
ABSTRACT
Global soil moisture products retrieved from various remote sensing sensors are becoming readily available with a nearly daily temporal resolution. With lack of ground observations in Pakistan, microwave sensors are viable technologies for retrieving soil moisture from space. Thus, this study compares soil moisture data from Soil Moisture and Ocean Salinity (SMOS) with Advanced Microwave Scanning Radiometer (AMSR-E) for 2010 and 2011, which were years where massive flooding occurred. We find suitable correlations (r = 0.47) for Level-2 soil moisture values for both satellites and report temporal variability during the pre-monsoon, monsoon, post-monsoon and winter seasons. This study motivates using satellite retrievals as a start towards more comprehensive studies in Pakistan.
Introduction
Soil moisture is considered as a key observable in many fields including meteorology, hydrology and agronomy. Its spatial dimensions and temporal variations are dependent on many factors, for example, soil texture and composition, topography as well as dynamic factors like rainfall and flora, so on. (Korres et al., Citation2015). Natural processes like erosion, flooding, runoff, drought, evaporation and infiltration all are directly or indirectly driven by soil moisture. Hence, spatio-temporal monitoring and measurement of surface soil moisture is getting more attention in the agricultural, meteorological and environmental communities. It is a conventional fact that conditions of terrestrial surface have an effect on the tropospheric environment, land temperatures and on precipitation rates, and soil moisture plays a vital role in connecting all these processes (Soerensson & Berbery, Citation2015). Soil and water bond plays major role in soil physics, thus all kinds of processes regarding soil ecology whether physical, chemical or biological are linked with quality and quantity of water present (Brevik et al., Citation2015). Food shortage, drought and desertification all have drastic social and economic effects, and study of soil moisture as drought predictive variable can be helpful to avoid these destructive phenomena. As it is a key variable in water cycle, we can extract knowledge of received rainfall and loss of water due to evapotranspiration as latter is considered as linkage between water and energy budget and is sensitive to soil moisture, helping in forecasting weather and climatic conditions (Soerensson & Berbery, Citation2015). Soil moisture is also a key factor in agriculture, as it is technically in charge of crop selection, sowing and tillage practices and choice of irrigation system, so on. (Vereecken et al., Citation2014). Soil moisture content (SMC), being a highly variable factor, is influenced by a whole list of factors, that is, land topography, physical and chemical soil characteristics, flora diversity, precipitation, solar radiations, wind speed and direction, humidity level and many other climatic variables (Hébrard, Voltz, Andrieux, & Moussa, Citation2006). Among all the factors effecting SMC, rainfall is the most important variable, and we can say that not only soil moisture but surface overflow, underground flow all depend on precipitation (Sivapalan, Beven, & Wood, Citation1987).
Traditionally, soil surveys and hydrological modelling have been a source to get better understanding of the role soil moisture plays in hydrology, biochemistry and other ecosystems. These methods to measure soil moisture include sampling which is further analysed in laboratory. Conventional methods to record soil moisture include gravimetric method, nuclear methods, electromagnetic and tensiometer techniques. Among these, some are destructive while others are non-destructive methods and are considered accurate and used for ground truthing, but all are applicable for limited spatial coverage and thus it is the main limitation of conventional methods. However, among all the conventional strategies used for measuring SMC, no single method can be considered universal to apply in all kinds of circumstances (Verstraeten, Veroustraete, & Feyen, Citation2008).
On a global scale, sophisticated remotely sensing radiometers are one class of sensors which are used to observe SMC. Different approaches are followed to assess SMC from space using the electromagnetic spectrum, that is, optical, thermal infrared, microwave, and global positioning systems using reflected signals are used for this purpose (Larson et al., Citation2008). Instruments are continuously evolving with new missions being launched, as their techniques have a certain edge over conventional apporaches. What makes remote sening as one of the most efficient method to assess SMC is the fact that it can cover large area frequently (time interval ranges from bi-daily to monthly). A large difference in dielectric property between water and dry soil is the key logic behind estimation of soil moisture in microwave (MW) region. Water has dielectric constant value of 80 as compared to dry soil which has value near 4. Thus this large dielectric constant difference between dry and wet conditions significantly affects thermal emissions from surface of earth and helps in surface soil moisture retrieval.
Point studies give insights to variability of soil moisture below the ground surface, which is something that cannot be ignored, but the level of soil moistures also varies in space. A majority of the models designed by taking into account point data only failed to map the spatial variability in terms of volumetric water content. However, microwave technology can quantify soil moisture under different topographic conditions at regional level (Dobriyal, Qureshi, Badola, & Hussain, Citation2012).
With the dearth of ground observations in Pakistan, space-borne active and passive microwave sensors are alternative resources for retrieving soil moisture. Therefore, a major objective of this study is to compare and analyse the soil moisture data gathered from the Soil Moisture and Ocean Salinity (SMOS) satellite with another satellite sensor aboard the Aqua satellite, namely the Advanced Microwave Scanning Radiometer (AMSR-E). Many validation and inter-comparison studies for AMSR-E and SMOS SMC are available in the literature. In a study over agronomy crops and forest area in Canada for the period of May to September 2010, it was found that both SMOS and AMSR-E were underestimated when compared with ground measurements. Moreover, for agronomy sites AMSR-E algorithm was less effected by rainfall events as compare to SMOS algorithm (Gherboudj et al., Citation2012). In another study over crop growing areas in Vidarbha, India, validation between AMSR-E and SMOS with in situ data was taken place for only monsoon period of 2011–2013. Correlation coefficient 0.32 for AMSR-E and 0.50 for latter was attained when each was compared with ground measurements (Rao et al., Citation2016). Comparison study between SMOS and AMSR-E over the Mongolia plateau where study period was from May to September 2010 was taken place in which they first define a smoothness index for spatial variations. Standard deviation computed shows greater values for SMOS as compared to AMSR-E. Moreover, other statistical measures such as the mean and maximum value of SSI (smoothness index) also show much higher values. From the Microwave Imaging Radiometer using Aperture Synthesis (MIRAS) sensor, the mean SSI for SMOS was found to be 1.284 as compared to a much lower value of 0.010 for AMSR-E (Wen, Lu, & Li, Citation2015). In another paper, evaluation of three microwave satellite soil moisture products advanced scatterometer (ASCAT), AMSR-E and SMOS was taken place over Murrumbidgee Basin, southeast Australia. They found out that AMSR-E products show promising results for overall seasonal changes as compared to other satellites, whereas SMOS shows comparatively minor variations and greater within-season variance (Su, Ryu, Young, Western, & Wagner, Citation2013). While in a study comparing SMOS, AMSR-E and ASCAT, they found SMOS product showing promising results for precise estimation of SMC for the period of January 2010–September 2011 (Lacava et al., Citation2012). Study on global scale evaluation of these two passive satellites AMSR-E and SMOS has proven that both products are in good agreement over areas having no or low vegetation, but those for floral regions SMOS shows consistent and more reliable results as compare to AMSR-E (Al-Yaari et al., Citation2014). For global error computation of SMOS, a study employed triple colocation technique. When compared with other sensors, namely, AMSR-E and ASCAT, it was found that SMOS shows very good results over North America, North Africa, Middle East, Central Asia and Australia. (Leroux, Kerr, Richaume, & Fieuzal, Citation2013). Most of these regions are radio frequency interference (RFI) free which raise the possibility of better results for SMOS in these regions. In another study, evaluation of Dispatch (Disaggregation based on Physical and Theoretical scale Change) for validation purpose of SMOS and AMSR-E was conducted. The study covered Murrumbidgee catchment in southeast Australia for 1-year period (2010–2011). Both sensors were compared along with in situ data. Consistent results were obtained in the semi-arid regions as compared to temperate zone part of the catchment (Malbéteau, Merlin, Molero, Rüdiger, & Bacon, Citation2015).
A main property which distinguishes passive microwave sensors from active sensors is they are designed to use natural radiations from earth surface in microwave spectrum instead of using an active source of illumination. Unresponsive behaviour of microwave radiometry to atmospheric hazards gives them edge over other optical remote sensing. Nevertheless, this also draws attention for its usage in wireless and satellite telecommuting sector. Thus, these synthetic signals cause saturation of naturally emitted radiation from surface and are termed as Radio Frequency Interference (RFI). It is worth mentioning here that both sensors used in this study may be affected by RFI but processing includes filtration (Li, Njoku, Im, Chang, & Germain, Citation2004a; Misra et al., Citation2009).
Materials and methods
Study area
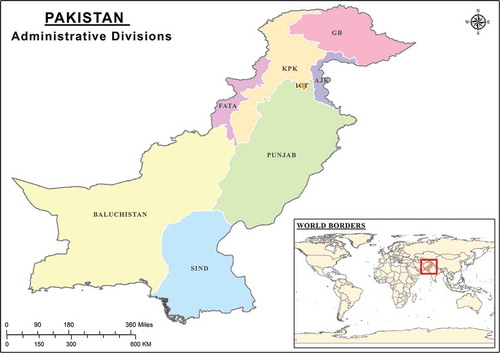
Pakistan covers area of 796,096 km2 in south Asia. It has been gifted with variety of terrain ranging from shoreline of Arabian Sea to deserts of Thar and Baluchistan, plains of Sind and Punjab to world’s highest chains of mountains of Karakoram, Himalaya and Hindu Kush. More than half of the area is considered arid or semi-arid which receives less than 250 mm annual rainfall. Precipitation is unevenly distributed throughout the year as the maximum quantity is recorded during the monsoon period(Zahid & Rasul, Citation2013). shows administrative divisions of Pakistan.
Figure 1. Study area.
Data products
This study covers the comparison of two passive microwave sensors data sets AMSR-E (AQUA) and MIRAS (SMOS) soil moisture products. Overview of general characteristics of both sensors is provided in . Besides, land cover map from European Space Agency (ESA) global project, precipitation data are used as further supporting data for our findings.
Table 1. AMSR-E and SMOS characteristics.
Supplementary data sets
Along with satellite-based soil moisture products, additional data sets have been used in this inter-comparison study analysis. Ground-based precipitation data collected at the Pakistan Meteorological Department (PMD) on a daily basis were used. These observations are certified and registered with the World Meteorological Organizations (WMO). Hence data gathered from all the stations registered with WMO were used for area-averaged precipitation analysis. Moreover, for detailed land cover information of study area land cover map from ESA GlobCover 2009 project is included, which is freely available on the web. The global land cover map shows 22 land cover classes which are standardized with Land Cover Classification System of United Nations (UN).
AMSR-E
Aqua is a multi-national satellite operated by the National Aeronautics and Space Administration (NASA) which has been functional from May 2002. On board are many sensors, among which AMSR-E is of relevance for soil moisture. It stopped working in October 2011, due to some technical problems in antenna. The host satellite is sun synchronous with a swath width of 1445 km (Rebel et al., Citation2012) .The AMSR-E approach is basically to link observed brightness temperature to geophysical observables. Microwave emissions are expressed in terms of brightness temperature in both vertical and horizontal polarization. This sensor was probably the first one to consider surface soil moisture as focal product for monitoring which acquires data in six different wavelength bands in MW ranging from 6.9 to 89.0 GHz with ascending orbit 13:30 and descending orbit at 1:30 local time (Al-Yaari et al., Citation2014; Njoku, Jackson, Lakshmi, Chan, & Nghiem, Citation2003). In this study, we have used standard product AMSR-E NASA, Level-2B land surface product (10.7 GHz) having mean spatial resolution of 38 km which is resampled to 25 km grid projection. Soil moisture product used in the study covers the globe in 2 days or less excluding glaciers or highly dense vegetative sites. Among the six frequencies of AMSR-E, C and X bands have high tendency for soil moisture estimation, but earlier studies revealed that RFI contaminates soil moisture retrieval from C band (Laymon et al., Citation2005; Li, Njoku, Im, Chang, & Germain, Citation2004b; Liu et al., Citation2011). Thus, X band was preferred over C band for this study. AMSR-E detects SMC present in top ~1-cm soil layer (Anderson et al., Citation2012; Draper et al., Citation2007; Leroux, Kerr, Richaume et al., Citation2013; Njoku & Chan, Citation2006)
SMOS
The second product used in this study is soil moisture retrieval by SMOS. This satellite is part of ESA’s living planet programme and was launched into space in November 2009, propelled at polar sun-synchronous orbit with 6:00 ascending and 18:00 descending local time at 750 km attitude and swath width of 1000 km. It is the first ever satellite which is purely devoted to record SMC (Pinori, Crapolicchio, & Mecklenburg, Citation2008). On board is MIRAS instrument, which is a dual polarized interferometer. It works in the L-band (1.41 GHz) and has a main edge over other sensors (Kerr et al., Citation2001). This is because other passive sensors working at higher MW frequencies (or optical sensors or active Microwave sensors) are mainly susceptible to cloud cover, dense foliage cover or surface topography. Contrary to all of them, there is least noise contribution in terms of atmospheric water content as clouds have relatively insignificant effect on L-band. SMOS covers the globe with revisit time of 2–3 days that includes both ascending and descending orbits with spatial resolution in range between 30–50 and 40 km on average for the used product and retrieves SMC with accuracy of 0.04 m3/m3 (Zhao et al., Citation2014). It records soil moisture present in top 5-cm layer of soil approximately (Albergel et al., Citation2012). In this study, SMOS MIRAS level-2 soil moisture product (MIR_SMUDP2) data filtered from RFI contamination is used, which measures volumetric SMC. It is important to mention here that RFI influences SMOS signals in different zones around the globe (Albergel et al., Citation2012; Dall ’Amico, Schlenz, Loew, & Mauser, Citation2012; Leroux, Kerr, Richaume et al., Citation2013; Parrens et al., Citation2012).
Methodology
The study was carried out over data sets spanning the time period between March 2010 and September 2011. This duration indicates the time when data of both sensors were available, that is, after testing SMOS and before AMSR-E stopped working. According to existing literature, collecting in situ measurements regarding soil moisture from ground-based sensors is one of the best ways for providing strength to validation procedures (Brocca, Melone, Moramarco, Wagner, & Hasenauer, Citation2010). As such, the best combination is not only ground validation but also inter-comparison of satellite sensors (Brocca et al., Citation2011). However, we cannot conduct such comprehensive studies for Pakistan due to lack of ground-based sensors making it difficult to validate satellite data. Another viable option is to compare remotely sensed data. Hence, we conduct inter-comparison between two sensors using collocation as a method of linking recorded measurements from relatively distinct platforms or instruments. Basically, this involves pairing measurements from different platforms that cover the same or nearby positions on earth. An issue here is that different satellites used for measurements may have different spatial resolutions. To avoid this issue, a vital strategy was to extract those points where both the sensors (SMOS and AMSR-E in our case) intersect each other (Pierdicca, Pulvirenti, Fascetti, Crapolicchio, & Talone, Citation2013). AMSR-E was considered as a master and SMOS as slave after which soil moisture estimated points were retrieved by standardizing AMSR-E (Nagle & Holz, Citation2009). Inverse navigation approach that is technically opposite to forward navigation approach is used in the study. The key to this approach is finding the nearby time first instead of location when the slave is in position of covering point or location of master sensor. Using time domain data, soil moisture measurements were extracted. To minimize the temporal difference between AMSR-E and SMOS, data having closest time difference are selected. Time difference of recorded soil moisture retrievals lies under 7 h between both sensors. Only descending orbit of AMSR-E was selected. Passive sensor observations recorded at night are considered more reliable as compare to daytime. Soil moisture and temperature profiles are much more uniform at night rather than in the daytime. Soil vegetation temperature differences are also lesser at night. Hence, the measurements taken at night or early morning are supposed to have lesser modelling error. After comparing all the data points of SMOS with AMSR-E, 10 closest points of SMOS to each AMSR-E point were selected. For accuracy, each and every possible row of slave data was reviewed to compare them with master data to extract all possible points having closest time collection period. This was done using nearest neighbour approach (Nagle & Holz, Citation2009; Pan et al., Citation2015; Wang, Tremblay, Zhang, & Han, Citation2016). It is a non-parametric or distribution-independent technique (Cunningham & Delany, Citation2007) and therefore acts as a substitute for other parametric regression methods, which require many prior assumptions regarding variables (Fehrmann, Lehtonen, Kleinn, & Tomppo, Citation2008). When it comes to large sampling data set, k-nearest neighbour approach (KNN) is relatively unbiased (Magnussen, Tomppo, & McRoberts, Citation2010). However, it is time-consuming, which is why the KNN algorithm is less efficient due to of large run times (Cunningham & Delany, Citation2007). An in-depth screening was done towards identifying the paired points having minimum time difference. Next, colocation was done on a spatial basis to accommodate sets of points in within specified threshold criteria, that is, points that were nearest to each other (maximum 12.5 km far apart) were selected from the entire set as AMSR-E Level2b data are already resampled to 25-km grid cell spacing. For each grid point of AMSR-E, the closest SMOS point within the threshold zone of 12.5 km was searched. The collocated retrievals, containing AMSR-E and SMOS paired data, were then used to compare SMC in Pakistan.
Results and discussions
From March 2010 to September 2011, we have compared passive sensor data of AMSR-E and SMOS, which includes only descending passes of Master sensor covering Pakistan. As no calibrated ground data is available for comparing it with remotely sensed data, validation is not possible. We map the maximum and minimum values of soil moisture estimated from both satellites ( and ). It is important to mention here that these maps include all available data of 2010 and 2011 of SMOS L2 product covering Pakistan. To evade possible outliers, that is, unreasonably high or low values of soil moisture, we have not considered the last percentile for estimating the maximum value and first percentile for the minimum value computation for both sensors.
Figure 2. Maps of maximum and minimum of AMSR-E SMC (expressed in m3/m3) for the period 2010–2011 of Pakistan.
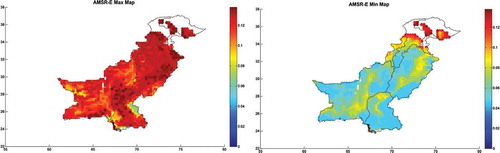
Figure 3. Maps of maximum and minimum SMOS SMC (expressed in m3/m3) for the period 2010–2011 of Pakistan.
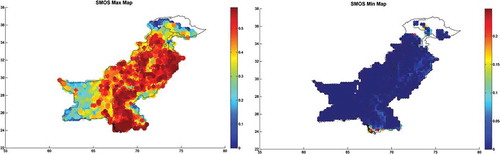
The maximum SMC maps of both sensors show relatively higher values, as this is clearly observed in southern Punjab, some parts of central Punjab and Sind (see and ). Moderately high values have been observed in Khyber Pakhtunkhwa (KPK). Lower values of soil moisture are noticeably detected in Baluchistan and in desert areas of Sind (Tharparkar) and Punjab (Bahawalpur). However, the minimum SMC maps are quite even in features. When compared with AMSR-E, it is observed in maps that beside absolute values overall trend explicates the same idea.
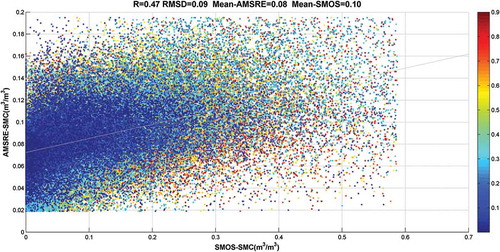
illustrates the inter-comparison results of collocated SMC of AMSR-E and SMOS in scatterplot form. Different colours in figure display the point density in scatterplot. summarizes the statistics of the yearly data of 2010 and 2011, respectively, that is, R, correlation coefficient, and RMSD, root mean square difference. Overall, fairly acceptable correlation value (0.47) and RMSD (0.09) have been found (Gherboudj et al., Citation2012). For 2010 (March–December), correlation coefficient value of 0.49 has been observed although RMSD exceeds 0.05. Mean value computed is 0.08 for AMSR-E and 0.10 for SMOS. For 2011 (January–September) R-value of 0.44 and RMSD of 0.10 have been observed. Mean values for AMSR-E and SMOS are 0.08 and 0.11, respectively. To observe the difference of daytime and night-time retrievals of both sensors and their influence on the results of comparison both passes were also treated through the same process to recover collocated points from both ascending and descending orbits of AMSR-E and SMOS. Slight changes in R and RMSD values were found. These are fairly generalized outcomes, as the data is considered as a whole without any discrimination of different geographical regions and seasonal variations in Pakistan.
Table 2. SMOS versus collocated AMSR-E SMC for 2010 (March–December) and 2011 (January–September).
Figure 4. AMSR-E vs. collocated SMOS from March 2010–September 2011.
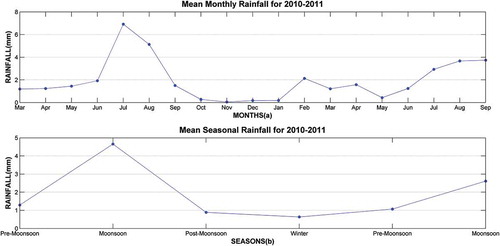
Pakistan is divided into four main climatic zones based on rainfall pattern, which are pre-monsoon, monsoon, post-monsoon and winter season. More than 60% of rainfall received in the monsoon months, and the study period, that is, 2010–2011 were years when massive flooding occurred. It is to be noted then that seasonal variations and wet periods are likely to impact the results of SMC comparison. With this in the background, shows the R and RMSD values of monthly data. In winter months (November, December, January and February) shows best results that are high R value and low RMSD value as compared to others (Leroux, Kerr, Al Bitar, et al., Citation2014). However, monsoon and post-monsoon periods show poor results as RMSD values are very high in both years. Overall trend analysis of seasons also proves that winter season have lowest RMSD and high R values. High values of RMSD in rainy months of monsoon and post-monsoon may also suggest that SMOS overestimates SMC during the periods of heavy precipitation, as abnormal wet spells in July and August of 2010 were observed which was declared as a “super flood” in 2010 and its spread was from July to September. According to the PMD, rain showers recorded in these months were above than average rainfall over the last 80 years and monsoon 2010 can be termed as heavy wet monsoon season. Similarly, the monsoon season of 2011 also received heavy precipitation as compared to previous years, which may be the cause of a high R and RMSD values in July, August and September of 2011, as similar results have been found in earlier studies. In the absence of in situ data, precipitation maps of same day or previous day can be helpful to analyse results as rainfall and soil moisture can be spatially related and rainfall strongly affects soil moisture estimates (Al-Yaari et al., Citation2014). shows area-averaged graphs of precipitation in both monthly and seasonal terms which support this statement. As ) clearly shows high rainfall observed in monsoon months (June, July, August) of 2010.
Figure 5. Monthly and seasonal values of R and RMSD between SMOS and AMSR-E collocated SMC.
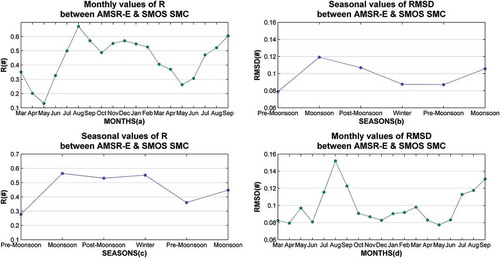
Figure 6. Mean monthly and seasonal rainfall for March 2010–September 2011.
Besides the impact of abrupt seasonal variation (heavy precipitation) during study period, geographical region and their characteristics like vegetation cover, soil texture and topography, so on, also influence soil moisture recordings in terms of passive microwave radiometry.
Overall, the years 2010–2011 were intensive monsoon period followed by destructive floods. Soil moisture estimates from SMOS in monsoon months were generally higher as compare to AMSR-E, and it was assumed that precipitation is the probable reason of this overestimation as mentioned also in many earlier studies that SMOS is much more sensitive to rainfall events (Gherboudj et al., Citation2012; González-Zamora et al., Citation2015; Jackson et al., Citation2012; Leroux, Kerr, Al Bitar et al., Citation2014).
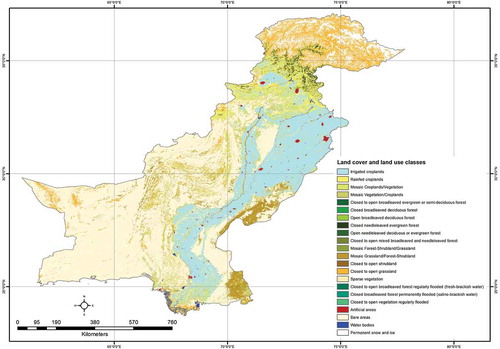
The time-averaged spatial plot of R indicates high correlation in major provinces which have been depicted by , which reveals that both products are in good agreement with each other. Strong correlation values are depicted in southern regions, especially the dry areas of Baluchistan province, which is semi-arid; hence SMC variation is limited thus performances of both sensors are coherent. A small zone of the northern region areas in the KPK province shows smaller correlation value where thick vegetation cover may have influence on overall soil moisture computation. Both these statements are coherent with which demonstrates a detailed land use land cover (LULC) map of Pakistan. Sparse vegetative area of Baluchistan and thick foliage cover in northern region are clearly depicted in LULC map.
Figure 7. Correlation coefficient (R) map between AMSR-E and SMOS soil moisture retrievals.
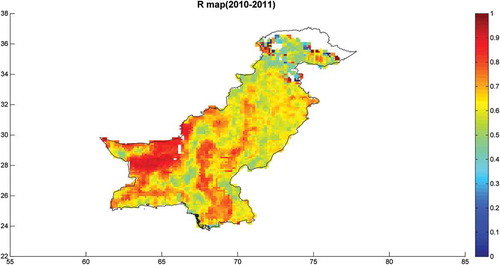
Figure 8. Land use land cover map of Pakistan.
Conclusions
In summary, soil moisture observations from sensors SMOS and AMSR-E show good agreement and depict the same overall trend; however, the absolute values of SMOS were higher in rainy seasons as compare to AMSR-E observations across Pakistan region. Among all seasons, correlation values in winter and pre-monsoon season were satisfactory. Overall R and RMSD values from March 2010–September 2011 were 0.47 and 0.09, respectively. The correlation coefficient values show better results on a monthly period as compared to yearly or seasonal comparison, that is, in months particularly dry months of both years. While lack of ground observations is a drawback of this study, results of temporal comparison of collocated data points can be considered in accordance with earlier studies and observations considering climatic anomalies during study period (including heavy rain shower and flood).
A basic objective of comparing remotely sensed data of particular SMC was to highlight the importance of this key variable and to encourage further studies in this area in the future. The outcomes on the whole can form a basis for further inter-comparison studies of these products for the Pakistan region.
Acknowledgements
We are grateful for ESA and NASA for the provision of satellite soil moisture observations and ESA GlobCover 2009 project. We thank Dr. Hammad Gilani for guidance on the land cover map from the ESA GlobCover 2009 project. Ms. Roha Anam is grateful for IST for partial funding for this work.
Disclosure statement
No potential conflict of interest was reported by the authors.
References
- Albergel, C., de Rosnay, P., Gruhier, C., Muñoz-Sabater, J., Hasenauer, S., Isaksen, L., & Wagner, W. (2012). Evaluation of remotely sensed and modelled soil moisture products using global ground-based in situ observations. Remote Sensing of Environment, 118, 215–451. doi:10.1016/j.rse.2011.11.017
- Al-Yaari, A., Wigneron, J.P., Ducharne, A., Kerr, Y., de Rosnay, P., de Jeu, R., … Mialon, A. (2014). Global-scale evaluation of two satellite-based passive microwave soil moisture datasets (SMOS and AMSR-E) with respect to land data assimilation system estimates. Remote Sensing of Environment, 149, 181–195. doi:10.1016/j.rse.2014.04.006
- Anderson, W.B., Zaitchik, B.F., Hain, C.R., Anderson, M.C., Yilmaz, M.T., Mecikalski, J., & Schultz, L. (2012). Towards an integrated soil moisture drought monitor for East Africa. Hydrol Earth Systems Sciences, 16, 2893–2913. doi:10.5194/hess-16-2893-2012
- Brevik, E.C., Cerdà, A., Mataix-Solera, J., Pereg, L., Quinton, J.N., Six, J., & Van Oost, K. (2015). The interdisciplinary nature of SOIL. 1, 117–129. doi:10.5194/soil-1-117-2015
- Brocca, L., Hasenauer, S., Lacava, T., Melone, F., Moramarco, T., Wagner, W., … Bittelli, M. (2011). Remote sensing of environment soil moisture estimation through ASCAT and AMSR-E sensors: An intercomparison and validation study across Europe. Remote Sensing of Environment, 115(12), 3390–3408. doi:10.1016/j.rse.2011.08.003
- Brocca, L., Melone, F., Moramarco, T., Wagner, W., & Hasenauer, S. (2010). ASCAT soil wetness index validation through in situ and modeled soil moisture data in central Italy. Remote Sensing of Environment, 114(11), 2745–2755. doi:10.1016/j.rse.2010.06.009
- Cunningham, P.´., & Delany, S.J. (2007). K-nearest neighbour classifiers (Technical Report UCD-CSI-2007-4), pp. 1–17. doi:10.1016/S0031-3203(00)00099-6
- Dall ’Amico, J.T., Schlenz, F., Loew, A., & Mauser, W. (2012). First results of SMOS soil moisture validation in the upper Danube catchment. IEEE Transactions on Geoscience and Remote Sensing, 50(5). doi:10.1109/TGRS.2011.2171496
- Dobriyal, P., Qureshi, A., Badola, R., & Hussain, S.A. (2012). A review of the methods available for estimating soil moisture and its implications for water resource management. Journal of Hydrology, 458-459, 110–117. doi:10.1016/j.jhydrol.2012.06.021
- Draper, C.S., Walker, J.P., Steinle, P.J., de Jeu, R.A.M., Holmes, T.R.H., Oxley, L., & Kulasiri, D. (2007). Remotely sensed soil moisture over Australia from {AMSR-E}. Modsim 2007: International Congress on Modelling and Simulation, December, Christchurch, New Zealand. pp. 1756–1762.
- Fehrmann, L., Lehtonen, A., Kleinn, C., & Tomppo, E. (2008). Comparison of linear and mixed-effect regression models and k-nearest neighbour approach for estimation of single-tree biomass. Canadian Journal of Forest Research, 38(1), 1–9. doi:10.1139/X07-119
- Gherboudj, I., Magagi, R., Goïta, K., Berg, A.A., Toth, B., & Walker, A. (2012). Validation of SMOS data over agricultural and boreal forest areas in Canada. IEEE Transactions on Geoscience and Remote Sensing, 50(5), 1623–1635. doi:10.1109/TGRS.2012.2188532
- González-Zamora, A., Sánchez, N., Gumuzzio, A., Piles, M., Olmedo, E., & Martínez-Fernández, J. (2015). Validation of Smos L2 and L3 soil moisture products over the Duero basin at different spatial scales. ISPRS – International Archives of the Photogrammetry, Remote Sensing and Spatial Information Sciences, XL-7/W3(May), 1183–1188. doi:10.5194/isprsarchives-XL-7-W3-1183-2015
- Hébrard, O., Voltz, M., Andrieux, P., & Moussa, R. (2006). Spatio-temporal distribution of soil surface moisture in a heterogeneously farmed Mediterranean catchment. Journal of Hydrology, 329(1–2), 110–121. doi:10.1016/j.jhydrol.2006.02.012
- Jackson, T.J., Bindlish, R., Member, S., Cosh, M.H., Zhao, T., Member, S., … Leroux, D. (2012). Validation of Soil Moisture and Ocean Salinity (SMOS) soil moisture over watershed networks in the U.S. IEEE Transactions on Geoscience and Remote Sensing, 50(5), 1530–1543. doi:10.1109/TGRS.2011.2168533
- Kerr, Y.H., Waldteufel, P., Wigneron, J., Martinuzzi, J., Font, J., & Berger, M. (2001). Soil moisture retrieval from space : The Soil Moisture and Ocean Salinity (SMOS) mission. IEEE Transactions on Geoscience and Remote Sensing, 39(8), 1729–1735. doi:10.1109/36.942551
- Korres, W., Reichenau, T.G., Fiener, P., Koyama, C.N., Bogena, H.R., Cornelissen, T., … Schneider, K. (2015). Spatio-temporal soil moisture patterns – A meta-analysis using plot to catchment scale data. Journal of Hydrology, 520, 326–341. doi:10.1016/j.jhydrol.2014.11.042
- Lacava, T., Brocca, L., Faruolo, M., Matgen, P., Moramarco, T., Pergola, N., & Tramutoli, V. (2012). A multi sensor (SMOS, AMSR-E AND ASCAT) satellite-based soil moisture products inter-comparison. IEEE International Geoscience and Remote Sensing Symposium, 2012, 1135–1138.
- Larson, K.M., Small, E.E., Gutmann, E.D., Bilich, A.L., Braun, J.J., & Zavorotny, V.U. (2008). Use of GPS receivers as a soil moisture network for water cycle studies. Geophysical Research Letters, 35(L24405). doi:10.1029/2008GL036013
- Laymon, C.A., Starks, P., Jackson, T.J., Bindlish, R., Gasiewski, A.J., Stankov, B., … Starks, P. (2005). Polarimetric scanning radiometer C- and X-band microwave observations during SMEX03. ( March 2017). doi:10.1109/TGRS.2005.857625
- Leroux, D.J., Kerr, Y.H., Al Bitar, A., Bindlish, R., Member, S., Jackson, T.J., … Portet, G. (2014). Comparison between SMOS,VUA,ASCAT,and ECMWF soil moisture products over four watersheds in U.S. IEEE Transactions on Geoscience and Remote Sensing 52 (3), 1562-1571.
- Leroux, D.J., Kerr, Y.H., Richaume, P., & Fieuzal, R. (2013). Spatial distribution and possible sources of SMOS errors at the global scale. Remote Sensing of Environment, 133, 240–250. doi:10.1016/j.rse.2013.02.017
- Li, L., Njoku, E.G., Im, E., Chang, P.S., & Germain, K.S. (2004a). A preliminary survey of radio-frequency interference over the U.S. in aqua AMSR-E data. IEEE Transactions on Geoscience and Remote Sensing, 42(2), 380–390. doi:10.1109/TGRS.2003.817195
- Li, L., Njoku, E.G., Im, E., Chang, P.S., & Germain, K.S. (2004b). A preliminary survey of radio-frequency interference over the U.S. in aqua AMSR-E data. IEEE Transactions on Geoscience and Remote Sensing, 42(2), 380–390. doi:10.1109/TGRS.2003.817195
- Liu, Y.Y., Parinussa, R.M., Dorigo, W.A., De Jeu, R.A.M., Wagner, W., van Dijk, A.I.J.M., … Evans, J.P. (2011). Developing an improved soil moisture dataset by blending passive and active microwave satellite-based retrievals. Hydrology and Earth System Sciences, 15(2), 425–436. doi:10.5194/hess-15-425-2011
- Magnussen, S., Tomppo, E., & McRoberts, R.E. (2010). A model-assisted k -nearest neighbour approach to remove extrapolation bias. Scandinavian Journal of Forest Research, 25(2), 174–184. doi:10.1080/02827581003667348
- Malbéteau, Y., Merlin, O., Molero, B., Rüdiger, C., & Bacon, S. (2015, January). DisPATCh as a tool to evaluate coarse-scale remotely sensed soil moisture using localized in situ measurements: Application to SMOS and AMSR-E data in Southeastern Australia. International Journal of Applied Earth Observation and Geoinformation, 45, 221–234. doi:10.1016/j.jag.2015.10.002
- Misra, S., Mohammed, P.N., Guner, B., Ruf, C.S., Piepmeier, J.R., & Johnson, J.T. (2009). Microwave radiometer radio-frequency interference detection algorithms: A comparative study. IEEE Transactions on Geoscience and Remote Sensing, 47(11), 3742–3754. doi:10.1109/TGRS.2009.2031104
- Nagle, F.W., & Holz, R.E. (2009). Computationally efficient methods of collocating satellite, aircraft, and ground observations. Journal of Atmospheric and Oceanic Technology, 26(8), 1585–1595. doi:10.1175/2008JTECHA1189.1
- Njoku, E.G., & Chan, S.K. (2006). Vegetation and surface roughness effects on AMSR-E land observations. Remote Sensing of Environment, 100(2), 190–199. doi:10.1016/j.rse.2005.10.017
- Njoku, E.G., Jackson, T.J., Lakshmi, V., Chan, T.K., & Nghiem, S.V. (2003). Soil moisture retrieval from AMSR-E. IEEE Transactions on Geoscience and Remote Sensing, 41(2 PART 1), 215–228. doi:10.1109/TGRS.2002.808243
- Pan, M., Fisher, C.K., Chaney, N.W., Zhan, W., Crow, W.T., Aires, F., … Wood, E.F. (2015). Triple collocation: Beyond three estimates and separation of structural/non-structural errors. Remote Sensing of Environment, 171, 299–310. doi:10.1016/j.rse.2015.10.028
- Parrens, M., Zakharova, E., Lafont, S., Calvet, J.C., Kerr, Y., Wagner, W., & Wigneron, J.P. (2012). Comparing soil moisture retrievals from SMOS and ASCAT over France. Hydrology and Earth System Sciences, 16, 423–440. doi:10.5194/hess-16-423-2012
- Pierdicca, N., Pulvirenti, L., Fascetti, F., Crapolicchio, R., & Talone, M. (2013). Analysis of two years of ASCAT- and SMOS-derived soil moisture estimates over Europe and North Africa. European Journal of Remote Sensing, 46(1), 759–773. doi:10.5721/EuJRS20134645
- Pinori, S., Crapolicchio, R., & Mecklenburg, S. (2008). Preparing the ESA-SMOS (Soil Moisture and Ocean Salinity) mission – Overview of the user data products and data distribution strategy. In 2008 microwave radiometry and remote sensing of the environment - 10th specialist meeting, proceedings, MICRORAD (pp. 3–6). doi:10.1109/MICRAD.2008.4579480
- Rao, S.S., Sahadevan, D.K., Wadodkar, M.R., Nagaraju, M.S.S., Chattaraj, S., Joseph, W., & Amminedu, E. (2016). Performance of global soil moisture products in crop growing region of Central India. Journal of the Indian Society of Remote Sensing, 44, 277–285. doi:10.1007/s12524-015-0496-7
- Rebel, K.T., De Jeu, R.A.M., Ciais, P., Viovy, N., Piao, S.L., Kiely, G., & Dolman, A.J. (2012). A global analysis of soil moisture derived from satellite observations and a land surface model. Hydrol Earth Systems Sciences, 16, 833–847. doi:10.5194/hess-16-833-2012
- Sivapalan, M., Beven, K., & Wood, E.F. (1987). On hydrologic similarity. A scaled model of storm runoff production. Water Resources Research, 23(12), 2266–2278. doi:10.1029/WR023i012p02266
- Soerensson, A.A., & Berbery, E.H. (2015). A note on soil moisture memory and interactions with surface climate for different vegetation types in the La Plata Basin. Journal of Hydrometeorology, 16(2), 716–729. doi:10.1175/JHM-D-14-0102.1
- Su, C.H., Ryu, D., Young, R.I., Western, A.W., & Wagner, W. (2013). Inter-comparison of microwave satellite soil moisture retrievals over the Murrumbidgee Basin, southeast Australia. Remote Sensing of Environment, 134, 1–11. doi:10.1016/j.rse.2013.02.016
- Vereecken, H., Huisman, J.A., Pachepsky, Y., Montzka, C., van der Kruk, J., Bogena, H., … Vanderborght, J. (2014). On the spatio-temporal dynamics of soil moisture at the field scale. Journal of Hydrology, 516(July 2015), 76–96. doi:10.1016/j.jhydrol.2013.11.061
- Verstraeten, W.W., Veroustraete, F., & Feyen, J. (2008). Assessment of evapotranspiration and soil moisture content across different scales of observation. Sensors, 8(1), 70–117. doi:10.3390/s8010070
- Wang, L., Tremblay, D., Zhang, B., & Han, Y. (2016). Fast and accurate collocation of the visible infrared imaging radiometer suite measurements with cross-track infrared sounder. Remote Sensing, 8(2), 76. doi:10.3390/rs8010076
- Wen, X., Lu, H., & Li, C. (2015). An intercomparison of the spatial-temporal characteristics of SMOS and AMSR-E soil moisture products over Mongolia plateau. IEEE International Geoscience and Remote Sensing Symposium (IGARSS), 681–684.
- Zahid., M., & Rasul, G. (2013). Spatial trends of AMSR-E Soil moisture across agro-climatic zones of Pakistan 2003-2010. Pakistan Journal of Meteorology, 9(18), 23–32.
- Zhao, L., Yang, K., Qin, J., Chen, Y., Tang, W., Lu, H., & Yang, Z. (2014). Remote sensing of environment the scale-dependence of SMOS soil moisture accuracy and its improvement through land data assimilation in the central Tibetan Plateau. Remote Sensing of Environment, 152, 345–355. doi:10.1016/j.rse.2014.07.005