
ABSTRACT
The purpose of this study is to examine the use of multi-resolution object-based classification methods for the classification of Unmanned Aircraft Systems (UAS) images of wetland vegetation and to compare its performance with pixel-based classification approaches. Three types of classifiers (Support Vector Machine, Artificial Neural Network and Maximum Likelihood) were utilized to classify the object-based images, the original 8-cm UAS images and the down-sampled (30 cm) version of the image. The results of the object-based and two pixel-based classifications were evaluated and compared. Object-based classification produced higher accuracy than pixel-based classifications if the same type of classifier is used. Our results also showed that under the same classification scheme (i.e. object or pixel), the Support Vector Machine classifier performed slightly better than Artificial Neural Network, which often yielded better results than Maximum Likelihood. With an overall accuracy of 70.78%, object-based classification using Support Vector Machine showed the best performance. This study also concludes that while UAS has the potential to provide flexible and feasible solutions for wetland mapping, some issues related to image quality still need to be addressed in order to improve the classification performance.
Introduction
Remote sensing has been used regularly to identify vegetation communities and monitor land cover changes. Olmsted and Armentano (Citation1997) highlighted the need for monitoring wetland vegetation and its distribution in order to detect changes in the terrestrial–aquatic landscape transition. Wetland classification is challenging due to vegetation cover dynamics with water fluctuation creating rapid and frequent changes in the type, distribution and density of plant coverage (Belluco et al., Citation2006; Smith, Spencer, Murray, & French, Citation1998). This process is further complicated by the need for frequent data collection and high spectral and spatial resolution imagery. Coarse spatial resolution images captured by satellite or high-altitude manned airborne missions may produce lower image classification accuracy, especially in riparian and wetland areas (Maheu-Giroux & De Blois, Citation2005; Yang, Citation2007). In contrary, high spatial resolution imagery facilitates the extraction of texture features (Ge, Carruthers, Gong, & Herrera, Citation2006; Wang, Sousa, Gong, & Biging, Citation2004; Waser et al., Citation2008) that can assist the classification process. The ability to capture the images frequently is important for monitoring wetland vegetation undergoing rapid and severe seasonal variation in response to changes in water level and weather. Imagery with higher spectral resolution, such as hyperspectral imagery, can also be useful for vegetation analysis. However, acquiring images with high spatial, spectral and temporal resolution is often costly and can be logistically difficult.
The use of high spatial resolution aerial imagery captured by small (1 to 2 m wingspan) Unmanned Aircraft Systems (UAS) in natural resource management is rapidly increasing (Abd-Elrahman, Pearlstine, & Percival, Citation2005; ; Laliberte, Rango, & Herrick, Citation2007; Rango et al., Citation2006; Watts et al., Citation2008). The use of such images is motivated by their potentially high temporal and spatial resolutions, increased technological and operational feasibility and advances in image analysis techniques. Improvements in technology and algorithms are gradually enabling autonomous flying to produce high-quality georeferenced orthorectified images. The temporal and spatial resolutions of UAS imagery are controlled by the operator/user who decides the mission parameters (e.g. flying height) along with when exactly to fly; this gives a significant advantage over traditional piloted image-capturing missions.
Although hyperspectral and lidar sensors have been developed specifically for small UAS, these sensors are still relatively expensive and lack the spatial resolution of some of the off-the-shelf three-band (RGB) cameras. Using inexpensive cameras, as long as they can satisfy user needs, is favored, given the relatively high possibility for UAS crashes. To take advantage of the high spatial resolution of low-cost RGB cameras onboard most commercial UAS, analysis algorithms that build on the images’ spectral, contextual and textural information need to be developed. Increasing image spatial resolution does not necessarily increase image classification accuracy; this is probably due to the increase in intra-class spectral variability and the decrease in cross-class statistical separability (Hsieh et al., Citation2001; Yu et al., Citation2006). Traditionally, texture features extracted from high spatial resolution imagery have been used to improve classification (Ashish et al. Citation2009; Coburn & Roberts, Citation2004; Pearlstine, Portier, & Smith, Citation2005; St-Louis, Pidgeon, Radeloff, Hawbaker, & Clayton, Citation2006; Szantoi, Escobedo, Abd-Elrahman, Smith, & Pearlstine, Citation2013). Object-Based Image Analysis (OBIA) takes advantage of the multi-scale details in high spatial resolution imagery (Laliberte & Rango, Citation2009) as well as other information summarized at the object level. OBIA is well known to suit high spatial resolution UAS imagery, which has frequently been utilized in urban/urban–rural feature extraction (Aguilar, Saldaña, & Aguilar, Citation2013; Chen, Shi, Fung, Wang, & Li, Citation2007; Johnson, Citation2013; Li, Bijker, & Stein, Citation2015; Tehrany, Pradhan, & Jebur, Citation2013). Along with being applied to extract features in urban and rural landscapes, OBIA techniques helped in providing detailed classification of natural plant communities as represented in wetland areas (Cordeiro & Rossetti, Citation2015; Dronova, Gong, & Wang, Citation2011; Gao, Trettin, & Ghoshal, Citation2012; Moffett & Gorelick, Citation2013). Nevertheless, the high spatial resolution of the images taken by UAS creates a challenge, especially in natural land cover classification. Unlike pixel-based analysis, OBIA segments the image into relatively homogeneous and semantically coherent objects, based on different homogeneity criteria at different scales. In OBIA, spectral information is aggregated per object, and other features such as textural and contextual information become available for object analysis. Different classification algorithms can be applied on the objects at different scale levels, and classification rules can be developed based on the thematic meaning of the objects.
Several studies claim that object-based classification has greater potential for classifying higher-resolution imagery than pixel-based methods (Gao & Mas, Citation2008; Myint, Gober, Brazel, Grossman-Clarke, & Weng, Citation2011; Oruc, Marangoz, & Buyuksalih, Citation2004; Whiteside, Boggs, & Maier, Citation2011; Willhauck, Schneider, De Kok, & Ammer, Citation2000). Contrasting with traditional pixel-based methods utilizing the spectral information of individual image pixels, OBIA has the advantage of easily incorporating textural and thematic information, geometrical and contextual relationships and ancillary data into the classification process. While there have been some studies comparing object-based and pixel-based classification techniques, more studies are needed in wetland land cover classification using sub-decimeter UAS imagery. Previous studies suggest that visual inspection indicated that the OBIA approach incurred fewer errors in larger regions of homogeneous land cover and performed better in temporal analysis of land cover change (Dingle Robertson & King, Citation2011). Niemeyer and Canty (Citation2003) claimed that object-based classification has greater potential for detecting change; this is mainly a result of the use of higher-resolution imagery. Castillejo-González et al. (Citation2009) found that object-based method outperformed five pixel-based supervised classification algorithms (parallelepiped, minimum distance, mahalanobis distance, spectral angle mapper and Maximum Likelihood [ML] classifiers) in mapping crops and agro-environmental land cover. Far greater accuracy (83.25%) was achieved by Yan, Mas, Maathuis, Xiangmin, and Van Dijk (Citation2006) when mapping 12 land cover classes using object-based classification versus a pixel-based approach (46.48%). The object-based methodology used by Gao and Mas (Citation2008) outperformed both ML and nearest-neighborhood pixel-based methods in mapping land cover using SPOT 5 (10-m spatial resolution) imagery. However, the authors noted that after smoothing filters were applied to the imagery, the accuracy of the pixel-based methods increased.
Earlier pattern recognition efforts implemented low-level machine learning algorithms such as image thresholding, morphology and template matching. Many of these algorithms were concerned with highly contrasted features and did not involve shape, contextual and textural information. Several machine learning algorithms, such as Support Vector Machine (SVM) (Mountrakis, Im, & Ogole, Citation2011) and Artificial Neural Networks (ANN) (Benediktsson, Swain, & Ersoy, Citation1990), have been implemented using OBIA. The SVM algorithm separates the classes with a decision surface, known as optimal hyperplane, such that it maximizes the margin between the classes (Cortes & Vapnik, Citation1995; Veenman, Reinders, & Backer, Citation2002). ANN is another common machine learning framework that tries to solve a convex optimization problem.
Floating invasive plants such as water lettuce and water hyacinth are potentially detrimental to aquatic ecosystem of Florida and are infesting lakes and rivers in an alarmingly rapid rate prompting the State of Florida to pass a specific statute (Florida Statute 369.22) requiring agencies to manage these invasive plants at the species level. These plants need to be continually monitored and managed, which constitute one of the motives for this study. The primary goal of this study is to investigate whether UAS is a viable platform for mapping wetland vegetation. This study investigates the best approach among the commonly available methods to achieve the optimal results for wetland vegetation classification in a wetland area in South Florida using ultra-high-resolution UAS images as a way to detect and monitor invasive vegetation. Our study compared the performances of three types of common classifiers (SVM, ANN and ML) under two classification schemes (object based and pixel based). In the next section, a methodology of this study is provided (Methodology section), covering descriptions of the data used and the procedure. Study results are presented in the Results section. Discussion section includes a discussion of the achieved results, and finally, a concise conclusion of the study is introduced in the Conclusionsection.
Methodology
Study area and data
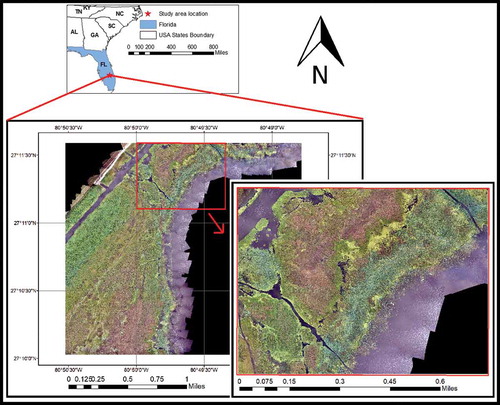
This study is conducted in the Eagle Bay wetland area located at the northern side of Lake Okeechobee covering about 4700 acres in South Florida. The Eagle Bay area contains diverse freshwater wetland communities including emergent and floating leafed species that vary in texture, patch size and mixture. The United States Army Corps of Engineers (ACE) is specifically interested in monitoring the populations of aquatic non-native invasive species such as the water hyacinth (Eichhornia crassipes) and water lettuce (Pistia stratiotes), which can cause serious ecological and navigational problems. Aerial images were acquired by a 10-megapixel true color Olympus ES 420 camera mounted on the NOVA 2.1 UAS in July of 2012. The system is developed by the University of Florida Unmanned Aircraft Systems Research Program for the US ACE, Jacksonville District. The autonomous Nova 2.1 model has a 2.7 m wingspan, weighs up to 6.4 kg and is capable of flying for up to 50 min covering 800 acre area with one single flight as well as landing on water. The NOVA 2.1 system was designed for small-sized (less than 10K acres) or medium-sized (10–20K acres) sites. Typical daily acquisition using NOVA 2.1 depends on site geometry and the difficulty in navigating the site. Four to six flights per day can be achieved, and with cooperative weather, an experienced team can collect 20K acres in one work week.
Information from the navigation sensors onboard the NOVA 2.1 UAS was used to rectify and mosaic the images using the PhotoScan Agisoft software. Image preprocessing was conducted by the ACE personnel according to their standard data collection and preprocessing procedures. In this study, we analyzed images of 8-cm ground pixel size that cover about one-fourth of a whole area and represents the plant species in the Eagle Bay area. shows the whole study area and a zoomed-in view (red box) of a part of the area. Descriptions of the training dataset used in the classification and its collection procedure are provided in the Image Classification section.
Figure 1. Eagle Bay study area.
Accuracy assessment was conducted using a randomly generated set of points. Initially, 264 points were generated randomly for the whole study area. Then, an additional 99 points were randomly generated in the area where a high diversity of vegetation classes exist, resulting in a total of 373 assessment points. These points were labeled through visual inspection of the high-resolution UAS images. The inspection conducted by biologists with intensive experience in interpreting similar images and was assisted by field verification for manual delineation of land cover classes in the area. This dataset was used to assess both OBIA and pixel-based classification results.
Image segmentation
Most pixel-based classifications tend to utilize spectral information at individual pixels and potentially textural information extracted from neighboring pixels. Pixel-based classification can highlight noise, create salt-and-pepper effects and ignore important contextual, topological and semantic information in the images (Baatz & Schäpe, Citation2000; Blaschke, Citation2010). In this study, object-based classification was utilized using the Trimble’s eCognition object-based analysis software. The eCognition software segments the images into homogeneous objects and uses information derived from each object in the classification.
The multi-scale fractal net evolution object segmentation algorithm (Baatz & Schäpe, Citation2000), implemented in the eCognition software, starts with individual pixels and applies a bottom-up merging approach based on heterogeneity measures. Neighboring objects are merged until a predetermined degree-of-fitting cost is reached. Hence, this degree-of-fitting cost, named scale parameter, is a relative threshold that determines when the segmentation growth, based on spectral and spatial similarity, needs to be stopped. Scale controls object size and leads to the multi-scale characteristic of the algorithm. Object formation is greatly influenced by the segmentation scale as different objects can be identified at different scales depending on image resolution and the properties of the objects of interest (Laliberte & Rango, Citation2009). Optimal segmentation scale is often determined empirically through visual inspection of the results (Flanders, Hall-Beyer, & Pereverzoff, Citation2003; Radoux & Defourny, Citation2007), mainly based on the size and the complexity of the target objects (Whiteside et al., Citation2011).
Our study area consists of diverse and mixed plant species including patches of different sizes that can be separated at different scales. Accordingly, the mosaicked image was segmented into multiple scale hierarchical object levels using the multi-resolution segmentation method in eCognition. We visually tested a series of segmentation scale levels including fine scales (5, 10, 15, 40, 75, 110, 150, 200 and 300) that systematically increase from fine to coarse scales. Our visual inspection revealed that fine scale segmentation using scale 15 tends to produce small objects with low relevance to their textural information. However, such fine scale segmentation results expressed the visual diversity of the objects belonging to specific classes. Coarse scale segmentation levels (e.g. 110 and larger) tend to produce large objects with multiple class mix. However, they clearly showed large patches of homogeneous classes such as large water bodies. Intermediate scale results such as scale 75 produced objects of single classes as well as mixed objects of 2 classes, while Level 40 segmentation resolved the mixed objects observed in higher-level (e.g. level 75) segmentation results. However, using Level 40, results only carried the potential of losing important textural information and increasing the classification result fragmentation. After exploring various scale levels, four scales (L15, L40, L75 and L200) were selected for the analysis. These scales are referred to in this paper as (1) L200: coarse scale, (2) L75: high scale, (3) L40: low scale and (4) L15: fine scale. The L200 coarse segmentation was chosen for broad categorization of the water and exposed soil (unpaved road) land cover from the rest of the vegetation land cover types. The L40 and L75 scales were used to classify the remaining vegetation classes of various community sizes. For example, large homogeneous water lettuce communities were detected in the high (L75) scale, while mixed communities (e.g. water lettuce and American lotus (Nelumbo lutea) were more accurately delineated in the low (L40) scale classification. The fine (L15) scale segmentation was used to provide additional information, such as the number of unique classes and the average class area, for the low (L40) scale classification.
Object features
OBIA enables the use of hundreds of spectral, textural and geometrical object features computed from the individual pixels within each object. Additionally, contextual features are also facilitated based on the topological relationship among features in the same segmentation level and across parent and child levels. The large number of often highly correlated features highlights the typical high dimensionality problem associated with this type of analysis. We used the eCognition feature optimization tool, which computed class separability for different feature and class combinations using the training dataset, to assist the feature selection process. The feature optimization results revealed the features producing the largest average minimum distance between the training samples of different classes. As part of our preliminary analysis, we implemented the SVM classifier (see Image Classification section) classification using the features identified in the feature optimization process as well as combinations of the features. The results of each test were assessed based on the confusion matrix of the accuracy assessment dataset. The best feature combination that produced highest overall accuracy and Kappa coefficient was used in the final classification.
The feature combination used in this study involves spectral, textural and hierarchical context features. The spectral features include the mean value of the red, green and blue bands and the maximum difference between mean intensities of any two bands, hue and saturation. Textural features include the angular second moment and correlation derived from the Gray Level Co-occurrence Matrix (GLCM) (Haralick, Shanmugam, & Dinstein, Citation1973). GLCM is a matrix summarizing the probability pairs of pixels with specific values happening in a given directions (this study used all directions to derive GLCM) (Developer Citation2012). Angular second moment measures local homogeneity and is calculated by summing the squares of normalized values of all cells. Correlation measures the linear dependency of gray levels of neighboring pixels (Developer, e, Citation2012). Hierarchical context features include the mean area of sub-objects at the fine scale level and the number of unique classes of sub-objects in fine object level, where fine object level in the study refers to level 15. We used the spectral features only to classify the objects at the L15 segmentation level. Then we were able to use the classification results of this level to provide the contextual information used in the higher segmentation level (L40) classification. The use of spatial (textural) features did not improve the classification results of the L15 segmentation level, probably due to the small object size, and hence, textural features were dropped from the classification process of this level. For the L40 and L75 classification, textural, spectral and contextual (computed from L15 classification to the L40 objects) features were used.
Image classification
Eight wetland and aquatic vegetation classes as well as two non-vegetation classes (water and unpaved road/exposed soil) identified in the study area are listed in . Some of the plant species in the area have significantly different spectral and textural properties based on age and abundance. Two classes were assigned to each of these species, and corresponding training sets were prepared. In this context, two classes of willow (willow matured and willow green), lotus (lotus and scattered lotus) and lettuce (lettuce and scattered lettuce) were introduced. The southern side of the image shows glinted Lake Okeechobee waters, and hence, a glinted water class separate from the regular water class was introduced.
Table 1. Classes used in the classification.
To apply the supervised classification method for multiscale OBIA, we need to collect training datasets to train the classifiers. In this study, three sets of training objects were collected on level 15, 40 and 75 using one set of 422 randomly generated points. The objects from these levels, where the generated random points reside, were identified and interpreted visually in the images. ACE biologists, who were actively monitoring and controlling invasive plants in the site for several years conducted the visual interpretation process. Only the coarse level (L200) was classified using simple rules to isolate large water bodies and bright exposed soils. Besides the pure vegetation classes listed in , three mixed classes were added in the L75 segmentation level. These three mixed classes are lotus–lettuce, lotus–cattail and lettuce–smartweed.
Many OBIA studies utilized hierarchical classification (Myint et al., Citation2011) to classify broad vegetation and non-vegetation land cover. Our study area is comprised mostly of wetland vegetation and water, but only a small area of upland exposed soils or unpaved roads exist at the northern side of the image. It was found more efficient to broadly categorize the water and exposed soils using simple rules applied to the spectral properties of the coarse segmentation (L200) objects. The two spectral criteria applied to this level are the following:
Max difference: Non-vegetation classes (road and water) showed a flat spectral graph representing smaller value of maximum difference and were separated out from the rest of the wetland area using a single threshold applied to the maximum difference feature of each object.
Blue layer mean: The non-vegetation classes were then categorized into water and road classes using a threshold applied to the blue band (water has higher blue band values).
The rest of the area, still unclassified, was then subjected to further classification. This area is mostly wetland vegetation plus some smaller water patches that escaped from the broad categorization of the coarse scale objects. The complex land cover of the study area and the low spectral resolution of the RGB images produced low classification accuracy if only objects from a single segmentation level were used. Our preliminary analysis indicated that the high (L75) and low (L40) segmentation levels captured the main variations in patch scale and were necessary to identify existing wetland vegetation. The fine scale L15 segmentation level results were used to compute hierarchical context features at the L40 level classification as mentioned earlier.
The classification process was performed on the high (L75) and low (L40) segmentation levels using the training dataset and selected object features. The low (L40) classification results separated all plant species; however, class confusion existed in some objects located within large textured objects at the L75 level. On the other hand, the high (L75) classification performed well with the majority of classes by minimizing intra-class variability. However, the results did not separate smaller species patches in mixed areas as efficiently. Mixed classes used in the L75 classes were resolved using the L40 classification. The L40 and L75 classification results were merged, and priority was given to the single classes of the L75 classification followed by L40 results.
Several classifiers were applied on the multi-resolution segmented objects. The ML classifier was used due to its extensive historical use (Foody, Campbell, Trodd, & Wood, Citation1992). The SVM and ANN machine learning methods were also used. In addition to the object-based classification, the pixel-based classification was applied to the same image using the same training set data and classification methods (ML, SVM and ANN). The original image (8 cm pixels size) was down-sampled to a 30-cm image using the Pixel Aggregate algorithm implemented in the ENVI5.0 software (Harris, Citation2017). Pixel-based classifiers were applied on the down-sampled image, and the results were compared with the OBIA results.
Post-classification refinement and accuracy assessment
Refinement of the OBIA classification results was performed based on the species thematic and contextual information. The hyacinth plant species generally grows in close proximity to open water. To separate hyacinth, open water objects were identified as those water objects with at least half of their neighboring objects are “water” or “submerged grass” classes. Then, all hyacinth objects located more than 80 m (personal communication with ACE biologists) away from open water objects were reassigned to the combined willow-smartweed class. Finally, classes representing the same species, which were split as separate classes with different training sets due to spectral/textural variations (lettuce and scattered lettuce classes and the lotus and scattered lotus classes), were merged back together. Similarly, the water, glinted water and submerged grass class were merged since our focus is primarily on emerging wetland plants. Green-colored willows appear very close to smartweeds in color and texture, and those two land covers are visually inseparable. We do not believe there is enough information in the images at all tested resolutions to separate these two classes and hence they were merged in this study.
To evaluate the accuracy of the OBIA and pixel-based classification results, accuracy assessment data, prepared independently from the training dataset, were used. A confusion matrix was created for each classification results using the truth assessment points. The overall accuracy and Kappa coefficients for the OBIA and pixel-based classified maps were tabulated and compared. shows a schematic diagram of the overall methodology adopted in this study including the multi-scale segmentation, classification, post-refinement and accuracy assessment steps.
Figure 2. Schematic diagram of the overall methodology used in this study.
Results
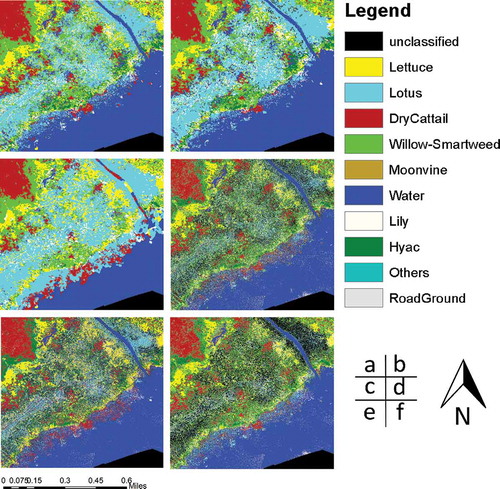
Object-based classification was conducted on the multiple segmentation levels of the study image using the ML, SVM and ANN classification methods. The results were compared with corresponding pixel-based classifications. shows three pixel-based maps resulting from the SVM, ANN and ML classifications applied to the original image (8 cm) resolution in addition to three object-based maps produced using corresponding classifiers. A zoomed-in representation of the same results is shown in to highlight the details of the classification results. Visual comparisons of the maps produced using the pixel- and object-based classification methods give preference to the object-based results. As expected, pixel-based classification results are generally fragmented and less appealing visually. Object-based results look smoother and show an overall better matching to the land cover types expected from visual image interpretation. The salt-and-pepper effect was clearly alleviated by object-based classification compared to the pixel-based results; this shows consistency with most research comparing the two approaches (Blaschke, Citation2010; Lillesand, Kiefer, & Chipman, Citation2014; Xie, Roberts, & Johnson, Citation2008).
Figure 3. Classified final maps (whole study area) using various classifiers. (a) Object-based SVM, (b) Object-based ANN, (c) Object-based ML, (d) Pixel-based SVM, (e) Pixel-based ANN, (f) Pixel-based ML (see for zoom-in area).
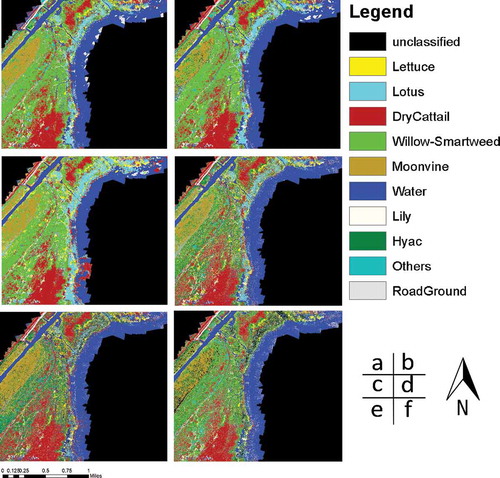
Figure 4. Classified final maps (zoom-in area) using various classifiers. (a) Object-based SVM, (b) Object-based ANN, (c) Object-based ML, (d) Pixel-based SVM, (e) Pixel-based ANN, (f) Pixel-based ML.
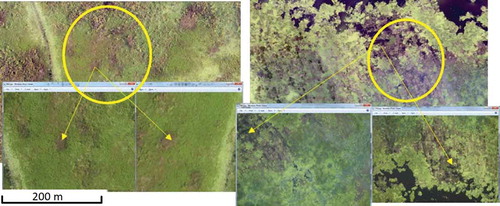
The lettuce and lily classes are mixed in some areas on the ground. Some of the observed misclassification can be attributed to lily areas showing in slightly out-of-focus (smoothed) or tilted images, which produces texture features that match abundant lettuce signatures. For similar reasons, some lettuce in mixed and disturbed areas were assigned to the lily class. shows two examples of two overlapped imagery showing the same location with different quality (note the difference in image blurriness and presence of haze). We expect that such variations affected the image mosaic used in the study and hence reduced the achieved classification accuracy. This observation highlights the effect of the image quality and consistency on the classification results. Although these variations existed in all types of aerial imagery, they probably have a significant effect on image mosaics produced by a large number of images captured by light weight small UAS as is the case in our research.
Figure 5. Two examples of inconstancies in image properties and associated effect on the mosaic.
Quantitative assessment of the classified maps again indicates the superior performance of the object-based classification results with higher overall accuracy and Kappa coefficients compared to pixel-based results for the same type of classifier, as presented in . The overall accuracies of the pixel-based methods are between 50.9% and 61.9%. Pixel-based classification of the lower-resolution image scored better (up to 61.9% for SVM). OBIA results scored better with object-based machine learning approaches producing overall accuracy around 70.8%. The object-based ML classifier performed moderately with an overall accuracy of 58.2%. The best results were achieved using the object-based SVM classification with an overall accuracy slightly above 70% and a Kappa coefficient of about 0.66.
Table 2. Classification accuracy.
Since we observed similar errors in the highest performing object-based classification methods (ANN and SVM), only the confusion matrix of the SVM results is presented in . Even though the overall accuracy of 70.8% is on par with what is expected from true color image classification and reported by other ecological studies, the accuracy distribution is not balanced among the classes. For example, the table shows that 90.5% producer accuracy was achieved for the moonvine class, while only 33.3% was produced for the hyacinth class. For lettuce and hyacinth classes, which are two invasive species in the area, user accuracies are higher (73.2% and 90.0%, respectively), but the producer accuracy is moderate for the lettuce (62.5%) and low for the hyacinth (33.3%) classes. The low producer accuracy (high omission error) indicates the high probability of missing this class in the classified map. The confusion matrix in shows that the hyacinth class is mixed mainly with the smartweed class.
Table 3. Accuracy assessment (confusion) matrix for the OBIA SVM classification results.
Discussion
This research demonstrated the use of object-based methods to classify wetland land cover, including floating vegetation species in South Florida using ultra-high spatial resolution (8 cm) imagery captured by unmanned aerial vehicles. The advantage of using the object-based approach is obvious in comparison with the pixel-based approach, as shown in . These results serve as additional proof that improvements can be made when the object-based approach is used for image classification (Blaschke, Citation2010). We believe that this is specifically true when high-resolution imagery captured by small UAS is used since pixel grouping reduces the within-class pixel variations while maintaining the fine resolution boundaries between adjacent plant communities. With a sub-decimeter pixel resolution, the mosaicked image used in this study belongs to the ultra-high spatial resolution dataset category. In this image category, the information contained in a single pixel regarding the object it belongs to is rather limited. For example, vegetation texture is usually a mixture of irregular shadow and vegetation (Ehlers, Gähler, & Janowsky, Citation2003), and this kind of texture cannot be captured by a single pixel or even a pixel neighborhood analysis.
Individual pixel limitation is more significant when it comes to UAS images, considering that most commonly used cost-effective UAS imaging platforms provide high spatial resolution images with a limited number of bands. Segmenting the image into objects aggregates the pixels into meaningful objects, for which other types of information can be extracted to supplement the poor spectral content of the image. We utilized multi-resolution objects to resolve the different patch sizes of the vegetation communities in the analyzed area. Our experimentation with single scale classification consistently yielded lower classification results and suggested the integration of multiple segmentation levels. We used thematic rules to improve the classification results in addition to the contextual information passed from one segmentation level to the other. The use of rules and hierarchical context information is considered one of the reasons for the improvement offered by the object-based classification approach (Blaschke, Citation2010). More rules and other features can be explored as our subject knowledge increases and as new spatial and topological metrics are developed.
The results of our study show that SVM and ANN results are comparable when used for wetland vegetation mapping with UAS images in the visible part of the spectrum. The difference in these results cannot clearly give preference to one of these classifiers in contrary to some research indicating some cooling among the remote sensing community toward the ANN classifier since the early 2000s (Balabin & Lomakina, Citation2011; Shao & Lunetta, Citation2012). The accuracy achieved by our research is in line with other research efforts utilizing visible broadband imagery for vegetation classification. Our accuracy is slightly higher than the ones achieved by Zweig, Burgess, Percival, and Kitchens (Citation2015), where UAS images were used to classify different sets of wetland vegetation communities in the Everglades area.
Our results show lower classification accuracy of the hyacinth class. The confusion matrix shown in indicates that the hyacinth class is confused with the willow-smartweed class, which probably means that the features used in this study were not enough to differentiate between these two classes. The images used in this study have a poor spectral resolution (only three bands in the visible spectrum). Increasing the spectral resolution of the images by incorporating more bands, especially in the near-infrared region, could increase the spectral separability of the vegetation classes and improve the classification accuracy as indicated by other researchers (Carle, Wang, & Sasser, Citation2014; Lane et al., Citation2014).
Some of the commercially available multispectral and line- or frame-based hyperspectral cameras designed for small UAS can be used to improve the classification accuracy. However, these cameras are still expensive and may not be cost-effective to support invasive plant control operations, especially with the high possibility of sensor loss due to UAS accidents. We expect that more technologically advanced cost-effective sensors and better UAS safety and recovery measures will facilitate the use of higher spectral resolution sensors in the near future. In fact, the research team is working currently on using an additional infrared band captured by a modified low-cost camera in addition to the visible color images to improve the classification accuracy of another wetland site in central Florida.
One of the potential reasons contributing to the low classification accuracy of some classes is the radiometric inconsistency among the hundreds of UAS images contributing to the image mosaic. A close examination of the images in our dataset shows that while most of the study area is covered by clear high-quality imagery, some of the images are blurred and radiometrically inconsistent with the rest of the images. This may be related to the sensor-sun-object geometry, differences in flying altitude, the bidirectional reflectance properties of the vegetation and illumination properties at the time of image exposure. When mosaicking two images with different radiometric properties, adjacent areas look different and affect the classification quality. Efforts are still needed to improve the radiometric calibration of UAS imagery probably through image-to-image normalization using inherent image contents and induced calibration targets. Integrating the objects bidirectional reflectance properties in the image radiometric calibration models could improve the classification accuracy, especially with the expected increase of high spectral resolution imagery captured by small UAS.
Based on our results, we believe that UAS is a small, fast and easily deployable system that provides an inexpensive platform for natural resource management operations over small and medium size areas when high-resolution imagery is in demand. This comes in line with the review article on UAS by Colomina and Molina (Citation2014), which indicates that UAS is attracting more and more researchers from the remote sensing community in different disciplines over the past 5 years. However, as an emerging data source, UAS is still in need for more research and development, especially at the data processing level.
Conclusion
According to the result of experiments, this study indicates that the use of OBIA of high spatial resolution (sub-decimeter) UAS imagery is viable for wetland vegetation mapping, even though significant room for continued improvement still exists. Object-based classification produced higher accuracy than pixel-based classification using our ultra-high spatial resolution images. This is consistent with other similar studies (Myint et al., Citation2011). However, the disadvantage of object-based scheme was also revealed in this study, with a great amount of time and efforts spent on scale parameter selection or post-classification refinement for an object-based approach with expert knowledge. The study also showed that SVM tended to offer a higher accuracy level when compared to the other tested classifiers (i.e. ANN, ML).
Future work includes developing advanced image calibration techniques to improve the radiometric quality of the images. Also, it is recommended to experiment with higher spectral resolution (multispectral or hyperspectral images), which are increasingly becoming more cost-effective and feasible for small UAS.
Disclosure statement
No potential conflict of interest was reported by the authors.
References
- Abd-Elrahman, A., Pearlstine, L., & Percival, F. (2005). Development of pattern recognition algorithm for automatic bird detection from unmanned aerial vehicle imagery. Surveying and Land Information Science, 65, 37.
- Aguilar, M., Saldaña, M., & Aguilar, F. (2013). GeoEye-1 and WorldView-2 pan-sharpened imagery for object-based classification in urban environments. International Journal of Remote Sensing, 34, 2583–2606. doi:10.1080/01431161.2012.747018
- Ashish, D., McClendon, R., & Hoogenboom, G. (2009). Land‐use classification of multispectral aerial images using artificial neural networks. International Journal of Remote Sensing, 30, 1989–2004. doi:10.1080/01431160802549187
- Baatz, M., & Schäpe, A. (2000). Multiresolution segmentation: An optimization approach for high quality multi-scale image segmentation. Angewandte Geographische Informationsverarbeitung, XII, 12–23.
- Balabin, R.M., & Lomakina, E.I. (2011). Support vector machine regression (SVR/LS-SVM) – An alternative to neural networks (ANN) for analytical chemistry? Comparison of nonlinear methods on near infrared (NIR) spectroscopy data. Analyst, 136, 1703–1712. doi:10.1039/c0an00387e
- Belluco, E., Camuffo, M., Ferrari, S., Modenese, L., Silvestri, S., Marani, A., & Marani, M. (2006). Mapping salt-marsh vegetation by multispectral and hyperspectral remote sensing. Remote Sensing of Environment, 105, 54–67. doi:10.1016/j.rse.2006.06.006
- Benediktsson, J.A., Swain, P.H., & Ersoy, O.K. (1990). Neural network approaches versus statistical methods in classification of multisource remote sensing data.IEEE Transactions on Geoscience and Remote Sensing, 28(4), 540-552
- Blaschke, T. (2010). Object based image analysis for remote sensing. ISPRS Journal of Photogrammetry and Remote Sensing, 65, 2–16. doi:10.1016/j.isprsjprs.2009.06.004
- Carle, M.V., Wang, L., & Sasser, C.E. (2014). Mapping freshwater marsh species distributions using WorldView-2 high-resolution multispectral satellite imagery. International Journal of Remote Sensing, 35(13), 4698–4716. doi:10.1080/01431161.2014.919685
- Castillejo-González, I.L., López-Granados, F., García-Ferrer, A., Peña-Barragán, J.M., Jurado-Expósito, M., de la Orden, M.S., & González-Audicana, M. (2009). Object- and pixel-based analysis for mapping crops and their agro-environmental associated measures using QuickBird imagery. Computers and Electronics in Agriculture, 68, 207–215. doi:10.1016/j.compag.2009.06.004
- Chen, Y., Shi, P., Fung, T., Wang, J., & Li, X. (2007). Object‐oriented classification for urban land cover mapping with ASTER imagery. International Journal of Remote Sensing, 28, 4645–4651. doi:10.1080/01431160500444731
- Coburn, C., & Roberts, A. (2004). A multiscale texture analysis procedure for improved forest stand classification. International Journal of Remote Sensing, 25, 4287–4308. doi:10.1080/0143116042000192367
- Colomina, I., & Molina, P. (2014). Unmanned aerial systems for photogrammetry and remote sensing: A review. ISPRS Journal of Photogrammetry and Remote Sensing, 92, 79–97. doi:10.1016/j.isprsjprs.2014.02.013
- Cordeiro, C.L.D.O., & Rossetti, D.D.F. (2015). Mapping vegetation in a late Quaternary landform of the Amazonian wetlands using object-based image analysis and decision tree classification. International Journal of Remote Sensing, 36, 3397–3422. doi:10.1080/01431161.2015.1060644
- Cortes, C., & Vapnik, V. (1995). Support-vector networks. Machine Learning, 20, 273–297. doi:10.1007/BF00994018
- Developer, e. (2012). User guide. Trimble Documentation.
- Dingle Robertson, L., & King, D.J. (2011). Comparison of pixel- and object-based classification in land cover change mapping. International Journal of Remote Sensing, 32, 1505–1529. doi:10.1080/01431160903571791
- Dronova, I., Gong, P., & Wang, L. (2011). Object-based analysis and change detection of major wetland cover types and their classification uncertainty during the low water period at Poyang Lake, China. Remote Sensing of Environment, 115, 3220–3236. doi:10.1016/j.rse.2011.07.006
- Ehlers, M., Gähler, M., & Janowsky, R. (2003). Automated analysis of ultra high resolution remote sensing data for biotope type mapping: New possibilities and challenges. ISPRS Journal of Photogrammetry and Remote Sensing, 57, 315–326. doi:10.1016/S0924-2716(02)00161-2
- Flanders, D., Hall-Beyer, M., & Pereverzoff, J. (2003). Preliminary evaluation of eCognition object-based software for cut block delineation and feature extraction. Canadian Journal of Remote Sensing, 29, 441–452. doi:10.5589/m03-006
- Foody, G.M., Campbell, N., Trodd, N., & Wood, T. (1992). Derivation and applications of probabilistic measures of class membership from the maximum-likelihood classification. Photogrammetric Engineering and Remote Sensing, 58, 1335–1341.
- Gao, P., Trettin, C.C., & Ghoshal, S. (2012). Object-oriented segmentation and classification of wetlands within the Khalong-la-Lithuny a catchment, Lesotho, Africa. In Geoinformatics (GEOINFORMATICS), 2012 20th International Conference on (pp. 1–6): IEEE
- Gao, Y., & Mas, J.F. (2008). A comparison of the performance of pixel-based and object-based classifications over images with various spatial resolutions. Online Journal of Earth Sciences, 2, 27–35.
- Ge, S., Carruthers, R., Gong, P., & Herrera, A. (2006). Texture analysis for mapping Tamarix parviflora using aerial photographs along the Cache Creek, California. Environmental Monitoring and Assessment, 114, 65–83. doi:10.1007/s10661-006-1071-z
- Haralick, R.M., Shanmugam, K., & Dinstein, I.H. (1973). Textural features for image classification. IEEE Transactions on Systems, Man and Cybernetics, SMC-3, 610–621. doi:10.1109/TSMC.1973.4309314
- Harris. (2017). How does the Pixel Aggregate method work when resizing data with ENVI? Retrived from http://www.harrisgeospatial.com/Support/SelfHelpTools/HelpArticles/HelpArticles-Detail/TabId/2718/ArtMID/10220/ArticleID/16094/How-does-the-Pixel-Aggregate-method-work-when-resizing-data-with-ENVI-.aspx
- Hsieh, P.-F., Lee, L.C., & Chen, N.-Y. (2001). Effect of spatial resolution on classification errors of pure and mixed pixels in remote sensing. IEEE Transactions on Geoscience and Remote Sensing, 39, 2657–2663. doi:10.1109/36.975000
- Johnson, B.A. (2013). High-resolution urban land-cover classification using a competitive multi-scale object-based approach. Remote Sensing Letters, 4, 131–140. doi:10.1080/2150704X.2012.705440
- Laliberte, A.S., & Rango, A. (2009). Texture and scale in object-based analysis of subdecimeter resolution unmanned aerial vehicle (UAV) imagery. IEEE Transactions on Geoscience and Remote Sensing, 47, 761–770. doi:10.1109/TGRS.2008.2009355
- Laliberte, A.S., Rango, A., & Herrick, J. (2007). Unmanned aerial vehicles for rangeland mapping and monitoring: A comparison of two systems. In ASPRS Annual Conference Proceedings
- Lane, C.R., Liu, H., Autrey, B.C., Anenkhonov, O.A., Chepinoga, V.V., & Wu, Q. (2014). Improved wetland classification using eight-band high resolution satellite imagery and a hybrid approach. Remote Sensing, 6(12), 12187–12216. doi:10.3390/rs61212187
- Li, M., Bijker, W., & Stein, A. (2015). Use of Binary Partition Tree and energy minimization for object-based classification of urban land cover. ISPRS Journal of Photogrammetry and Remote Sensing, 102, 48–61. doi:10.1016/j.isprsjprs.2014.12.023
- Lillesand, T., Kiefer, R.W., & Chipman, J. (2014). Remote sensing and image interpretation. John Wiley & Sons.
- Maheu-Giroux, M., & de Blois, S. (2005). Mapping the invasive species Phragmites australis in linear wetland corridors. Aquatic Botany, 83, 310–320. doi:10.1016/j.aquabot.2005.07.002
- Moffett, K.B., & Gorelick, S.M. (2013). Distinguishing wetland vegetation and channel features with object-based image segmentation. International Journal of Remote Sensing, 34, 1332–1354. doi:10.1080/01431161.2012.718463
- Mountrakis, G., Im, J., & Ogole, C. (2011). Support vector machines in remote sensing: A review. ISPRS Journal of Photogrammetry and Remote Sensing, 66, 247–259. doi:10.1016/j.isprsjprs.2010.11.001
- Myint, S.W., Gober, P., Brazel, A., Grossman-Clarke, S., & Weng, Q. (2011). Per-pixel vs. object-based classification of urban land cover extraction using high spatial resolution imagery. Remote Sensing of Environment, 115, 1145–1161. doi:10.1016/j.rse.2010.12.017
- Niemeyer, I., & Canty, M.J. (2003). Pixel-based and object-oriented change detection analysis using high-resolution imagery. In Proceedings 25th Symposium on Safeguards and Nuclear Material Management (pp. 2133–2136)
- Olmsted, I.C., & Armentano, T.V. (1997). Vegetation of Shark Slough, Everglades National Park. Homestead, FL: South Florida Natural Resources Center, Everglades National Park.
- Oruc, M., Marangoz, A., & Buyuksalih, G. (2004). Comparison of pixel-based and object-oriented classification approaches using Landsat-7 ETM spectral bands. In Proceedings of the IRSPS 2004 Annual Conference (pp. 19–23).
- Pearlstine, L., Portier, K.M., & Smith, S.E. (2005). Textural discrimination of an invasive plant, Schinus terebinthifolius, from low altitude aerial digital imagery. Photogrammetric Engineering & Remote Sensing, 71, 289–298. doi:10.14358/PERS.71.3.289
- Radoux, J., & Defourny, P. (2007). A quantitative assessment of boundaries in automated forest stand delineation using very high resolution imagery. Remote Sensing of Environment, 110, 468–475. doi:10.1016/j.rse.2007.02.031
- Rango, A., Laliberte, A., Steele, C., Herrick, J.E., Bestelmeyer, B., Schmugge, T., … Jenkins, V. (2006). Research article: Using unmanned aerial vehicles for rangelands: Current applications and future potentials. Environmental Practice, 8, 159–168. doi:10.1017/S1466046606060224
- Shao, Y., & Lunetta, R.S. (2012). Comparison of support vector machine, neural network, and CART algorithms for the land-cover classification using limited training data points. ISPRS Journal of Photogrammetry and Remote Sensing, 70, 78–87. doi:10.1016/j.isprsjprs.2012.04.001
- Smith, G.M., Spencer, T., Murray, A.L., & French, J.R. (1998). Assessing seasonal vegetation change in coastal wetlands with airborne remote sensing: An outline methodology. Mangroves and Salt Marshes, 2, 15–28. doi:10.1023/A:1009964705563
- St-Louis, V., Pidgeon, A.M., Radeloff, V.C., Hawbaker, T.J., & Clayton, M.K. (2006). High-resolution image texture as a predictor of bird species richness. Remote Sensing of Environment, 105, 299–312. doi:10.1016/j.rse.2006.07.003
- Szantoi, Z., Escobedo, F., Abd-Elrahman, A., Smith, S., & Pearlstine, L. (2013). Analyzing fine-scale wetland composition using high resolution imagery and texture features. International Journal of Applied Earth Observation and Geoinformation, 23, 204–212. doi:10.1016/j.jag.2013.01.003
- Tehrany, M.S., Pradhan, B., & Jebur, M.N. (2013). Remote sensing data reveals eco-environmental changes in urban areas of Klang Valley, Malaysia: Contribution from object based analysis. Journal of the Indian Society of Remote Sensing, 41, 981–991. doi:10.1007/s12524-013-0289-9
- Veenman, C.J., Reinders, M.J., & Backer, E. (2002). A maximum variance cluster algorithm. IEEE Transactions on Pattern Analysis and Machine Intelligence, 24, 1273–1280. doi:10.1109/TPAMI.2002.1033218
- Wang, L., Sousa, W.P., Gong, P., & Biging, G.S. (2004). Comparison of IKONOS and QuickBird images for mapping mangrove species on the Caribbean coast of Panama. Remote Sensing of Environment, 91, 432–440. doi:10.1016/j.rse.2004.04.005
- Waser, L., Baltsavias, E., Ecker, K., Eisenbeiss, H., Feldmeyer-Christe, E., Ginzler, C., … Zhang, L. (2008). Assessing changes of forest area and shrub encroachment in a mire ecosystem using digital surface models and CIR aerial images. Remote Sensing of Environment, 112, 1956–1968. doi:10.1016/j.rse.2007.09.015
- Watts, A.C., Bowman, W.S., Abd-Elrahman, A.H., Mohamed, A., Wilkinson, B.E., Perry, J., … Lee, K. (2008). Unmanned Aircraft Systems (UASs) for ecological research and natural-resource monitoring (Florida). Ecological Restoration, 26, 13–14. doi:10.3368/er.26.1.13
- Whiteside, T.G., Boggs, G.S., & Maier, S.W. (2011). Comparing object-based and pixel-based classifications for mapping savannas. International Journal of Applied Earth Observation and Geoinformation, 13, 884–893. doi:10.1016/j.jag.2011.06.008
- Willhauck, G., Schneider, T., De Kok, R., & Ammer, U. (2000). Comparison of object oriented classification techniques and standard image analysis for the use of change detection between SPOT multispectral satellite images and aerial photos. In,Proceedings of XIX ISPRS congress (pp. 35–42). Citeseer
- Xie, Z., Roberts, C., & Johnson, B. (2008). Object-based target search using remotely sensed data: A case study in detecting invasive exotic Australian pine in south Florida. ISPRS Journal of Photogrammetry and Remote Sensing, 63, 647–660. doi:10.1016/j.isprsjprs.2008.04.003
- Yan, G., Mas, J.F., Maathuis, B., Xiangmin, Z., & Van Dijk, P. (2006). Comparison of pixel‐based and object‐oriented image classification approaches – A case study in a coal fire area, Wuda, Inner Mongolia, China. International Journal of Remote Sensing, 27, 4039–4055. doi:10.1080/01431160600702632
- Yang, X. (2007). Integrated use of remote sensing and geographic information systems in riparian vegetation delineation and mapping. International Journal of Remote Sensing, 28, 353–370. doi:10.1080/01431160600726763
- Yu, Q., Gong, P., Clinton, N., Biging, G., Kelly, M., & Schirokauer, D. (2006). Object-based detailed vegetation classification with airborne high spatial resolution remote sensing imagery. Photogrammetric Engineering & Remote Sensing, 72, 799–811. doi:10.14358/PERS.72.7.799
- Zweig, C.L., Burgess, M.A., Percival, H.F., & Kitchens, W.M. (2015). Use of unmanned aircraft systems to delineate fine-scale wetland vegetation communities. Wetlands, 35, 303–309. doi:10.1007/s13157-014-0612-4