
ABSTRACT
To examine the kinematics of the savanna–forest transition via phenology from 1981 to 2006 and from Côte d’Ivoire to Benin, the normalized difference vegetation index has been used to describe the temporal variation of the photosynthetic activity. A synthetic index of bimodality has been computed at pixel scale before and after 1994. No class in Côte d’Ivoire shows a change from a forest bimodal character to a savanna unimodal character. On the other hand, the only unimodal class in the entire series shows a minute inflexion toward a bimodal rhythm. In Benin, one notes greater stability between the two periods. The “regreening” that was observed in Sahel can be associated with a similar, yet not strongly marked, phenomenon in the Sudanian–Guinean transition.
Introduction
West Africa’s vegetation cover is undergoing significant changes (FAO, Citation2008; Richard, Citation1990) in more or less direct reaction to climate evolution (Dardel et al., Citation2014) and anthropogenic activities (Korateng, Zawila-Niedzwiecki, & Adu-Poku, Citation2016), the former being generally the primary factor of change in Sahelian latitudes (Dardel et al., Citation2014; Herrmann, Anyamba, & Tucker, Citation2005), and the latter being the primary factor in Sudanian and Guinean latitudes (FAO, Citation2008; Korateng et al., Citation2016). When studying vegetation changes, special attention has often been paid to the forest–savanna interface in space and time, from Aubréville (Citation1949) to Barima (Citation2009) and Barima et al. (Citation2016). Among the anthropic factors of change in the vegetation cover, those related to armed conflicts are being studied in the context of a multidisciplinary and international program titled “Landscape dynamics during political/military crises in Côte d’Ivoire: influence on the management and availability of farmland and food security”, of which this paper is part. It concerns the Côte d’Ivoire armed conflict in the first decade of twenty-first century (Barima et al., Citation2016). Landscape dynamics related to this conflict and its consequences are being studied in this research program through a series of hypotheses the first of which – tested here – is that the dynamics of savannization of the vegetation, which began decades ago, has increased strongly after the years 2000. Among the climatic factors of change in the vegetation cover, the Sahelian zone has been well studied for the impacts of drought in the 1970s and 1980s and since mid-1990s for the regreening of the Sahel (Nicholson, Citation2005). Very few analyses of this phenomenon in the wetter zones from Sudanian to Guinean climate have yet been conducted (Gessner et al., Citation2015; Vrieling, De Beurs, & Brown, Citation2011). How did vegetation phenology changed from Sudanian to Guinean between the 1980s and the 2000s requires a more detailed study. Therefore, the aim of this article is to examine the kinematics of the savanna–forest transition on a macro-regional scale and on a decennial scale via a phenological reading of the phenomenon.
To do so, the NDVI (normalized difference vegetation index) has been used which transcribes the intensity of the photosynthetic activity at a given moment into quantitative values. Therefore, its variation in time makes it possible to describe the temporal variation of the photosynthetic activity (Noormets, Citation2009). Now, the seasonal variation of the photosynthetic activity is part of the functioning of the plant world in all regions, with at least one constraining season (Liu & Kogan, Citation1996). Indeed, in order to adapt to such a constraining season, the vegetation reduces its photosynthetic activity, usually by dropping leaves and sometimes by merely putting the vegetative tissue into dormancy (Nicholson, Tucker, & Ba Citation1998; Godron, Citation1984).
Three main datasets are usually used in such studies: Global Inventory Modeling and Mapping Studies (GIMMS) NOAA AVHRR, SPOT VGT followed by PROBA-V (Wolters et al., Citation2015) and MODIS (Fensholt, Rasmussen, Nielsen, & Mbow, Citation2009). The main differences between these datasets are spatial resolution and the beginning of the time series.
The PROBA-V product offers the best spatial resolution with a 100-m pixel but temporal coverage begins in 2013.
The MODIS Terra MOD13Q1 product offers the second best spatial resolution with a 250-m pixel but temporal coverage begins in 2000.
Spot vegetation offers a lower resolution with a 1-km pixel with temporal coverage beginning in 1998.
GIMMS AVHRR offers a much lower resolution with an 8-km pixel but temporal coverage begins in 1981.
Here, changes have been studied in the longest possible period in a large enough region to obtain a medium to large resolution. Therefore, GIMMS AVHRR is the most appropriate dataset. In addition, Fensholt et al. (Citation2009) affirm about SPOT VGT that the replacement of VGT1 by VGT2 in 2003 involved a change in spectral response. Since these considerations, a great deal of efforts has been around since that time to reprocess the SPOT VGT dataset and the weakness stressed by Fensholt has been reduced (Deronde et al., Citation2014).
About GIMMS AHHRR, the authors suggest that trends in the Guinean zone should be interpreted with great caution (Fensholt et al., Citation2009).
To that effect, the analysis of a temporal series of NDVI images has been carried out in order to study the vegetation’s seasonal vegetative cycles and these cycles’ decennial variation (Hmimina et al., Citation2013). The aim is first to test the hypothesis that it is possible to map the limit between ecosystems with a vegetation following a seasonal rhythm representative of forests (evergreen to bimodal vegetative rhythm) on the one hand and ecosystems with a vegetation following a seasonal rhythm representative of savannas (deciduous with unimodal vegetative rhythm). Next, the temporal variations of these cycles on a decennial scale will be studied in order to verify the hypothesis that a dynamics of savannization can be perceived through the NDVI variation here studied as the conversion from bimodal to unimodal rhythm of vegetative phenology.
Numerous methods exist to extract vegetation characteristics using NDVI time series, but no universal methods are available yet (White et al., Citation2009). First, within phenological studies by NDVI time series, analyses of differences in phenological categories without studying long-term change (Pervez & Brown, Citation2010) and analyses of long-term changes in phenology within one phenological category (Anyamba & Tucker, Citation2005) can be distinguished. Yet to date, scrutiny of the available literature has not revealed any paper studying phenological changes on the long term that reported the conversion from one phenological category to another as presented here. Then, the main methodological distinction in NDVI time series studies is to be made between papers where NDVI is used as a surrogate estimator of NPP (Xu, Li, & Hu et al., Citation2012) and papers where phenological metrics are extracted from the time series (Anyamba & Tucker, Citation2005; Lu, Kuenzer, Wang, Guo, & Li, Citation2015). This paper belongs to the metrics category. However, among phenological metrics change analyses, no publications have been found about a distinction between unimodal and bimodal phenologies, which explains this publication of an original metrics. In addition, most papers study a trend of NDVI (or of a metrics) either positive for regreening areas (Hmimina et al., Citation2013) and global warming consequences (Gao et al., Citation2016) or negative for degradation processes (Zhang et al., Citation2014). But, in our case of transition from bimodal to unimodal phenology, trends are positive in the dry season and negative in the rainy season. That is why, the mainstream metrics trend methods have been avoided and why a diachronic approach is presented with a division of the time series in two periods and a method has been built instead of using an existing one. This dynamics of vegetation in response to climate variation could have been studied by coupling NDVI with climate data as well, though the climate variation is quite well studied. Kouassi et al. (Citation2010) have shown that during the 1970s–mid-1990s drought, the short dry season got shorter and that since mid-1990s, rain is increasing. Therefore, it has been decided to begin with analyzing only NDVI which has shown phenological important shifting during the studied period.
Sites of study and data
Sites of study
West Africa is structured by a latitudinal biogeographical transition (White, Citation1986). The equatorial regions, which receive the most regular rainfall, are covered by evergreen tropical rainforest. The latter gives way to semi-evergreen tropical deciduous forest with bimodal phenology, because the vegetation experiences some dormancy in July–August and stronger dormancy from November to March. Furthermore north, the forest savanna has a unimodal cycle which is rising at the beginning of the rainy season and falling after it has ended. The length and intensity of this vegetative season decreases progressively toward desert regions (Aubreville, Citation1950). Our area, within the West-African latitudinal biogeography, concerns only the transition between tropical deciduous forests with a bimodal cycle and Sudanian savannas with unimodal cycles. That is why, what is detected here by remote sensing is the transition between the bimodal and unimodal cycles in space and time. The southern (southwestern) part is characterized by a humid climate with two rainy seasons; the long dry season lasts from November to March. The most part of this area belonged to the mesophilic sector’s dense moist semi-deciduous forest zone with Celtis spp. and Triplochiton scleroxylon (Guillaumet and Adjanohoun, Citation1971). The northern (northeastern) part belongs to the transition between clear forests and savanna with Combretum micranthum and Faidherbia albida with a rainy season of 3–4 months (June–July to September–October). Tree leaf development begins in April–May, just before the first rains, and is at its highest value in July, August and September when it is combined with grass development. Along this climate and phenological gradient, land-cover types gradually change from agroforestry to agropastoralism.
The D2PCPCI (cf. Acknowledgment) research program of which this study is part is based on an analysis carried out in sites (on a commune scale) located in various regions (and situations) of Côte d’Ivoire and Benin. The Côte d’Ivoire sites are representative of regions having received high flows of migrants as a result of armed conflicts. In this respect, Benin is representative of a certain stability and low immigration flows.
Therefore, a rectangle encompassing the whole of Côte d’Ivoire and Benin has been delimited as a zone of study. Therefore, the area which is mapped here covers also the whole of Togo and Ghana, and the southern part of Mali, Burkina Faso and Niger. The bounding box coordinates are as follows:
North: 12.4956436;
South: 4.2774620;
West: −8.7229571;
East: 4.0043156.
Data
The NOAA GIMMS NDVI, downloaded from USGS Earth Explorer (http://earthexplorer.usgs.gov/), is
a normalized difference vegetation index (NDVI) product available for a 25-year period spanning from 1981 to 2006. The data set is derived from imagery obtained from the Advanced Very High Resolution Radiometer (AVHRR) instrument onboard the NOAA satellite series 7, 9, 11, 14, 16 and 17. This is an NDVI data set that has been corrected for calibration, view geometry, volcanic aerosols, and other effects not related to vegetation change. (Tucker et al., Citation2005)
The image resolution is 8 km, which strongly flattens all the local structures of land use and ecosystems to transmit only a phenological information on the overall vegetation cover. With this database, only large forest massifs can be distinguished from large farmland areas (Andrieu Citation2008). Beck et al. (Citation2011) present a comparison of the four NDVI products obtained from the AVHRR and affirm that among these results, “in the comparison of temporal-change values the GIMMS dataset performed best”.
It should be noted, Fensholt et al. (Citation2009) warn that
AVHRR GIMMS coarse resolution NDVI data set is well suited for long-term vegetation studies of the Sahel–Sudanian areas receiving less than 1000 mm rainfall, whereas interpretation of GIMMS NDVI trends in more humid areas of the Sudanian–Guinean zones should be done with certain reservations.
Nevertheless, this paper, with all due caution, presents valid results.
The set of data, from July 1981 to December 2006, covers a long period of major changes for West Africa. A period of drought, from 1968 to 1994 (Dai et al., Citation2005; Nicholson, Citation2001), was followed by a return of wetter conditions since 1994 (Nicholson, Citation2005). Therefore, the temporal series begins at the heart of the period of drought, a few years before 1984, which is considered as the driest year by most stations (Hulme, Doherty, Ngara, New, & Lister, Citation2001). It does not allow to study evolutions linked to the beginning of that period of drought, but conversely, it is suitable for phenological observations of the end of the dry period and the beginning of the wetter period (Anyamba & Tucker, Citation2005).
As regards the consequences of armed conflicts in Côte d’Ivoire (2000–2011), once again the dataset is not very well positioned in time, because it covers neither the second half of the conflict period nor the period from 2011 to date. That is why, this paper focuses on the context regional and decennial characterization that can be followed by studies of temporal series of NDVI MODIS with a higher resolution and a more recent time span.
Method
Biogeographical reading of NDVI temporal series
Remote sensing makes it possible to follow the vegetative biomass’ phenological cycles using temporal series of vegetation indices with high temporal resolution (infra-monthly) on a decennial scale (Anyamba & Tucker, Citation2005 Eckert, Hüsler, Liniger, & Hodel, Citation2015; Heumann, Seaquist, Eklundh, & Jonsson, Citation2007; Hutchinson, Jacquin, Hutchinson, & Verbesselt, Citation2015; Jacquin, Sheeren, & Lacombe, Citation2010; Jamali, Seaquist, Eklundh, & Ardö, Citation2014; Mbow, Fensholt, Nielsen, & Rasmussen, Citation2014; Omuto, Vargas, Alim, & Paron, Citation2010; Tucker et al., Citation2005), sometimes by combining them with rainfall data (Li, Lewisa, Rowlandb, Tappan, & Tieszen, Citation2004), which is not the case for this paper. The aim of this paper is not to publish an original method but, instead, original results concerning a specific region that underwent unstudied phenological changes.
Research work for detecting and following phenological differences between types of vegetation with a unimodal or bimodal rhythm of the photosynthetic activity has been carried out either in agricultural areas (Jakubauskas, Legates, & Kastens, Citation2002) or in forest areas (Zhang et al., Citation2014). The same approach is sought here. However, the correspondence between phenology and physiognomy is not absolute, and it is possible that the phenological kinetics detected here cannot be interpreted directly as a savanna–forest conversion. Nonetheless, phenological kinematics is no doubt a powerful indicator of the vegetation’s evolution (Camberlin, Martiny, Philippon, & Richard, Citation2007).
Should the first hypothesis be validated, i.e. if the spatialization of either the unimodal or bimodal rhythm enables us to distinguish large ensembles of vegetable formation in the long term (1981–2006 average), then the second hypothesis will be tested, namely that between 1982 and 2006, the region underwent a diminution of bimodal phenology to the benefit of unimodal phenology.
To test the second hypothesis, it has been decided to divide the temporal series into two periods, before and after the year 1994 which is given in the literature as the breaking point between the period of drought and the current wetter period (Nicholson, Citation2005). Profiles are calculated for the 2 periods for the same 10 regions.
Profiles and indices
A biogeographical reading of seasonal phenological cycles is what is sought here. To that effect, the production of seasonal profiles makes it possible to analyze the various vegetative cycles of the various regions and various periods. Each pixel contains its own temporal profile, but in order to reduce profiles to a number which is possible to study or present, pixels had to be reduced to a small number of classes. This is the reason why it has been decided to subdivide the studied region into 10 classes, an average number allowing both to attain the precision of a micro-regional reading and to produce an overall reading of all maps and graphs. The region approach is advised by Lhermitte et al. (Citation2008). Now, the climate transition between Guinean and Sudanian climate is a relatively regular latitudinal gradient. Earlier phytogeographical studies (White, Citation1986) and recent ones (Andrieu Citation2008) show that the vegetation also is structured by a regular gradient where phenology varies relatively regularly from North to South provided the relief of the type of soil doesn’t undergo a sudden change. For this reason, a simple pixel-based classification creates continuous and compact regions without resorting to image segmentation as envisaged at first, thus obtaining a more accurate spatialization than that obtained by segmentation.
In such a gradual and progressive zoning, trying to place a clear limit between two ensembles that are considered as homogeneous would be far from the biogeographical reality (Alexandre and Génin, Citation2012). The phenological classes/phenological areas allow to reduce the gradient’s complexity to a number of easy-to-present individuals and, at the same time, it is still possible to retain a gradual reading of biogeography. To retain a gradual reading of gradual phenomena, one has on the one hand to study each class in comparison with the classes which are close to it (both spatially and phenologically) and on the other hand to remember that these classes have edge effects and that it could be possible to make out intermediate ecotones between adjoining classes.
Because analyzing kinematics by class and not by pixel could mask some counter-trend-isolated pixels within the classes, a validation of this result by means of an analysis by pixel has been tried. Therefore, a binary index describing the rhythm’s unimodality or bimodality is calculated and mapped in space (pixels) and in time (two periods) enabling us to produce a synthetic map of phenological kinematics. Again, the aim here is not to distinguish two biogeographical regions with a clear limit separating two homogeneous regions, it is to find out whether sets of pixels are characterized by a transition kinematics between a unimodal and a bimodal rhythm in the time span studied here.
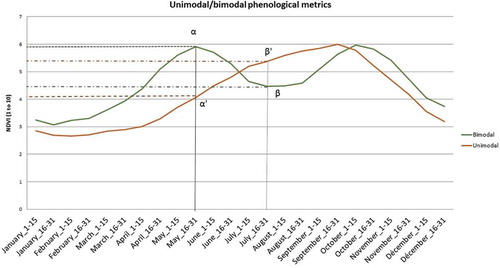
The original metrics proposed here is illustrated in . The bimodal phenology is characterized by a NDVI value in the second half of May (α) higher than the NDVI value in the second half of July (β). Conversely, unimodal phenology is characterized by a NDVI value in the second half of May (α′) lower than the NDVI value in the second half of July (β′).
Figure 1. Metrics for distinction between unimodal and bimodal phenologies in West-African climate.
Detailed data processing
Data processing has been carried out directly on the whole NOAA GIMMS NDVI time series under ©IDRISI SELVA software of ©Clark Labs with a “stand alone license”.
depicts the data processing.
Figure 2. Flowchart of image processing.
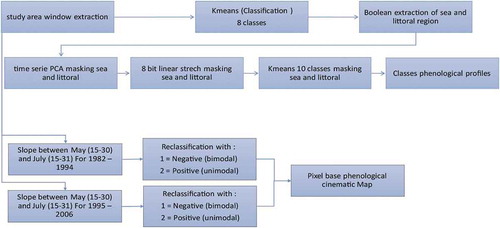
First, in order to delimit these areas, after extracting the rectangle encompassing our zone of study on all images of the temporal series, an initial K-means unsupervised classification (Diday, Citation1971) has been carried out on a sample of images so as to extract a class corresponding to the sea and a narrow coastal strip (1 pixel wide) which is blurred by the latter and is not concerned by the present analysis, thus producing a Boolean mask.
Next, a PCA was carried out on the whole of the temporal series (applying the aforesaid mask). A forward T mode was applied over the variance/covariance matrix. The main components (more than 1% of the eigenvalue) were numbered from 0 to 255 to create Principal component’s coordinate as raster.
The third and last part of this classification data processing is another K-means unsupervised classification (once more in 10 classes) still applying the mask. These 10 classes correspond to the 10 areas studied in this paper (). The mean of each 15-day unit (frequency of the dataset; e.g., 1–15th January, 16–31th January etc.) has been calculated over the 1982–2006 period. It creates a dataset for the studied periods of 24 NDVI mean images. The NDVI mean of each class for each 24 NDVI mean images enabled us to draw the curves ( and ). The low-resolution and long-term mean is intended to filter small changes in land-cover and ecosystems dynamics to show only a macroregional climatic and biogeographical spatial structure.
Figure 3. Map of the phenology of the annual photosynthetic activity cycles (1982–2006 average).
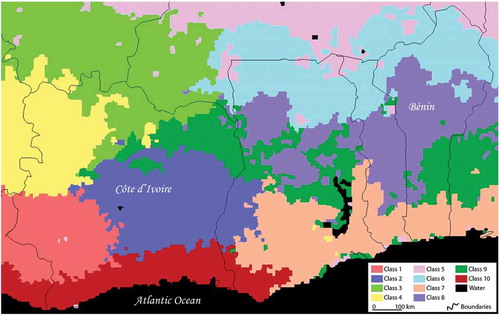
Figure 4. Curves of NDVI seasonal cycles in 1982–2006 average for Côte d’Ivoire.
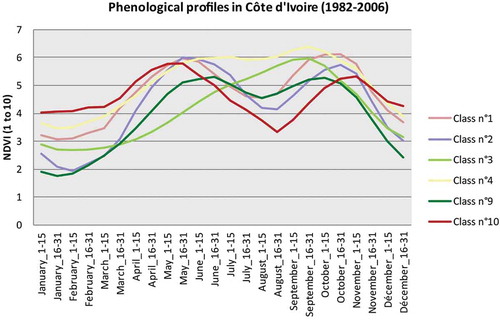
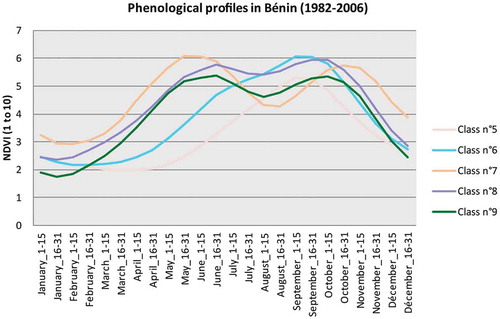
Figure 5. Curves of NDVI seasonal cycles in 1982–2006 average for Benin.
In order to enlighten temporal decennial trends and particularly the difference between the drought and the wetter period between and after 1994 (Nicholson, Citation2005) in addition to the massive deforestation observed in this area (Barima et al., Citation2016), the mean of each 15-day unit (1–15th January, 16–31th January etc.) has been calculated over the 1982–1994 period and over the 1995–2006 period. It creates 2 datasets for both periods of 24 NDVI mean images each. The NDVI mean of each class for each 48 NDVI mean images enabled us to draw the graphics ( and ).
The second part of data processing is a pixel-based index of the kinematics in the same two periods (1982–1994/1995–2006). It aims to create a map of the conversion from bimodal to unimodal or the opposite for each pixel. The main difference between unimodal and bimodal profiles is the NDVI slope between May and August. Indeed, between these two dates, Sudanian areas with a unimodal cycle grow as a result of increased rainfall, whereas the Guinean areas with a bimodal cycle reach their highest NDVI value in May and subsequently decrease due to lower rainfall during the short rains season. Hence, the NDVI slope is negative for bimodal vegetation entering the short dry season and positive for unimodal vegetation entering the rainy season. Therefore, the index is produced by calculating the image differencing between the value of NDVI in the second fortnight of May and the second fortnight of August. A very simple substraction of these two images is the first image processing. The image is then classified into two distinct classes according to the positive or negative gradient between these two dates, with a threshold at 0, thus distinguishing the Guinean bimodal cycle from the Sudanian unimodal cycle by this simple means ().
Results
Mapping of the savanna–forest transition in 1982–2006 average
shows first the 10 regions whose profiles ( and ) follow a gradient from southwest to northeast. The profile of class 10, which covers a strip in the southwest, is characteristic of the sub-evergreen and bimodal Guinean environment. Indeed, it is possible to see that the NDVI is high during the dry season, rises again from February to May, falls slightly until July, rises again until November and falls slowly until February. Class 7, on the southeast strip, is very similar in terms of phenology, with lower NDVI values from November to May and higher from June to October.
Classes 1 and 2, north of class 10, are very similar to class 7 apart from some slight differences:
For class 1 (west), NDVI values in the dry season are a little higher and resumption is faster in the second rainy season.
For class 2 (center), NDVI values in the dry season are lower.
Class 9 forms a discontinued strip on the northern limit of classes 7 and 2, from southeast of Benin to northeast of Côte d’Ivoire. NDVI values there are lower than in the classes described above throughout the year, except during the short rains. This means that the bimodal rhythm is starting to slowly fade and that Sudanian influences are beginning to be felt.
Class 4, west in our zone of study, north of class 1, is characterized by globally high NDVI values yet with a bimodal rhythm which is also slightly less marked.
Class 8 lies at the same latitude, but further east, and its phenological rhythm is very similar to that of class 9, yet very slightly higher for the whole year. It can also be interpreted as similar to class 9 but with denser vegetation.
All these regions have either a well-marked bimodal rhythm (1, 2, 7 and 10) or one slightly less marked (4, 8 and 9). The profile of the three latter classes could be interpreted as the signal of the vegetation of the Sudanian–Guinean climate’s tropical dry forest and the beginning of the ecotone toward savannas.
Class 3, in the northwest, has a unimodal profile, with a season of vegetative activity beginning early and lasting a long time, and with the highest NDVI values.
Class 6, northeast of the latter, also has a vegetative activity with a unimodal rhythm, such activity being lower during the dry season, and whose season of high photosynthetic activity starts later and ends earlier than that of class 3.
Class 5, on the far northeast end of the zone of study, is absent from Côte d’Ivoire and, in Benin, concerns only the border with Niger and is characterized by very low values reaching a minimum in May, with a very short season of vegetative activity with a rather modest maximum.
Therefore, the dichotomy between unimodal and bimodal rhythms (taking into account an ecotone) appears to be confirmed for the series’ mean values (1982–2006), thus validating the first methodological hypothesis. The distinction of seven Guinean regions with a bimodal rhythm and three Sudanian regions with a unimodal rhythm draws a limit following a line going from the center-north of Côte d’Ivoire to the north of Benin.
Study of the phenological kinematics before and after 1995
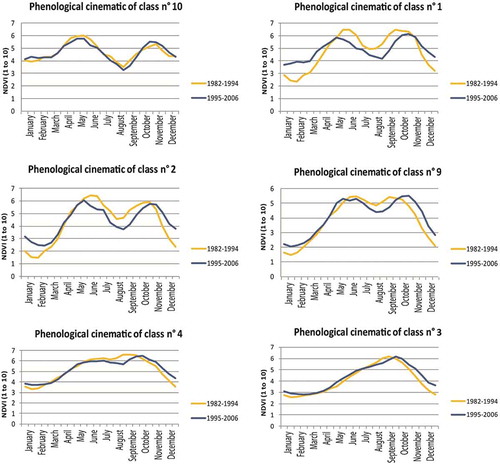
As far as phenological kinematics is concerned, class 10 can be considered as perfectly stable in Côte d’Ivoire. The curves of classes 1, 2, 4 and 9 remain bimodal during the two periods between 1995 and 2006:
a tendency toward weaker seasonal contrasts shown by higher values for the dry season; significantly higher for classes 1 and 2 and slightly higher for classes 4 and 9;
a tendency toward a slowdown of the photosynthetic activity, more marked for the short dry season;
a lateness of the second season of photosynthetic activity.
Class 3, which is unimodal in both periods, shows between 1995 and 2006, and as compared with 1982–1994:
an earlier and stronger increase of NDVI
an inflexion of growth in July
a resumption in September.
So, class 3 shows a minute inflexion toward a bimodal rhythm. It is possible to note that the maximum occurs with the same gap as that observed for the second season of photosynthetic activity (classes 1, 2, 4 and 9).
No class in Côte d’Ivoire shows a change from a forest bimodal character to a savanna unimodal character (). No class shows a decline of the bimodal rhythm toward a profile which is more similar to the one observed for Sudanian savannas. On the other hand, class 3 (the only unimodal class in the entire series from 1982 to 2006) shows a minute inflexion toward a bimodal rhythm.
Figure 6. Graphs comparing the vegetative cycle of the Côte d’Ivoire six classes from 1982 to 1994 and from 1995 to 2006.
In Benin, one notes greater stability between the two periods, with for the six classes, higher NDVI values in the dry season for the recent period and a slightly longer season with a slightly earlier or similar start and a later end (). Like in Côte d’Ivoire, the peak of NDVI values for unimodal classes (5 and 6) and the second peak for bimodal classes (6, 7 and 9) are delayed by 15 days in the recent period (1995–2006).
Figure 7. Graphs comparing the vegetative cycle of Benin six classes from 1982 to 1994 and from 1995 to 2006.
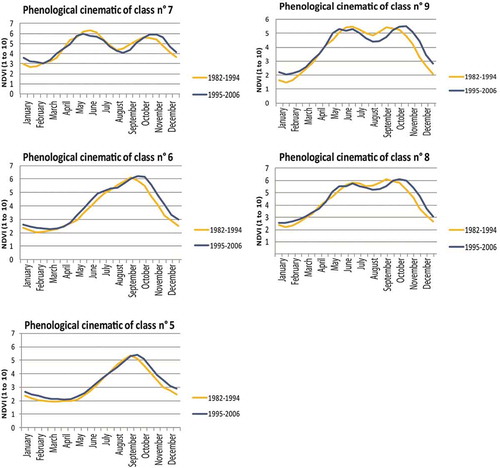
Class 6 in Benin, like class 3 in Côte d’Ivoire, shows a slight modification of the NDVI increase with the appearance of a change of gradient which may indicate a tendency toward a cycle which is more similar to Guinean bimodality.
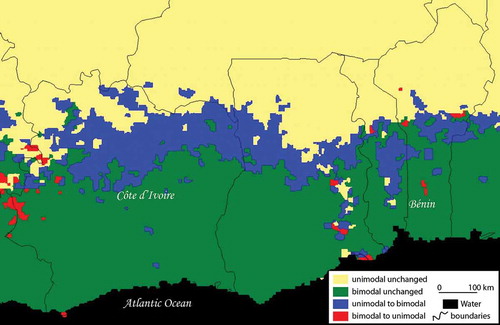
shows the kinematics of vegetative cycles in pixels. It is possible to observe a longitudinal strip characterized by the change from the unimodal savanna rhythm to a bimodal forest rhythm. It accounts for 14.4% of pixels (). One also sees a scattering of pixels essentially concentrated on the northwestern border of Côte d’Ivoire, characterized by regressive kinematics, i.e. by a change from a bimodal rhythm to a unimodal rhythm. It only accounts for 2.3% of pixels.
Table 1. Transition matrix (% of the study area).
Figure 8. Map of the kinematics of NDVI seasonal cycles before and after 1994.
Discussion
A return to wetter conditions
Studies based on NDVI temporal series in Africa affirm that the primary factor explaining NDVI variations is climate related, whether these studies are exploring climate–vegetation relations (Camberlin et al., Citation2007) or on the contrary trying to read human interference through a signal which is first explained by climate (Box, Holben, & Kalb, Citation1989; Leprieur, Kerr, & Pichon, Citation1996; Nicholson, Davenport, & Malo, Citation1990; Townshend & Justice, Citation1986).
The regreening dynamics in west Africa has often been observed in Sahelian latitudes (Herrmann et al., Citation2005) and has been explained by a return to wetter conditions (Nicholson, Citation2005). In this paper, it has been possible to confirm that what was observed in Sahel or in the Sahelian–Sudanian transition can be associated with a very similar, yet not strongly marked, phenomenon in the Sudanian–Guinean transition between forest and savanna.
Boschetti et al. (Citation2013) have detected hotspots in the whole of West Africa, where the evolution of NDVI was not well correlated with the evolution of rainfall. Thus, a large strip linking the center of Côte d’Ivoire to the north of Benin had been mapped as a hotspot of positive residues insofar as regreening there is higher than could be modeled with climate changes. Therefore, the transition between vegetation with a bimodal rhythm and that with a unimodal rhythm mapped here has indeed already been mapped as a regreening sector, with the additional information that this regreening process is superior to what is expected from a model based on increased rainfall.
Limits of the phenological approach
Although the study carried out by Boschetti et al. (Citation2013) seems to confirm our results, the phenological approach is a sectorial approach of the vegetation cover’s complexity via the physiology of vegetation. It cannot be expected to perceive with accuracy slight differences in the vegetation, either botanical (disappearance or appearance of species) or physiognomical (decrease or increase of the density of certain strata). However, it seems to have shown here, with great facility, the main physiological features of the vegetation in that part of West Africa. It should be recalled that the vegetation’s physiological functioning cannot be linked to a flora or physiognomy change without carrying out an in-depth field survey. The vegetation has the capacity to adapt to an environmental change which may be temporary, have or not an impact on the distribution of species or even the vegetation cover’s density, whilst being perceptible through the analysis of phenological cycles. Therefore, the phenological kinematics described in this paper can be interpreted neither as a real conversion of savanna into forest nor as a strengthening of the woody stratum to the detriment of the herbaceous stratum. Yet, it remains the demonstration that the physiology of certain regions with Sudanian physiology has evolved following a functioning of the ecosystem going in the direction of a transition toward the physiological functioning of Guinean forests.
Comparison with field work
To complete this discussion, a comparison with studies including a part of field work is necessary as long as no other remote-sensing paper using NDVI time series has been found for this region. To start with, already in 1984, Devineau observed that the vegetation’s natural dynamics goes in the direction of savanna changing into forest and not the opposite. In several regions of forest–savanna transition in Africa, the dynamics of the transition zones are characterized by afforestation (Barima, Citation2009; Barima, Egnankou, N’Doumé, Kouamé, & Bogaert, Citation2010). Indeed, current climate conditions seem more favorable to the reforestation of this region (Servant, Citation2000). Botanical and phytosociological studies devoted to the ecotone’s structure and dynamics in various African countries also confirm these observations: in Ghana, Swaine, Hall and Lock (Citation1976); in Côte d’lvoire, Barima et al. (Citation2010), Gautier (Citation1989), Goetze, Horsch and Porembski (Citation2006) and Spichiger and Lassailly (Citation1981); in Togo, Guelly, Roussel and Guyot (Citation1993); in Nigeria, Adejuwon and Adesina (Citation1992); in Cameroon, Dounias (Citation1996), Happi Youta (Citation1998) and Letouzey (Citation1968); in the Central African Republic, Boulvert (Citation1990); and in Congo, Foresta (Citation1990) and Schwartz et al. (Citation2000).
However, opposite dynamics have been observed in certain regions of Côte d’Ivoire. A significant advance of savanna at the expense of forest has been reported in the contact area of Côte d’Ivoire’s center-west (N’guessan, Bellan, and Blasco, Citation2003) and east (Barima, Citation2009). These regions hardly appear at this scale, with this time span and this method, which is the reason why a study of the same subject using the MODIS database will be envisaged.
Acknowledgment
This project was funded by “Partenariat rénové pour la Recherche au Service du Développement de la Côte d’Ivoire” (PRESED-CI), from 2014 to 2016 under the direction of Y. S. S. Barima.
The author would also like to thank Nicole Benazeth ([email protected]) for the translation.
Disclosure statement
No potential conflict of interest was reported by the author.
Additional information
Funding
References
- Adejuwon, J.O., & Adesina, F.A. (1992). The nature and the dynamics of the forest-savanna boundary in south-western Nigeria. In P.A. Furley, J. Proctor, & J.A. Ratter (ed by), Nature and dynamics of forest-savanna boundaries (pp. 331–351). London: Chapman and Hall.
- Alexandre, F., & Génin, A., (2012). Géographie de la végétation. Modèles spatiaux, perspectives, concepts et outils. Paris: Armand Colin, Collection U-Géographie, 304 p.
- Andrieu, J., (2008) Dynamique des paysages dans les régions septentrionales des Rivières-du-Sud (Sénégal, Gambie, Guinée-Bissau) (PhD Geography). Université Paris Diderot Paris 7, 508 p.
- Anyamba, A., & Tucker, C.J. (2005). Analysis of Sahelian vegetation dynamics using NOAA-AVHRR NDVI data from 1981–2003. Journal of Arid Environments, 63, 596–614. doi:10.1016/j.jaridenv.2005.03.007
- Aubreville, A. (1950). Flore forestière soudano-guniéenne, A.O.F - Cameroun - A.E.F.Paris: Société d’éditions géographiques, maritimes et coloniales – O.R.S.T.O.M. .
- Aubréville, A. (1949). Climats. Maritimes et Coloniales, Paris: forêts et désertification de l’Afrique tropicale. Société d’Éditions Géographiques.
- Barima, Y.S.S. (2009) Dynamique, fragmentation et diversité végétale d’un paysage de transition forêt-savane dans le département de Tanda (Côte d’Ivoire) PhD Thesis, Université Libre de Bruxelles
- Barima, Y.S.S., Egnankou, W.M., N’Doumé, C.T.A., Kouamé, F.N., & Bogaert, J. (2010). Modélisation de la dynamique du paysage forestier dans la région de transition forêt- savane à l’Est de la Côte d’Ivoire. Télédétection, 9, 129–138. http://hdl.handle.net/2268/106380
- Barima, Y.S.S., Kouakou, A.T.M., Bamba, I., Sangne, Y.C., Godron, M., Andrieu, J., & Bogaert, J. (2016). Cocoa crops are destroying the forest reserves of the classified forest of haut-sassandra (ivory coast). Global Ecology and Conservation, 8, 85–98. doi:10.1016/j.gecco.2016.08.009
- Beck, H.E., McVicar, T.R., Van Dijk, A.I.J.M., Schellekens, J., Richard, J., De Jeu, A.M., & Bruijnzeel, L.A. (2011). Global evaluation of four AVHRR–NDVI data sets: Intercomparison and assessment against landsat imagery. Remote Sensing of Environment, 115, 2547–2563. doi:10.1016/j.rse.2011.05.012
- Boschetti, M., Nutini, F., Brivio, P.A., Bartholomé, E., Stroppiana, D., & Hoscilo, A. (2013). Identification of environmental anomaly hot spots in West Africa from time series of NDVI and rainfall. Journal of Photogrammetry and Remote Sensing, 78, 26–40. doi:10.1016/j.isprsjprs.2013.01.003
- Boulvert, Y. (1990). Avancée ou recul de la forêt centrafricaine, changements climatiques, influence de l’Homme et notamment des feux. Paysages Quaternaires de l’Afrique Centrale Atlantique (pp. 353–366). (R. Lanfranchi & D. Schwartz, ed by). Paris: ORSTOM, Collection Didactiques.
- Box, E.O., Holben, B.N., & Kalb, V. (1989). Accuracy of the AVHRR vegetation index as a predictor of biomass, primary productivity and net CO2 flux. Vegetatio, 80, 71–89. doi:10.1007/BF00048034
- Camberlin, P., Martiny, N., Philippon, N., & Richard, Y. (2007). Determinants of the interannual relationships between remote sensed photosynthetic activity and rainfall in tropical Africa. Remote Sensing of Environment, 106, 199–216. doi:10.1016/j.rse.2006.08.009
- Dai, A., Lamb, P.-J., Treberth, K., Hulme, M., Jones, P.D., & Xie, P. (2005). The recent Sahel Drought is real. International Journal of Climatology, 24, 1323–1331. http://onlinelibrary.wiley.com/doi/10.1002/joc.1083/full
- Dardel, C., Kergoat, L., Hiernaux, P., Mougin, E., Grippa, M., & Tucker, C.J. (2014). Re-greening Sahel: 30years of remote sensing data and field observations (Mali, Niger). Remote Sensing of Environment, 140(January), 350–364. doi:10.1016/j.rse.2013.09.011
- Deronde, B., Debruyn, W., Gontier, E., Goor, E., Jacobs, T., Verbeiren, S., & Vereecken, J. (2014). 15 years of processing and dissemination of SPOT-VEGETATION products. International Journal of Remote Sensing, 35, 2402–2420. doi:10.1080/01431161.2014.883102
- Diday, E. (1971). Une nouvelle méthode de classification automatique et reconnaissance des formes: La méthode des nuées dynamiques. Revue De Statistiques Appliqués, 19, 19–33. https://eudml.org/doc/105908
- Dounias, E. (1996). Recrûs forestiers post-agricoles: Perceptions et usages chez les Mvae du Sud-Cameroun. Journal d’Agriculture Traditionnelle Et De Botanique Appliquée, 38, 153–178. doi:10.3406/jatba.1996.3592
- Eckert, S., Hüsler, F., Liniger, H., & Hodel, E. (2015). Trend analysis of MODIS NDVI time series for detecting land degradation and regeneration in Mongolia. Journal of Arid Environments, 113, 16–28. doi:10.1016/j.jaridenv.2014.09.001
- FAO. (2008). Les conflits armés, cause principale des crises alimentaires dans le monde. Rome, Italie: Author.
- Fensholt, R., Rasmussen, K., Nielsen, T.T., & Mbow, C. (2009). Evaluation of earth observation based long term vegetation trends — Intercomparing NDVI time series trend analysis consistency of Sahel from AVHRR GIMMS, Terra MODIS and SPOT VGT data. Remote Sensing of Environment, 113, 1886–1898. doi:10.1016/j.rse.2009.04.004
- Foresta, H. (1990). Origine et évolution des savanes intramayombiennes (R.P. du Congo): Apports de la botanique forestière. In R. Lanfranchi & D. Schwartz (ed by), Paysages quaternaires de l’Afrique centrale atlantique (pp. 326–335). Paris: ORSTOM, Collection Didactiques.
- Gao, Q., Zhu, W., Schwartz, M.W., Ganjurjav, H., Wan, Y., Qin, X., … Li, Y. (2016). Climatic change controls productivity variation in global grasslands. Scientific Reports, 6, 26958. doi:10.1038/srep26958
- Gautier, L. (1989). Forest-savanna boundary in central ivory-coast: Evolution of forest surface of the Lamto reserve (South of V-Baoulé). Soc botanique France, 136, 85–92.
- Gessner, U., Machwitz, M., Esch, T., Tillack, A., Naeimi, V., Kuenzer, C., & Dech, S. (2015, July). Multi-sensor mapping of West African land cover using MODIS, ASAR and TanDEM-X/TerraSAR-X data. Remote Sensing of Environment, 164, 282–297. doi:10.1016/j.rse.2015.03.029
- Godron, M. (1984). Ecologie de la végétation terrestre. Paris: Masson, Collection Abrégés.
- Goetze, D., Horsch, B., & Porembski, S. (2006). Dynamics of forest-savanna mosaics in north- eastern Ivory Coast from 1954 to 2002. Journal of Biogeography, 33, 653–664. doi:10.1111/j.1365-2699.2005.01312.x/pdf
- Guelly, K.A., Roussel, B., & Guyot, M. (1993). Installation d’un couvert forestier dans les jachères de savanes au Sud-Ouest Togo. Bois Et Forêts Des Tropiques, 235, 37–48.
- Guillaumet, J.L., & Adjanohoun, E. (1971). La végétation de la Côte d’Ivoire, In Avenard, J.M., Eldin, M., Girard, G., Sircoulon, J., Touchebeuf, P., Guillaumet, J.-L., Adjanohoun, E., et Perraud, A. (Eds.), Le milieu naturel de la Côte d’Ivoire (pp. 155–261). Paris: Mémoires O.R.S.T.O.M.
- Happi Youta, J. (1998) Arbres contre graminée: La lente invasion de la savane par la forêt au Centre-Cameroun. PhD Thesis, Université de Paris-Sorbonne, Paris.
- Herrmann, S.M., Anyamba, A., & Tucker, C.J. (2005). Recent trends in vegetation dynamics in the African Sahel and their relationship to climate. Global Environmental Change, 15, 394–404. doi:10.1016/j.gloenvcha.2005.08.004
- Heumann, B.W., Seaquist, J.W., Eklundh, L., & Jonsson, P. (2007). AVHRR derived phenological change in the Sahel and Soudan, Africa, 1982-2005. Remote Sensing of Environment, 108, 385–392. doi:10.1016/j.rse.2006.11.025
- Hmimina, G., Dufrêne, E., Pontailler, J.-Y., Delpierre, N., Aubinet, M., Caquet, B., … Soudani, K. (2013). Evaluation of the potential of MODIS satellite data to predict vegetation phenology in different biomes: An investigation using ground-based NDVI measurements. Remote Sensing of Environment, 132, 145–158. doi:10.1016/j.rse.2013.01.010
- Hulme, M., Doherty, R., Ngara, T., New, M., & Lister, D. (2001). African climate change: 1900-2100. Climate Research, 17, 145–168. doi:10.3354/cr017145
- Hutchinson, J.M.S., Jacquin, A., Hutchinson, S.L., & Verbesselt, J. (2015). Monitoring vegetation change and dynamics on U.S. Army training lands using satellite image time series analysis. Journal of Environmental Management, 150, 355–366. doi:10.1016/j.jenvman.2014.08.002
- Jacquin, A., Sheeren, D., & Lacombe, J.P. (2010). Vegetation cover degradation assessment in Madagascar savanna based on trend analysis of MODIS NDVI time series. International Journal of Applied Earth Observation and Geoinformation, 12, 3–10. doi:10.1016/j.jag.2009.11.004
- Jakubauskas, M.E., Legates, D.R., & Kastens, J.H. (2002). Crop identification using harmonic analysis of time-series AVHRR NDVI data. Computers and Electronics in Agriculture, 37, 127–139. doi:10.1016/S0168-1699(02)00116-3
- Jamali, S., Seaquist, J., Eklundh, L., & Ardö, J. (2014). Automated mapping of vegetation trends with polynomials using NDVI imagery over the Sahel. Remote Sensing of Environment, 141, 79–89. doi:10.1016/j.rse.2013.10.019
- Korateng, A., Zawila-Niedzwiecki, T., & Adu-Poku, I. (2016). Remote sensing study of land use/Land cover in west Africa. Journal of Environment Protection and Sustainable Development, 2(3), 17–31.
- Kouassi, A.M., Kouamé, K.F., Koffi, Y.B., Dje, K.B., Paturel, J.-E., & 1 Oulare, S. (2010). Analyse de la variabilité climatique et de ses influences sur les régimes pluviométriques saisonniers en Afrique de l’Ouest: Cas du bassin versant du N’zi (Bandama) en Côte d’Ivoire, Cybergeo. European Journal of Geography, 513. doi:10.4000/cybergeo.23388
- Leprieur, C., Kerr, Y.H., & Pichon, J.M. (1996). Critical assessment of vegetation indices from AVHRR in a semi-arid environment. International Journal of Remote Sensing, 17, 2549–2563. doi:10.1080/01431169608949092
- Letouzey, R. (1968). Etude phytogéographique du Cameroun. Paris: Editions Paul Lechevalier.
- Lhermitte, S., Verbesselt, J., Jonckheere, I., Nackaerts, K., Van Aardt, J.A.N., Verstraeten, W.W., & Coppin, P. (2008). Hierarchical image segmentation based on similarity of NDVI time series. Remote Sensing of Environment, 112, 506–521. doi:10.1016/j.rse.2007.05.018
- Li, J., Lewisa, J., Rowlandb, J., Tappan, G., & Tieszen, L.L. (2004). Evaluation of land performance in Senegal using multi-temporal NDVI and rainfall series. Journal of Arid Environments, 59, 463–480. doi:10.1016/j.jaridenv.2004.03.019
- Liu, W.T., & Kogan, F.N. (1996). Monitoring regional drought using the Vegetation Condition Index. International Journal of Remote Sensing, 17(Issue 14), 1996. doi:10.1080/01431169608949106
- Lu, L., Kuenzer, C., Wang, C., Guo, H., & Li, Q. (2015). Evaluation of three MODIS-derived vegetation index time series for dryland vegetation dynamics monitoring. Remote Sens, 7, 7597–7614. doi:10.3390/rs70607597
- Mbow, C., Fensholt, R., Nielsen, T.T., & Rasmussen, K. (2014). Advances in monitoring vegetation and land use dynamics in the Sahel. Journal of Geography, 114, 84–91. doi:10.1080/00167223.2014.886515
- N’Guessan, K.E., Bellan, M.F., & Blasco, F. (2003). Suivi par télédétection spatiale d’une forêt tropicale humide protégée soumise à des pressions anthropiques. Télédétection, 3(5), 443–456.
- Nicholson, S. (2001). Climatic and environmental change in Africa during the last two centuries. Climate Research, 17, 123–144. doi:10.3354/cr017123
- Nicholson, S. (2005). On the question of the “recovery” of the rains in the West African Sahel. Journal of Arid Environments, 63, 615–641. doi:10.1016/j.jaridenv.2005.03.004
- Nicholson, S.E., Tucker, C.J., & Ba, M.B. (1998). Desertification, drought, and surface vegetation: An example from the west african sahel. Bulletin of the American Meteorological Society, 79, 815–829. doi:10.1175/1520-0477(1998)079<0815:ddasva>2.0.CO;2
- Nicholson, S.E., Davenport, M.L., & Malo, A.R. (1990). A comparison of the vegetation response to rainfall in the Sahel and East Africa, using normalized difference vegetation Index from NOAA AVHRR. Climatic Change, 17, 209–241. doi:10.1007/BF00138369
- Noormets, A. (2009). Phenology of ecosystem processes: applications in global change research. Earth and Environmental Science Springer Science & Business Media, ISBN, 1441900268(9781441900265), 275.
- Omuto, C.T., Vargas, R.R., Alim, M.S., & Paron, P. (2010). Mixed-effects modelling of time series NDVI-rainfall relationship for detecting human-induced loss of vegetation cover in drylands. Journal of Arid Environments, 74, 1552–1563. doi:10.1016/j.jaridenv.2010.04.001
- Pervez, M.S., & Brown, J.F. (2010). Mapping irrigated lands at 250-m scale by merging MODIS data and national agricultural statistics. Remote Sens, 2(10), 2388–2412. doi:10.3390/rs2102388
- Richard, J.-F. (1990). La dégradation des paysages en Afrique de l’Ouest (pp. 313). Dakar: Université Cheikh Anta Diop.
- Schwartz, D., Elenga, H., Vincens, A., Bertaux, J., Mariotti, A., Achoundong, G., … Youta Happi, J. (2000). Origine et évolution des savanes des marges forestières en Afrique Centrale Atlantique (Cameroun, Gabon, Congo): Approche au échelles millénaires et séculaires. In M. Servant & S. Servant-Vildary (ed by), Dynamique à long terme des écosystèmes forestiers intertropicaux (pp. 325–338). Paris: UNESCO.
- Servant, M. (2000). Diversité actuelle de la forêt tropicale et changements passés du climat: Le programme écosystèmes et paléoécosystèmes des forêts Intertropicales (ecofit). Bilan et perspectives. In M. Servant & S. Servant-Vildary (ed by), Dynamique à long terme des écosystèmes forestiers intertropicaux (pp. 13–18). Paris: UNESCO.
- Spichiger, R., & Lassailly, V. (1981). Recherches sur le contact forêt-savane en Côte d’Ivoire: Note sur l’évolution de la végétation dans la région de Béoumi (Côte d’Ivoire centrale). Candollea, 36, 145–153.
- Swaine, M.D., Hall, J.B., & Lock, J.M. (1976). The forest-savanna boundary in West-Central Ghana. Ghana Journal of Sciences, 16, 35–52.
- Townshend, J.R.G., & Justice, C.O. (1986). Analysis of the dynamics of African vegetation using the NDVI. International Journal of Remote Sensing, 7, 1435–1446. doi:10.1080/01431168608948946
- Tucker, C.J., Pinzon, J.E., Brown, M.E., Slayback, D.A., Pak, E.W., Mahoney, R., … Saleous, N.E. (2005). An extended AVHRR 8-km NDVI dataset compatible with MODIS and SPOT vegetation NDVI data. International Journal of Remote Sensing, 26, 4485−4498. http://www.tandfonline.com/doi/citedby/10.1080/01431160500168686?scroll=top&needAccess=true
- Vrieling, A., De Beurs, K.M., & Brown, M.E. (2011). Variability of African farming systems from phenological analysis of NDVI time series. Climatic Change, 109(Issue 3–4), 455–477. doi:10.1007/s10584-011-0049-1
- White, F. (1986). La végétation de l’Afrique. Paris: UNESCO.
- White, M.A., De Beurs, K.M., Didan, K., Inouye, D.W., Richardson, A.D., Jensen, O.P., … Lauenroth, W.K. (2009). Intercomparison, interpretation, and assessment of spring phenology in North America estimated from remote sensing for 1982–2006. Global Change Biol, 15, 2335–2359. doi:10.1111/j.1365-2486.2009.01910.x
- Wouter, D., Sindy, S., Iskander, B., Geert, D., Tanja, V.A., Karim, ... Gilbert, S. (2015). Proba-v mission for global vegetation monitoring: Standard products and image quality. International Journal of Remote Sensing, 35 (7). doi:10.1080/01431161.2014.883097
- Xu, C., Li, Y., Hu, J., et al. (2012). Evaluating the difference between the normalized difference vegetation index and net primary productivity as the indicators of vegetation vigor assessment at landscape scale. Environ Monit Assess, 184, 1275. doi:10.1007/s10661-011-2039-1
- Zhang, J., Zhang, L., Xu, C., Liu, W., Qi, Y., & Wo, X. (2014). Vegetation variation of mid-subtropical forest based on MODIS NDVI data — A case study of Jinggangshan City, Jiangxi Province. Acta Ecologica Sinica, 34, 7–12. doi:10.1016/j.chnaes.2013.09.005