
 ?Mathematical formulae have been encoded as MathML and are displayed in this HTML version using MathJax in order to improve their display. Uncheck the box to turn MathJax off. This feature requires Javascript. Click on a formula to zoom.
ABSTRACT
The rich spectral data found in the hyperspectral data cube make them useful in real-world applications, such as target detection. Target pixels detection among an unknown background such as ground objects from hyperspectral data cube is of great interest for remote sensing community. The commonly used hyperspectral target detection methods often overlook the problem of prior knowledge of the target and could reduce the efficiency of these methods. It has to be noted that the spatial resolution of the hyperspectral data cube is usually limited; therefore, the sub-pixel targets only occupy part of the pixel. The replacement signal model is an essential model for sub-pixel targets. In this study, we developed a revised replacement signal model based on an automatic target generation procedure for improving hyperspectral sub-pixel target detection using the HyMap data cube. The effects of various real targets on hyperspectral data cube are evaluated to obtain consistent results. In experiments with seven targets, the proposed method achieves the average area under the ROC curve of 99%. Comparison results illustrated that the proposed method has competitive target detection performance in comparison with other state-of-the-art methods.
Introduction
Airborne or spaceborne hyperspectral imaging sensors provide remote sensing image cubes from the reflected solar radiation from the Earth’s surface (Bingwen et al., Citation2013; Borengasser et al., Citation2007; Zhang & Du, Citation2012). A hyperspectral image cube contains very narrow bands covering from the visible spectrum through the infrared spectrum (Bakhshi et al., Citation2019). The rich spectral data found in hyperspectral images makes them useful in real-world applications, such as land-cover classification (Zomer et al., Citation2009), anomaly detection (Li & Du, Citation2015), change detection (Hasanlou & Seydi, Citation2018; Seydi et al., Citation2020) and target detection (Chang, Citation2016; Wei & Xuchu, Citation2006). Considering these applications, target detection is an important field of hyperspectral remote sensing (Anderson et al., Citation2019). Target detection in hyperspectral data is the identification of known object spectral signature within pixel spectra from a hyperspectral image (Basener et al., Citation2017). Due to the spectral mixture between objects in the hyperspectral image, target detection is an extremely difficult issue (Nasrabadi, Citation2014; Wang et al., Citation2020).
Pre-processing, target map generation, and evaluation are the three main stages for target detection. Among these stages, the way the target map is generated is the most crucial issue for any target detection studies (Sun et al., Citation2017). To solve this problem, different methods have been proposed in recent years. Traditional methods in target detection have been studied based on the linear unmixing model (Hsuan Ren et al., Citation2003), including maximum likelihood (Settle, Citation1996), subspace projection (Schowengerdt, Citation1997), and singular value decomposition (Boardman, Citation1989). The linear unmixing approaches require the deep knowledge of the endmember signatures. Generally, an endmember is defined as the pure signature of an object. In practical experiences obtaining such knowledge of the endmember signatures may not be possible (Demirci et al., Citation2014). Moreover, there are four main categories of target detection approaches, including spectral angle mapper (also known as SAM) (Richards & Jia, Citation2006), matched filter (also known as MF) (Manolakis & Shaw, Citation2002), adaptive cosine estimator (also known as ACE) (Kraut et al., Citation2005), and constrained energy minimization (also known as CEM) (Settle, Citation1996). SAM is the simplest target detection method, which is based on spectral similarity and measures the angle between known object spectra and the observed pixel spectra. SAM is limited by the assumption of a zero-mean which is an unrealistic assumption for target detection (Jha & Nidamanuri, Citation2020; Kruse et al., Citation1993). Unlike the previous approach, MF is obtained by correlating a known object spectrum, with an unknown object spectra (Jin et al., Citation2009). Unlike the MF which assumes ambient noise to be additive, ACE is generated from the generalized likelihood ratio test, which incorporated a substitution model for ambient (Kraut et al., Citation2005). CEM method suppresses the interference of undesired objects in the received signal, thereby accentuating the target. The CEM method requires only the knowledge of specific targets of interest. Due to the CEM method is very sensitive to noise, it is not a robust classifier for the same type of targets (Johnson, Citation2003). To remedy this drawback, three target detection methods have been proposed based on the CEM method, including sum CEM, winner-take-all CEM, and multiple-target CEM (Hsuan Ren et al., Citation2003). Considering these developed methods, winner-take-all CEM usually gives the best performance (Chang, Citation2013).
The investigation of previous studies proves that there are still key challenges for hyperspectral target detection. The main challenges are as follows:
(1) Sub-pixel detection. The spectral mixture between objects without prior knowledge which has not yet been considered well in the relevant studies. It is worth mentioning that the spatial resolution of hyperspectral images is usually limited, so the sub-pixel targets only occupy the pixel partially (B. Du et al., Citation2010). In this regard, the one-step generalized likelihood ratio test has recently been extended for sub-pixel target detection based on the replacement signal model (Besson & Vincent, Citation2020). The sub-pixel target detection is important in many applications, such as battleground reconnaissance (Kumar & Ghosh, Citation2017), monitoring of mineral material (Myers et al., Citation2019), and so on.
(2) Complex background. Complex background modeling for target detection is an important problem for hyperspectral data processing in complex environments (Eismann, Citation2006).
(3) Multiple signatures. Poor performance due to the lack of a robust mathematical model in pure and mixed pixels that are composed of multiple signatures (e.g. pickup truck) (Vincent & Besson, Citation2020).
The main purpose of this paper is to establish a robust approach to sub-pixel target detection based on revising the replacement signal model using a hyperspectral image in a complex background. It has to be noted that the replacement signal model is an important model for sub-pixel targets in hyperspectral data. The contributions of this study are as follows.
(1) The proposed a revised replacement signal model based on the automatic target generation procedure method for unsupervised target endmember extraction.
(2) A comprehensive assessment is presented based on state-of-the-art target detection methods. Consequently, the proposed revised replacement signal model surpasses the state-of-the-art methods for different target detection tasks.
(3) The proposed a simple and effective pre-processing step based on the quick atmospheric correction method for target detection enhancement.
(4) To obtain consistent results, the effects of various real targets on hyperspectral data cube are evaluated.
The manuscript is organized as follows. In Section 2, we introduce the dataset for the experimental study. In Section 3, we introduce the structure of the proposed method. Furthermore, Section 4 presents some experimental results and discussions to evaluate the performance of the proposed method. Finally, Section 5 provides the conclusion of this study.
Hyperspectral image dataset
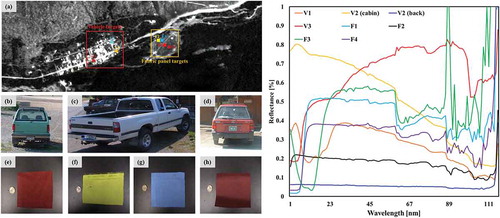
In this study, the hyperspectral image with coverage areas of approximately 2.0 km2 in Cooke City town, MT, USA is used as the experimental data. It was provided via the HyMap airborne hyperspectral imaging sensor by Snyder et al. (Citation2008). HyMap sensor flown at 1.4 km above the ground level. The Cooke City dataset is illustrated in , where there are 280 × 800 pixels. Each pixel is observed at 126 bands covering the electromagnetic spectra from 0.45 to 2.48 μm and the ground sample distance is 3.0 m. In our experiments, the three vehicles () and four fabric panels () in different sizes and colors were selected as targets. The reference spectra of the vehicles and the fabric panels were measured by an Analytical Spectral Devices, Inc. FieldSpec Pro, and a Cary 500 spectrophotometer, respectively (Snyder et al., Citation2008). The vehicles were occupied at most a few pixels, but fabric panels F1 and F2 were nearly a full pixel while fabric panels F3 and F4 were occupied less than a pixel. The Cooke City dataset is still a challenging dataset for hyperspectral target detection (Yang et al., Citation2020). All related datasets can be found in https://rslab.ut.ac.ir.
Figure 1. Cooke City dataset with target locations identified by the color squares (left). Plots showing the reference spectra of targets (right). The greyscale image (a), and the targets (b-h)
Proposed method
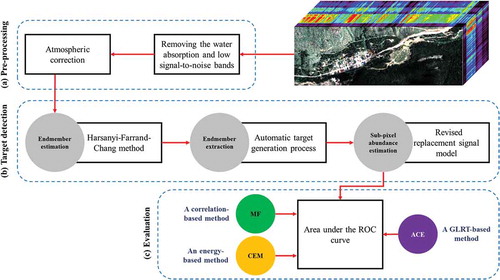
In this study, we developed a revised replacement signal model based on the automatic target generation procedure for hyperspectral sub-pixel target detection using the Cooke City dataset. The proposed method is composed of two effective concepts of the automatic target generation procedure for endmember extraction and the replacement signal model that extracts the sub-pixel target. The proposed method for sub-pixel target detection is presented in . As shown in , the proposed method for sub-pixel target detection is made up of three stages: (a) pre-processing, (b) target detection, and (c) evaluation.
Figure 2. Overview of the proposed method
Pre-processing
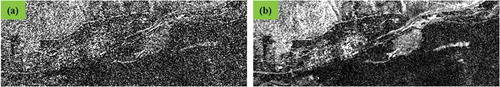
At first, the water absorption and low signal-to-noise bands were identified and removed from the Cooke City dataset for further processing. As shown in , 10 bands, namely bands 1, 2, 3, 63, 64, 65, 66, 95, 96, and 97, contained the water absorption and low signal-to-noise bands and therefore were discarded (Heiden et al., Citation2001). After removing the water absorption and low signal-to-noise bands, 116 bands were retained.
Figure 3. Examples of the greyscale images for bad band 63 (a), and 64 (b)
Atmospheric correction is an important pre-processing step to remove the atmospheric and solar radiation effect on the recorded data and to derive the spectral reflectance signature of the ground level. The spectral unmixing performance can also be affected by the problem of atmospheric correction. Therefore, atmospheric correction is an essential pre-processing step in many spectral unmixing tasks.
The Quick Atmospheric Correction (QUAC) method is a semi-empirical atmospheric correction method for hyperspectral data cube in the visible spectrum through the shortwave infrared spectrum (Carr et al., Citation2015). Unlike other first-principles radiation transport algorithms, e.g. Fast Line-of-sight Atmospheric Analysis of Spectral Hypercubes (also known as FLAASH), the QUAC method determines atmospheric compensation parameters directly from the observed pixel spectra, without using ancillary data. QUAC supports hyperspectral sensors, such as HyMap airborne hyperspectral image. The key QUAC assumption, which empirically holds for most scenes, is the consistency of the average of the endmember reflectance spectra, which are not highly structured, is always the same (Bernstein et al., Citation2012).
Target detection
Endmember estimation
To estimate the number of distinct endmembers in the hyperspectral data cube, the virtual dimensionality provides an estimate of the initial target endmembers. To determine the virtual dimensionality, the “Harsanyi-Farrand-Chang” (also known as HFC) approach based on the “Neyman-Pearson” detection theory is an effective method (Chang & Du, Citation2004; Harsanyi et al., Citation1993). According to estimates (Cao et al., Citation2018), the selection of the initial target endmembers based on the HFC approach has a great impact on spectral unmixing. As a binary hypothesis problem, the virtual dimensionality determined by the HFC approach is q (number of endmembers). The HFC approach has an initial parameter that specified the false alarm probability. The false alarm probability is defined as follows (Gerg, Citation2008):
where is a Gaussian distribution;
is determined by selecting suitable values for
. In practice,
is set to 10−3. Another widely used endmember estimation method is the NWHFC approach (Chang & Du, Citation2004). NWHFC is a developed structure of the HFC approach, included a noise-whitening processing step (Jafarzadeh & Hasanlou, Citation2019). Due to the noise-whitening processing step in the NWHFC approach, the NWHFC does not have stable performance in the target detection task. In this regard, (Chang, Citation2017) showed that the HFC method compatible with the automatic target generation procedure for unsupervised endmember extraction.
Endmember extraction
The Automatic Target Generation Procedure (ATGP) is an unsupervised endmember extraction method in the target detection task, where can provide more accurate initial points to identify endmembers (Ren & Chang, Citation2003). Compared to conventional supervised and unsupervised endmember extraction approaches, such as the Pixel Purity Index (PPI) that require a very large number of skewers to find maximal/minimal orthogonal projections (Chang & Li, Citation2016), ATGP method requires less prior information to extract pure pixel vectors as the endmember spectrum from the hyperspectral data cube (Cao et al., Citation2018). ATGP method works by iterative orthogonal projections of the hyperspectral data cube then finding the largest magnitude vector in a sequence of orthogonal projection subspaces (Q. Du et al., Citation2008; Gerg, Citation2008). ATGP method was implemented in the four following steps (Chang et al., Citation2015):
(a) Selecting the initial target pixel vector and an error threshold:
(b) Finding p
th target: ;
(c) Stopping rule: If let
(d) When p equals to the number of the endmembers q, the ATGP is terminated.
where x is the observed pixel, is the error threshold and q is the virtual dimensionality determined by the HFC approach.
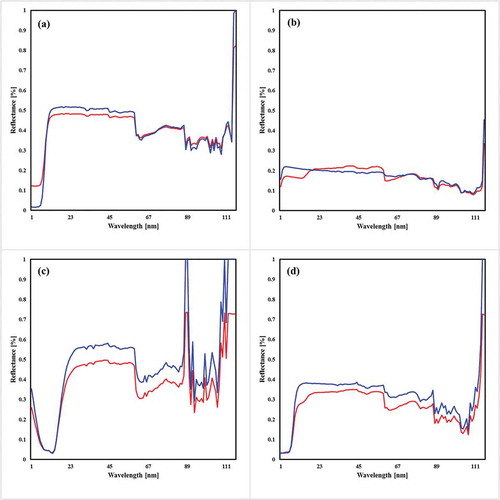
demonstrate the prediction and the reference spectral signature for targets by the proposed strategy. shows a summary of the evaluation results based on the coefficient of determination (R2) and Root Mean Square Error (RMSE). The results demonstrate that the proposed strategy provides good performance on the spectral signature prediction.
Table 1. The evaluation results for the predicted spectral signature based on the proposed strategy in the Cook City dataset. Good values for R2 and RMSE are 100%, and 0, respectively
Figure 4. Plots showing the reflectance spectra of targets. Blue spectra denote the reference signature, and red spectra denote the prediction signature of V1 (a), V2-cabin (b), V2-back (c), and V3 (d)
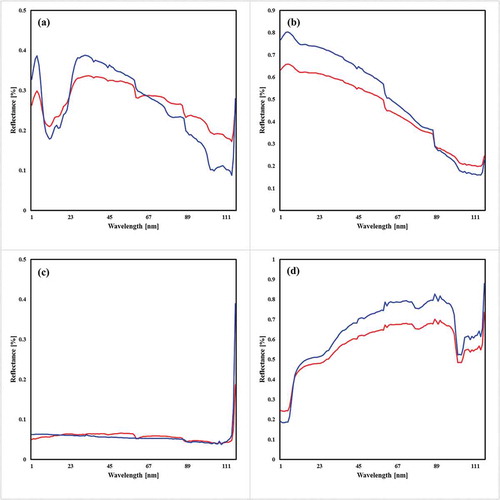
Figure 5. Plots showing the reflectance spectra of targets. Blue spectra denote the reference signature, and red spectra denote the prediction signature of F1 (a), F2 (b), F3 (c), and F4 (d)
Another widely used endmember extraction method is the vertex component analysis approach (Nascimento & Dias, Citation2005). The vertex component analysis approach is a developed structure of the ATGP method, included a sequence of successive orthogonal projection subspaces based on the maximal orthogonal projections (Tang et al., Citation2012). According to estimates (Cao et al., Citation2018), the vertex component analysis approach does not have stable performance when random initial values are used.
Sub-pixel abundance estimation
The replacement signal model is a sub-pixel target detection method based on the spectrum of the target/background and the unknown target abundance. For target detection, the replacement signal model, defined as (Manolakis et al., Citation2002):
where x is the spectral vector of the pixel under test (known as the observed pixel spectrum); is the fraction of the pixel area filled by the target;
is the spectrum of the target, and
is the spectrum of the background. The fraction of the pixel area filled by the target is the unknown target abundance (Vincent & Besson, Citation2019). In this regard, the target spectrum s is assumed to be known from the ATGP method and the generalized likelihood ratio test (known as GLRT) (Kelly, Citation1986) used for the sub-pixel abundance estimation. The revised replacement signal model based on GLRT and the spectrum of the target from the ATGP method, defined as:
where x is the observed pixel spectrum; s is the spectrum of the target from ATGP method; m is the mean; G is the background covariance matrix, and M is the total number of pixels.
According to previous studies, the spectrum of the target is known from laboratory or field spectra measurements (Vincent & Besson, Citation2020). In practical experiences, obtaining this knowledge of the target endmember’s spectrum may not be possible. In this study, we focus on tackling this problem in a hyperspectral data cube by proposing a revised replacement model based on the ATGP method for unsupervised target endmember extraction. The original replacement signal model cannot perform well due to the sum-to-one constraint in linear endmember mixing. In this regard, the revised replacement signal model is to improve the detection tasks by softening this unitary constraint based on ATGP and GLRT. As a result, the sub-pixel abundance vectors are subjected to the soft sum-to-one constraint. More precisely, our unique advantages of the proposed method over the original replacement signal model are twofold: (1) estimation of target spectrum (s) based on unmixing, and (2) soft sum-to-one constraint.
Evaluation
The performance of the revised replacement model based on the ATGP method was compared with those of three representative methods based on the literature, including winner-take-all CEM, ACE, and MF. In this study, due to the number of targets is too small to get statistical assessment; the performance evaluation is conducted based on the area under the Receiver Operating Characteristics (ROCs) and target probability map. This means that a smaller false alarms score is better. To the best of the authors’ knowledge, the false alarms score is an effective metric for hyperspectral target detection in the literature (Besson & Vincent, Citation2020; Vincent & Besson, Citation2020; Citation2019).
Results and discussions
In this section, we have quantitatively and qualitatively evaluated the performance of the revised replacement model based on the ATGP method for hyperspectral target detection. The proposed method was executed in MATLAB R2017b on a computer with Intel(R) Core(TM) i5-3320 M CPU (2.60 GHz) and 4 GB RAM. Unmixing computation time of the proposed method on the Cooke City dataset is less than 120 minutes. Moreover, detection computation time is less than 2 seconds. show the test scene and the predicted probability maps for seven different targets using the proposed approach compared with the state-of-the-art methods. Moreover, show a summary of the area under the ROC curve for different targets and methods. According to , the comparison results from the first, second, and third targets (i.e. V1, V2, and V3) show that the proposed approach can achieve the highest probability for pure pixel and mixed pixel among the state-of-the-art methods. The results of the special pixels under test (e.g. V2) demonstrate that the proposed method is robust to pure and mixed pixels that are composed of two different signatures. The proposed approach achieves the area under the ROC curve of 99.2%, 99.1%, and 99.1% for the first, second, and third targets, respectively, while the area under the ROC curve of ACE is 99.1%, 99.0%, and 99.0%. ACE is generated from the generalized likelihood ratio test and the prior information of the target, while the proposed approach is an unsupervised method. Based on , the average area under the ROC curve for vehicles is about 50.3%, 99.0%, 50.6%, and 99.1% for the winner-take-all CEM, ACE, MF, and the proposed method, respectively.
Table 2. Area under the ROC curve for vehicles. The bold values denote the best result
Table 3. Area under the ROC curve for fabric panels. The bold values denote the best result
Figure 6. Results of the first target (V1). The Probability prediction values for target pixels are defined in a range from 0% to 100%
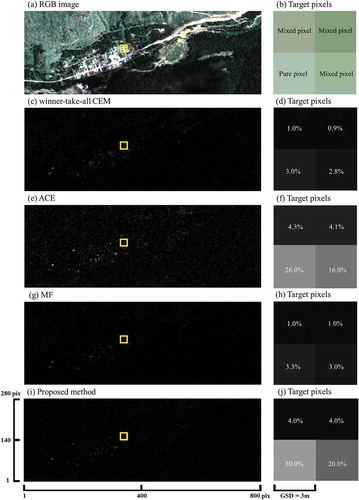
Figure 7. Results of the second target (V2). The Probability prediction values for target pixels are defined in a range from 0% to 100%
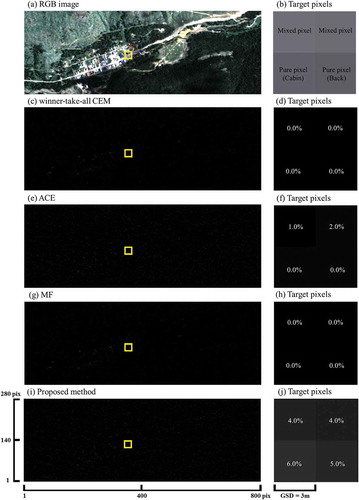
Figure 8. Results of the third target (V3). The Probability prediction values for target pixels are defined in a range from 0% to 100%
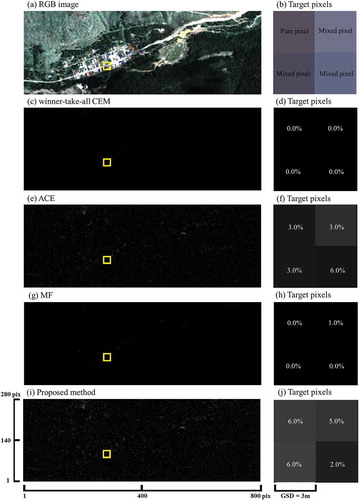
Figure 9. Results of the fourth target (F1). The Probability prediction values for target pixels are defined in a range from 0% to 100%
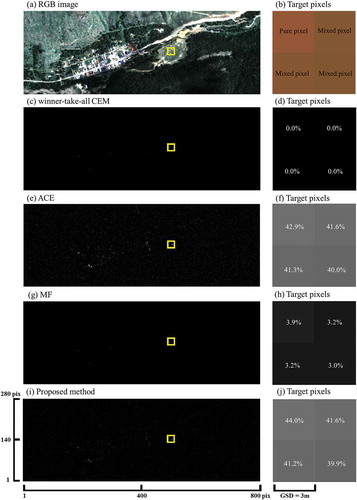
Figure 10. Results of the fifth target (F2). The Probability prediction values for target pixels are defined in a range from 0% to 100%
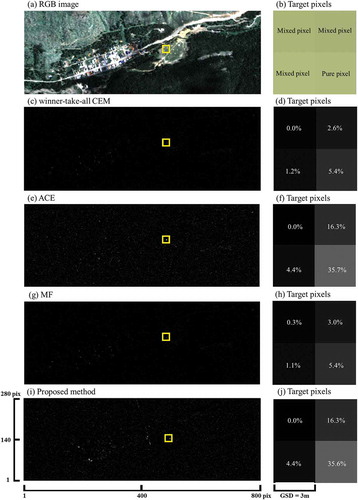
Figure 11. Results of the sixth target (F3). The Probability prediction values for target pixels are defined in a range from 0% to 100%
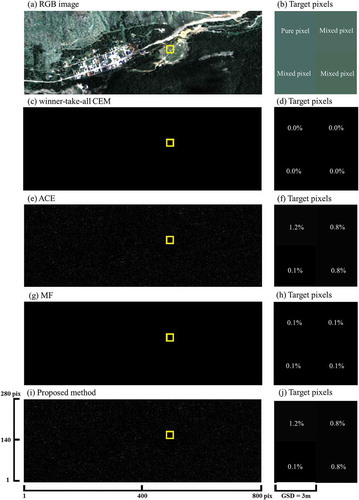
Figure 12. Results of the seventh target (F4). The Probability prediction values for target pixels are defined in a range from 0% to 100%
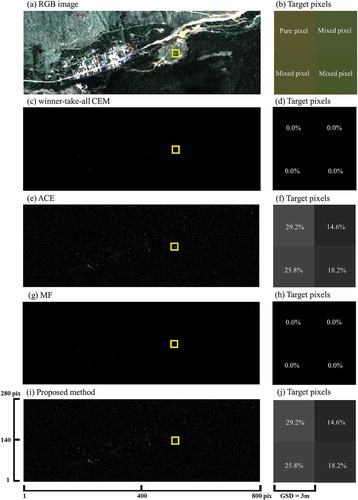
According to and , the proposed approach (–)) and ACE (–)) obtained better detection results than other methods in the fabric panels. The proposed approach and ACE achieve the average area under the ROC curve of 98.9% for the different targets, while the average area under the ROC curve of MF and CEM is 50.6%, and 50.2, respectively. MF (–)) generally performed better than CEM but still did not detect the fabric panels in the Cook City dataset. The comparison results from the fourth, fifth, sixth, and seventh targets (i.e. F1, F2, F3, and F4) show that the proposed approach can achieve the highest probability for pure pixel and mixed pixel among the state-of-the-art methods. Moreover, the results of the special pixels under test (e.g. F3 and F4) demonstrate that the proposed method is robust to pure and mixed pixels that are composed of multiple targets.
To compare the performance of the proposed approach with the state-of-the-art methods the test targets from the Cook City dataset are also evaluated according to based on probability prediction values. The comparison results show that the proposed method can achieve the highest average probability prediction values for pure and mixed pixels among the state-of-the-art methods for different targets.
Table 4. A comparison between probability prediction values in the proposed approach and the state-of-the-art methods for different targets. The bold values denote the best result
Conclusions
In this study, a revised replacement model based on the ATGP method for unsupervised target endmember extraction was presented for unsupervised sub-pixel target detection from a hyperspectral data cube. The proposed method is conducted to improve the performance of hyperspectral unmixing in target detection. Moreover, the proposed method does not require prior knowledge and can be applied in complex scenes. Comparison results illustrated that the proposed method has competitive target detection performance in comparison with other state-of-the-art methods. Based on the analysis of the experimental results, the advantages of the proposed method are briefly summarized as follows: (1) The proposed method without prior knowledge can achieve better target detection results than winner-take-all CEM, ACE, and MF. (2) Unlike state-of-the-art methods, the proposed method is robust to pure and mixed pixels that are composed of two different signatures (e.g. V2). (3) The proposed method is robust to pure and mixed pixels that are composed of multiple targets (e.g. F3, and F4). Due to the unmixing stage in the proposed method, the proposed method has an inevitably high time consumption, which is its main limitation. Future work involves acceleration strategies that will be investigated towards the time consumption optimization for the unmixing stage.
Acknowledgments
The authors thank David K. Snyder from the Rochester Institute of Technology for providing the Cook City dataset.
Disclosure statement
No potential conflict of interest was reported by the authors.
References
- Anderson, D. Z. , Zollweg, J. D. , & Smith, B. J. (2019). Paired neural networks for hyperspectral target detection. In Applications of machine learning. presented at the applications of machine learning, international society for optics and photonics. San Diego, California, USA (p. 111390J). https://doi.org/10.1117/12.2531310
- Bakhshi, G. , Shahtalebi, K. , & Momeni, M. (2019). A new adaptive algorithm for target detection in hyperspectral images. Infrared Physics & Technology , 99(1), 222–230. https://doi.org/10.1016/j.infrared.2019.04.015
- Basener, W. F. , Allen, B. , & Bretney, K. (2017). Geometry of statistical target detection. Journal of Applied Remote Sensing , 11(1), 015012. https://doi.org/10.1117/1.JRS.11.015012
- Bernstein, L. S. , Adler-Golden, S. M. , Jin, X. , Gregor, B. , & Sundberg, R. L. (2012). Quick atmospheric correction (QUAC) code for VNIR-SWIR spectral imagery: Algorithm details. In 2012 4th Workshop on Hyperspectral Image and Signal Processing: Evolution in Remote Sensing (WHISPERS). Presented at the 2012 4th Workshop on Hyperspectral Image and Signal Processing: Evolution in Remote Sensing (WHISPERS) . Shanghai, China. (pp. 1–4). https://doi.org/10.1109/WHISPERS.2012.6874311
- Besson, O. , & Vincent, F. (2020). Sub-pixel detection in hyperspectral imaging with elliptically contoured t-distributed background. Signal Processing , 175(1), 107662. https://doi.org/10.1016/j.sigpro.2020.107662
- Bingwen, Q. I. U. , Canying, Z. , & Chongcheng, C. (2013). Comparative spatio-spectral heterogeneity analysis using multispectral and hyperspectral airborne images. Geo-spatial Information Science , 16(2), 83–90. https://doi.org/10.1080/10095020.2013.772805
- Boardman, J. W. (1989). Inversion of imaging spectrometry data using singular value decomposition. In 12th Canadian Symposium on Remote Sensing Geoscience and Remote Sensing Symposium. Presented at the 12th Canadian Symposium on Remote Sensing Geoscience and Remote Sensing Symposium. Vancouver, Canada, Canada. (pp. 2069–2072). https://doi.org/10.1109/IGARSS.1989.577779
- Borengasser, M. , Hungate, W. S. , Watkins, R. , Hungate, W. S. , & Watkins, R. (2007). Hyperspectral remote sensing: Principles and applications. CRC Press , 1(1), 128. https://doi.org/10.1201/9781420012606
- Cao, J. , Zhuo, L. , & Tao, H. (2018). An endmember initialization scheme for nonnegative matrix factorization and its application in hyperspectral unmixing. ISPRS International Journal of Geo-Information , 7(5), 195. https://doi.org/10.3390/ijgi7050195
- Carr, S. B. , Bernstein, L. S. , & Adler-Golden, S. M. (2015). The Quick Atmospheric Correction (QUAC) algorithm for hyperspectral image processing: Extending QUAC to a coastal scene. In 2015 International Conference on Digital Image Computing: Techniques and Applications (DICTA). Presented at the 2015 International Conference on Digital Image Computing: Techniques and Applications (DICTA). Adelaide, SA, Australia. (pp. 1–8). https://doi.org/10.1109/DICTA.2015.7371314
- Chang, C. I. , & Du, Q. (2004). Estimation of number of spectrally distinct signal sources in hyperspectral imagery. IEEE Transactions on Geoscience and Remote Sensing , 42(3), 608–619. https://doi.org/10.1109/TGRS.2003.819189
- Chang, C.-I. (2013). Hyperspectral imaging: Techniques for spectral detection and classification . Springer Science & Business Media.
- Chang, C.-I. (2016). Hyperspectral target detection. In C.-I. Chang (Ed.), Real-time progressive hyperspectral image processing: Endmember finding and anomaly detection (pp. 131–172). Springer. https://doi.org/10.1007/978-1-4419-6187-7_5
- Chang, C.-I. (2017). Recursive hyperspectral sample processing of automatic target generation process. In C.-I. Chang (Ed.), Real-time recursive hyperspectral sample and band processing: Algorithm architecture and Implementation (pp. 209–226). Springer International Publishing. https://doi.org/10.1007/978-3-319-45171-8_7
- Chang, C.-I. , Gao, C. , & Chen, S.-Y. (2015). Recursive automatic target generation process in subpixel detection. IEEE Geoscience and Remote Sensing Letters , 12(9), 1848–1852. https://doi.org/10.1109/LGRS.2015.2431233
- Chang, C.-I. , & Li, Y. (2016). Recursive band processing of automatic target generation process for finding unsupervised targets in hyperspectral imagery. IEEE Transactions on Geoscience and Remote Sensing , 54(9), 5081–5094. https://doi.org/10.1109/TGRS.2016.2553845
- Demirci, S. , Erer, I. , & Ersoy, O. (2014). Vector tunnel algorithm for hyperspectral target detection. In M. Velez-Reyes & F.A. Kruse (Eds.). Presented at the SPIE Defense + Security (p. 90880D). Baltimore, Maryland, USA. https://doi.org/10.1117/12.2053540
- Du, B. , Wu, K. , Liangpei, Z. , Taolin, M. , Tao, C. , & Lifei, W. (2010). An unstructured sub-pixel target detector for hyperspectral imagery. In 2010 International Conference on Computer Application and System Modeling (ICCASM 2010). Presented at the 2010 International Conference on Computer Application and System Modeling (ICCASM 2010) (pp. V11-469-V11-472). IEEE: Taiyuan, China. https://doi.org/10.1109/ICCASM.2010.5623165
- Du, Q. , Raksuntorn, N. , Younan, N. H. , & King, R. L. (2008). End-member extraction for hyperspectral image analysis. Applied Optics , 47(28), F77–F84. https://doi.org/10.1364/AO.47.000F77
- Eismann, M. T. (2006). Strategies for hyperspectral target detection in complex background environments. In 2006 IEEE Aerospace Conference. Presented at the 2006 IEEE Aerospace Conference. Big Sky, MT, USA (p. 10). https://doi.org/10.1109/AERO.2006.1655905
- Gerg, I. (2008). An evaluation of three endmember extraction algorithms: ATGP, ICA-EEA, and VCA . The Pennsylvania State University.
- Harsanyi, J. C. , Farrand, W. H. , & Chang, C. I. (1993). Determining the number and identity of spectral endmembers; an integrated approach using Neyman-Person eigen-thresholding and iterative constrained RMS error minimization [WWW Document] . Pasadena, California, USA.Pages 8–11. Retrieved May 23, 2020, from URL/paper/Determining-the-number-and-identity-of-spectral-an-Harsanyi-Farrand/366f9b38cd4a8834d196b2f5d458fefac95e3280
- Hasanlou, M. , & Seydi, S. T. (2018). Hyperspectral change detection: An experimental comparative study. International Journal of Remote Sensing , 39(20), 7029–7083. https://doi.org/10.1080/01431161.2018.1466079
- Heiden, U. , Roessner, S. , Segl, K. , & Kaufmann, H. (2001). Analysis of spectral signatures of urban surfaces for their identification using hyperspectral HyMap data. In IEEE/ISPRS joint workshop on remote sensing and data fusion over urban areas (Cat. No.01EX482). Presented at the IEEE/ISPRS Joint workshop on remote sensing and data fusion over urban areas (Cat. No.01EX482). Rome, Italy. (pp. 173–177). https://doi.org/10.1109/DFUA.2001.985871
- Hsuan Ren, Q. D. , Chang, C.-I. , & Jensen, J. O. (2003). Comparison between constrained energy minimization based approaches for hyperspectral imagery. In IEEE workshop on advances in techniques for analysis of remotely sensed data, 2003. Presented at the IEEE workshop on advances in techniques for analysis of remotely sensed data (pp. 244–248). IEEE: Greenbelt, Maryland, USA. https://doi.org/10.1109/WARSD.2003.1295199
- Jafarzadeh, H. , & Hasanlou, M. (2019). An unsupervised binary and multiple change detection approach for hyperspectral imagery based on spectral unmixing. IEEE Journal of Selected Topics in Applied Earth Observations and Remote Sensing , 12(12), 4888–4906. https://doi.org/10.1109/JSTARS.2019.2939133
- Jha, S. S. , & Nidamanuri, R. R. (2020). Dynamics of target detection using drone based hyperspectral imagery. In K. Jain , K. Khoshelham , X. Zhu , & A. Tiwari (Eds.), Proceedings of UASG 2019, lecture notes in civil engineering (pp. 91–97). Springer International Publishing. https://doi.org/10.1007/978-3-030-37393-1_10
- Jin, X. , Paswaters, S. , & Cline, H. (2009). A comparative study of target detection algorithms for hyperspectral imagery. In Algorithms and technologies for multispectral, hyperspectral, and ultraspectral imagery XV. Presented at the algorithms and technologies for multispectral, hyperspectral, and ultraspectral imagery XV (p. 73341W). International Society for Optics and Photonics. Orlando, Florida, USA. https://doi.org/10.1117/12.818790
- Johnson, S. E. (2003). Constrained energy minimization and the target-constrained interference-minimized filter. Optical Engineering , 42(6), 1850–1854. https://doi.org/10.1117/1.1571062
- Kelly, E. J. (1986). An adaptive detection algorithm. IEEE Transactions on Aerospace and Electronic Systems AES, 22 (2), 115–127.. https://doi.org/10.1109/TAES.1986.310745
- Kraut, S. , Scharf, L. L. , & Butler, R. W. (2005). The adaptive coherence estimator: A uniformly most-powerful-invariant adaptive detection statistic. IEEE Transactions on Signal Processing , 53(2), 427–438. https://doi.org/10.1109/TSP.2004.840823
- Kruse, F. A. , Lefkoff, A. B. , Boardman, J. W. , Heidebrecht, K. B. , Shapiro, A. T. , Barloon, P. J. , & Goetz, A. F. H. (1993). The spectral image processing system (SIPS)—interactive visualization and analysis of imaging spectrometer data. Remote Sensing of Environment, Airborne Imaging Spectrometry , 44(2–3), 145–163. https://doi.org/10.1016/0034-4257(93)90013-N
- Kumar, V. , & Ghosh, J. K. (2017). Camouflage detection using MWIR hyperspectral images. Journal of the Indian Society of Remote Sensing , 45(1), 139–145. https://doi.org/10.1007/s12524-016-0555-8
- Li, W. , & Du, Q. (2015). Collaborative representation for hyperspectral anomaly detection. IEEE Transactions on Geoscience and Remote Sensing , 53(3), 1463–1474. https://doi.org/10.1109/TGRS.2014.2343955
- Manolakis, D. , and G. Shaw. 2002. Detection Algorithms for Hyperspectral Imaging Applications. IEEE Signal Processing Magazine, 19(1): 29–43. https://doi.org/10.1109/79.974724
- Manolakis, D. , & Shaw, G. (2002). Detection algorithms for hyperspectral imaging applications. IEEE Signal Processing Magazine , 19(1), 29–43. https://doi.org/10.1109/79.974724
- Myers, T. L. , Johnson, T. J. , Gallagher, N. B. , Bernacki, B. E. , Beiswenger, T. N. , Szecsody, J. E. , Tonkyn, R. G. , Bradley, A. M. , Su, Y.-F. , & Danby, T. O. (2019). Hyperspectral imaging of minerals in the longwave infrared: The use of laboratory directional-hemispherical reference measurements for field exploration data. JARS , 13(3), 034527. https://doi.org/10.1117/1.JRS.13.034527
- Nascimento, J. M. P. , & Dias, J. M. B. (2005). Vertex component analysis: A fast algorithm to unmix hyperspectral data. IEEE Transactions on Geoscience and Remote Sensing , 43(4), 898–910. https://doi.org/10.1109/TGRS.2005.844293
- Nasrabadi, N. M. (2014). Hyperspectral target detection : An overview of current and future challenges. IEEE Signal Processing Magazine , 31(1), 34–44. https://doi.org/10.1109/MSP.2013.2278992
- Ren, H. , & Chang, C. I. (2003). Automatic spectral target recognition in hyperspectral imagery. IEEE Transactions on Aerospace and Electronic Systems , 39(4), 1232–1249. https://doi.org/10.1109/TAES.2003.1261124
- Richards, J. A. , & Jia, X. (2006). Remote sensing digital image analysis: An introduction (4th ed.). Springer-Verlag. https://doi.org/10.1007/3-540-29711-1
- Schowengerdt, R. A. (1997). Remote sensing, models, and methods for image processing . Academic Press.
- Settle, J. J. (1996). On the relationship between spectral unmixing and subspace projection. IEEE Transactions on Geoscience and Remote Sensing , 34(4), 1045–1046. https://doi.org/10.1109/36.508422
- Seydi, S. T. , Hasanlou, M. , & Amani, M. (2020). A new end-to-end multi-dimensional CNN framework for land cover/land use change detection in multi-source remote sensing datasets. Remote Sensing , 12(12), 2010. https://doi.org/10.3390/rs12122010
- Snyder, D. , Kerekes, J. , Fairweather, I. , Crabtree, R. , Shive, J. , & Hager, S. (2008). Development of a web-based application to evaluate target finding algorithms. In IGARSS 2008-2008 IEEE international geoscience and remote sensing symposium. Presented at the IGARSS 2008-2008 IEEE international geoscience and remote sensing symposium (pp. II-915-II–918). IEEE: Boston, MA, USA. https://doi.org/10.1109/IGARSS.2008.4779144
- Sun, Q. , Zhang, J. , Lu, X. , & Jin, T. (2017). Hyperspectral target detection based on kernel sparse and spatial constraint. In 2017 IEEE International Geoscience and Remote Sensing Symposium (IGARSS). Presented at the 2017 IEEE International Geoscience and Remote Sensing Symposium (IGARSS). Fort Worth, TX, USA. (pp.640–643). https://doi.org/10.1109/IGARSS.2017.8127035
- Tang, W. , Shi, Z. , & An, Z. (2012). Nonnegative matrix factorization for hyperspectral unmixing using prior knowledge of spectral signatures. Optical Engineering , 51(8), 087001. https://doi.org/10.1117/1.OE.51.8.087001
- Vincent, F. , & Besson, O. (2019). Subpixel target detection in hyperspectral imaging. In 2019 IEEE 8th International Workshop on Computational Advances in Multi-Sensor Adaptive Processing (CAMSAP). Presented at the 2019 IEEE 8th International Workshop on Computational Advances in Multi-Sensor Adaptive Processing (CAMSAP). Le gosier, Guadeloupe, Guadeloupe. (pp.191–195). https://doi.org/10.1109/CAMSAP45676.2019.9022454
- Vincent, F. , & Besson, O. (2020). One-step generalized likelihood ratio test for subpixel target detection in hyperspectral imaging. IEEE Transactions on Geoscience and Remote Sensing , 58 (6): 4479–4489. 1–11. https://doi.org/10.1109/TGRS.2020.2965212
- Wang, M. , Wang, J. , Ding, N. , Xie, J. , Li, Q. , Gao, M. , Liu, F. , & Zheng, Y. (2020). Research on detection method of AOTF polarization spectral target detection based on CEM. In Sixth symposium on novel optoelectronic detection technology and applications. Presented at the sixth symposium on novel optoelectronic detection technology and applications, international society for optics and photonics. Beijing, China. (p. 114553Y). https://doi.org/10.1117/12.2564754
- Wei, L. , & Xuchu, Y. (2006). Small target extraction based on independent component analysis for hyperspectral imagery. Geo-spatial Information Science , 9(2), 103–107. https://doi.org/10.1007/BF02826934
- Yang, X. , Dong, M. , Wang, Z. , Gao, L. , Zhang, L. , & Xue, J.-H. (2020). Data-augmented matched subspace detector for hyperspectral subpixel target detection. Pattern Recognition , 106(1), 107464. https://doi.org/10.1016/j.patcog.2020.107464
- Zhang, L. , & Du, B. (2012). Recent advances in hyperspectral image processing. Geo-spatial Information Science , 15(3), 143–156. https://doi.org/10.1080/10095020.2012.719684
- Zomer, R. J. , Trabucco, A. , & Ustin, S. L. (2009). Building spectral libraries for wetlands land cover classification and hyperspectral remote sensing. Journal of Environmental Management, the GlobWetland Symposium: Looking at Wetlands from Space , 90(7), 2170–2177. https://doi.org/10.1016/j.jenvman.2007.06.028