?Mathematical formulae have been encoded as MathML and are displayed in this HTML version using MathJax in order to improve their display. Uncheck the box to turn MathJax off. This feature requires Javascript. Click on a formula to zoom.
ABSTRACT
The satellite low-light imagers can detect changes in nighttime lights caused by ground military conflict. The Kyiv Offensive in Kyiv, Ukraine, which lasted less than 40 days during the Russia – Ukraine conflict, began on 24 February 2022. In addition to the monthly light product, we included a daily light product to analyse the number and average intensity of light pixels in the area around Kyiv over time. The changing trends of two parameters are similar. From February to March, the number of light pixels dropped by 65.2%, and average intensity by 24.5%. To account for daily fluctuations, the relative light ratio was introduced, comparing Kyiv to Moscow, Gomel, and Warsaw. This parameter showed a significant decrease in both the number and intensity of light pixels between days 411 and 423 since January 1, 2021, aligning with the conflict’s start. The relative light ratio revealed a 70.6%, 63.5%, and 57.3% drop in light pixel numbers, and a 9.5%, 24.2%, and 48.4% drop in their average intensity for the respective city pairs. However, unusual fluctuations in the reference cities, such as in Gomel during Christmas and in Moscow at the conflict’s onset, present some problems in using the relative light ratio.
Introduction
The Russia – Ukraine conflict erupted on 24 February 2022, when Russian president Vladimir Putin announced a special military operation against Ukraine (L.-L. Li et al., Citation2022; The UN and the war in Ukraine: key information, Citationn.d.). Russian troops arrived outside Kyiv in short order and fighting broke out in multiple directions around the city. A standoff continued for a long time, until Russian troops began to withdraw from the area in late March. Comprehensive field investigations are difficult to conduct in these areas, so information is often acquired through official announcements and eyewitness reports (L.-L. Li et al., Citation2022; Z. Zheng et al., Citation2022), which may lead to contradictions in the data and doubts about its authenticity. Satellite remote sensing technology can effectively overcome these issues.
A variety of visible light radiometers have entered space on satellites to monitor the state and changes of the atmosphere, surface, and marine environment throughout the planet At night, however, the moon reflects much less sunlight than the sun shines directly at Earth during the day, not to mention faint starlight and airglow radiation when there is no moon (Miller & Turner, Citation2009). Fortunately, a low-light imager, the Operational Linescan System (OLS), was invented for use in low-light conditions at night in the 1960s, and since then has been carried on a series of United States Defense Meteorology Satellite Program (DMSP) satellites, allowing access to nighttime optical images around the globe, low-light imagers have been widely used in both the military and civilian fields (Cahoon et al., Citation1992; Elvidge et al., Citation1999; Giavi et al., Citation2020; Imhoff et al., Citation1997; Knop et al., Citation2017; Small et al., Citation2005). After the technical accumulation of subsequent payloads, three satellites of the United States, the Suomi National Polar-orbiting Partnership (S-NPP), NOAA-20 and NOAA-21 were launched in 2011, 2017 and 2022, respectively. All of them belong to the Joint Polar Satellite System (JPSS), and have payloads of the same configuration (Hillger et al., Citation2013; Hu et al., Citation2018; Lee et al., Citation2006; Lin et al., Citation2018; Miller et al., Citation2012; Sanchez de Miguel et al., Citation2020). One of the payloads, the Visible Infrared Imaging Radiometer Suite (VIIRS), has a special channel with a 0.5–0.9 μm spectral range, the Day Night Band (DNB), which is capable of observing the Earth in a wide illumination range from daytime solar lights to nighttime lunar lights of quarter-moon phases, with a radiative dynamic range spanning more than seven orders of magnitude. DNB was also well calibrated with the help of the onboard calibration method using its three gain phases (Hu et al., Citation2018; Lei et al., Citation2012; Ma et al., Citation2015; Mills et al., Citation2010). The uncertainty of DNB radiance is better than 15% in the high-gain stage under low-light illumination at night (Liao et al., Citation2013; Shao & Cao, Citation2013). With a growing demand for nighttime low-light remote sensing data, many new imaging payloads with low-light observation capabilities have been launched and used(Levin et al., Citation2014; X. Li et al., Citation2019; Q. Zheng et al., Citation2018). Compared to VIIRS/DNB, these low-light imaging payloads tend to have higher spatial and hyperspectral resolutions, but a relatively smaller swath width, and less data from daily accumulation.
In the early DMSP/OLS era, researchers found that low-light imagers, when viewing low-light cloud images at night, had a good response to city lights on the ground, and thus had broad applications in the socioeconomic domain (Levin et al., Citation2020; X. Li et al., Citation2017; Román & Stokes, Citation2015). Simultaneously, nighttime light products can reflect changes in light caused by war. It indicates that the destruction of urban buildings and electrical systems by armed conflict and the flight of refugees can lead to a reduction in night lights(Witmer, Citation2015; Z. Zheng et al., Citation2022). The effects of war in the Caucasus region of Russia and Georgia were examined using monthly DMSP/OLS composites over the course of the study period, 1992–2009 (Witmer & O’Loughlin, Citation2011). Based on DMSP/OLS data from 38 months during 2008–2014, it was concluded that the war in Syria led to 74% and 73% reductions in nighttime light and lit areas, respectively (X. Li & Li, Citation2014). After the launch of VIIRS, the application of light remote sensing based on low-light data was further developed due to its better radiation calibration and higher spatial resolution (Elvidge et al., Citation2013; L.-L. Li et al., Citation2022; X. Li et al., Citation2022). Cao et al. found an obvious change in light radiance observed by satellite after Washington, D.C., and the East Coast of the United States lost power following the passage of derecho storms and Hurricane Sandy, respectively, in 2012 (Cao et al., Citation2013). Using NASA’s monthly VIIRS Black Marble nighttime light product dataset from 2012 to 2017, Jiang et al. found a 71.6% decrease in total nighttime light after the armed conflicts in Yemen in 2015 (Jiang et al., Citation2017). Li et. al. analyzed 69 monthly nighttime light images from 2014 to 2017 in Iraq, reaching similar conclusions (X. Li et al., Citation2018). Levin et al. used the Arab Spring as a case study, and examined temporal trends in monthly time series of VIIRS night lights to indicate conflict intensity (Levin et al., Citation2018). Zhukov et al. observed a significant decrease in nighttime light intensity in conflict-affected areas, using monthly light data from VIIRS/DNB (Zhukov, Citation2023).
However, past studies have typically focused on wars lasting several years or nearly a year, using long-term monthly light products to acquire the changes in specific countries or regions. The fighting around Kyiv, which lasted less than 40 days, was different from those wars, and thus many details could be lost using only regular monthly light products, which could be improved by daily light products. Zheng et al. applied the median sliding filter method to mitigate abnormal fluctuations and enhance the reliability of their findings in their study utilizing the VNP46A2 product (Z. Zheng et al., Citation2022). Post-smoothing, the transient anomalous fluctuations were effectively filtered out, resulting in more stabilized Night-Time Light (NTL) dynamic curves. Li et al. utilized daily nighttime light data for a 36-day period following the onset of the Russia – Ukraine conflict (L.-L. Li et al., Citation2022). They employed a masking technique to extract urban lighting information and calculated the Night-Time Light Ratio Index (NLRI) to quantify the relative changes in light intensity between wartime and pre-war conditions. However, the time-smoothing treatment may lead to the loss of some significant events or short-term fluctuations, which are particularly critical in the context of acute conflicts where rapid changes can occur. The ratio index introduced by Li et al. compared the pre-war light intensities of the same city, yet the state of war is not the sole variable affecting changes (L.-L. Li et al., Citation2022); factors such as the time of day and climate also play a role in influencing nighttime light intensity (Wei et al., Citation2022).
We used VIIRS/DNB observation radiance data and its derived light products to view Kyiv Offensive, at the beginning of Russia – Ukraine conflict. Satellite daily light products were used to analyze the changes a city goes through in war. Furthermore, we suggest using the reference city method to improve the accuracy of our analysis. This method entails extracting daily nighttime light data from reference cities that have a moderate distance from Kyiv, neither too close to be protected from the effects of war nor too far away to be geometrically similar in terms of weather conditions and satellite observations. It will enable us to generate a relative light ratio parameter that effectively mitigates the impact of extraneous factors on the trend of daily light in Kyiv.
Materials
Data
The global night-time light DNB data from JPSS/VIIRS is used in this study, the VNP02DNB product and the black marble product, with the latter serving as the primary study data. VNP02DNB is L1-level radiance data observed by the satellite, with geolocation information in VNP03DNB. (https://ladsweb.modaps.eosdis.nasa.gov/archive/allData/5200/). NASA began releasing Black Marble products in 2018, modifying the observed radiance to account for atmospheric effects, changes in moonlight, and changes in surface reflectivity. The L3-level Black Marble products are more suitable for most city lights remote sensing than the L1-level observed radiance. The Black Marble products build on the radiance directly observed by the satellite by projecting pixels at latitude and longitude into a uniform-resolution grid, each spanning 10 longitudes and 10 latitudes, consisting of 2400 × 2400 pixels. Nighttime light products were obtained through atmospheric, BRDF, and seasonal vegetation correction (Wang et al., Citation2021). VNP46A2 is a daily gap-filled light product, and VNP46A3 is monthly (https://ladsweb.modaps.eosdis.nasa.gov/archive/allData/5000/.)
In this paper, transits in the area around Kyiv on the four days, 19 February, 12 March, 14 April and 5 May 2022 in the VNP02DNB product data were selected to provide a preliminary analysis of lighting changes during the four phases of Kyiv Offensive. Although the duration of the fighting was less than 40 days, data before and after the fighting were selected in the study to better identify trends and to reflect the role of relative lighting ratios. A total of 574 days of VNP46A2 and 19 months of VNP46A3 were used from 1 January 2021 to 31 July 2022.
Study area
Kyiv is the capital and largest city of Ukraine, located in north-central Ukraine, with a central region around 50.45°N, 30.52°E. shows a satellite map of Kyiv and surrounding areas. The Dnieper River flows from the center of the city in a north-south direction, where it joins the Pripyat and Jessna Rivers. The city is spatially compact, with several highways extending outward.
Figure 1. Daytime satellite map and nighttime low-light scenes around Kyiv observed by VIIRS/DNB (units: nW cm − 2 sr − 1) during Russia–Ukraine conflict in 2022: (a) Kyiv map; (b) City light and non-city light; (c) nighttime low-light scenes on February 19, before conflict; (d) nighttime low-light scenes on March 12, with the battle in full swing; (e) nighttime low-light scenes on April 14, after the withdrawal of Russian troops; (f) nighttime low-light scenes on May 5, in the progress of gradual recovery.
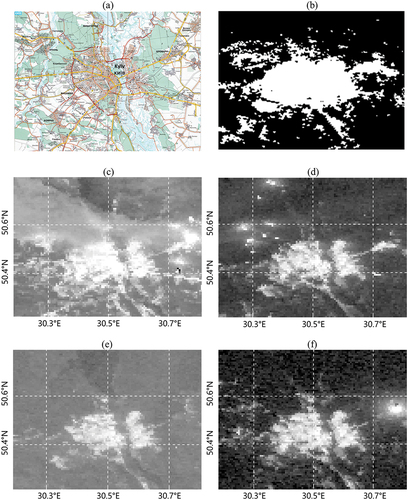
is a map of Kyiv (https://www.gif-map.com/maps-of-europe/maps-of-the-ukraine/maps-of-kiev/transit-map-of-kyiv-city-in-ukrainian). is a reference image of the city and non-city lights after dichotomisation using threshold. show the distribution of low-light radiance around Kyiv. The L1-level data VNP02DNB around Kyiv on February 19, March 12, April 14, and 5 May 2022 were selected and used when observed by the S-NPP satellite. Each image encompasses a latitudinal range of 50.2°N to 50.8°N and a longitudinal range of 30.1°E to 30.9°E, correspond respectively to the first stage before the Russia – Ukraine conflict, the second stage of simmering war, the third stage of withdrawal of Russian troops from Kyiv, and the fourth stage of gradual recovery. The VNP02DNB data contain the observed radiance by satellites with radiometric and geometrical calibration. The changes in the phase of the moon have a direct impact on the brightness of the whole image, and thus the brightness of regions without ground lights varies widely, as seen from the four panels. In addition, the VNP02DNB data could be significantly affected by meteorological clouds. The large clouds northwest of Kyiv in would greatly affect the observed ground lights below, which is currently difficult to correct.
From the satellite low-light images, we can see the dense lights in the center of the city of Kyiv matching the satellite map, the scattered lights in the surrounding suburbs, and the lights of vehicles along the highways outside the city. During the first stage, Kyiv’s urban and suburban areas were well lit and well traveled. But in the second stage, traffic on the east – west highway was completely cut off, and the lights of towns on the outskirts to the northwest and northeast were drastically reduced. In the third stage, lights were reduced further, with suburban lights largely gone and lights outside the city reduced significantly. In the fourth stage, more than 20 days after the end of fighting, there was a noticeable return of lights, with the city’s northeastern suburbs again lit up, but the lights of the city were generally far from pre-war levels.
Methods
City lights mask
For the distribution data of nighttime lights, it is important to identify whether a pixel is a city light for subsequent data processing. After setting the default light value of 65,535 to 0, we set a typical light threshold (Kyba et al., Citation2017) of 5 nWcm−2 sr−1 to get a mask value for whether the pixel corresponds to a city light,
where i and j are the relative row and column locations, respectively, of one pixel in the selected light data; Li,j is the light intensity of the pixel located at (i, j), and Mi,j is the corresponding mask value of city lights.
Number and average intensity of light pixels
According to the spatial range of Kyiv, we selected the monthly light data of 150 × 250 pixels around Kyiv, and determined each light pixel based on the mask values of city lights. The two parameters of the relevant light data, number of light pixels N, and average intensity of light pixels Lmean, intensity refers to the radiance of the light measured by the satellites, two parameters are calculated as
The spatial resolution of each pixel is fixed at 15 arc seconds. Therefore, the number of light pixels N directly indicates the light coverage of this region, and fewer light pixels mean a smaller area with light at night. The average intensity of light pixels Lmean is the ratio of the total intensity of the lit area, extracted from the radiance data of Black Marble products, to the number of light pixels in the area. Since there is often more than one light source in each pixel, the average intensity of light pixels is related to that of a single light source and the number of light sources in leach light pixel. Given that the average intensity of a typical single light source usually varies little with time after a warm-up time, a decrease in the average intensity of a single pixel directly indicates a decrease in the number of light sources within a single pixel, i.e. a decrease in the density of light sources per unit area on the ground.
Quality control of daily light data
For the daily light products VNP46A2, a data subset of gap-filled DNB BRDF-corrected nighttime lights was taken as daily light intensity values. Similar to the data-processing method of monthly light products, whether each pixel of daily light products (consisting of 2400 × 2400 pixels) is a light pixel is determined using Equationequation (1)(1)
(1) , and then the number and average intensity of daily light pixels within 150 × 250 pixels around Kyiv are calculated by Equationequations (2)
(2)
(2) and (Equation3
(3)
(3) ), respectively. Snow flag information is also used to find snow-free days.
However, compared to monthly light data, daily light data are more affected by clouds, and the quality of the payload observation data must be questioned. Therefore, it is necessary to screen the data using the quality control information carried by the VNP46A2 product itself. The quality of daily light data was determined using a data subset called Mandatory_Quality_Flag, where “02” denotes poor quality (outlier, potential cloud content, or other issues) and “255” denotes no retrieval value filled, according to the algorithm description. Counting the numbers of pixels with these two values, we can calculate the percentage of poor-quality data, Pmqf, in the region of interest.
The cloud mask value for each pixel was obtained from a data subset of QF_Cloud_Mask, where 00, 01, 10, and 11 indicate confident clear, probably clear, probably cloudy, and confident cloudy, respectively. Counting the numbers of probably cloudy and confident cloudy pixels, we can calculate the percentage of possible cloud contamination data Pqcm in the region of interest. If the two parameters, Pmqf and Pqcm, were both larger than a certain threshold that differed with the size of the interested region, we believe too many bad-quality pixels make the satellite light product on this date unavailable.
The selected thresholds, Pmqf and Pqcm, were determined as 40% and 30% respectively, based on histogram distributions of days at various values for several cities. We used the percentage of poor-quality data, Pmqf, and the percentage of possible cloud contamination data, Pqcm, for quality control, combined with final visual checks of light images (Solbrig et al., Citation2020) to eliminate residual clearly abnormal data. From 1 January 2021, to 31 July 2022, a total of 170 sets among the 574 daily light products in Kyiv met our quality control standards and were used in the subsequent analysis of daily lights. For other reference cities, the remaining datasets after quality control are not the same as Kyiv.
Relative light ratio
Although quality control has been carried out, daily light products can still vary considerably with time. It is difficult to determine whether the change in daily light data is due to a particular event such as war, or to other factors, such as instrumentation or natural environmental factors. To reduce the possible effects of these non-war factors, we use the relative light ratio, a parameter proposed in this paper, between a reference city and Kyiv itself.
The reference city could be Moscow, with a central area at 55.7°N, 37.6°E, which is basically not affected by the war, and has a moderate distance from Kyiv, also in the position grid of H21 V03. Gomel, Belarus, and Warsaw, Poland, are other candidates, with a central area at 52.5°N, 31.0°E and 52.2°N,21.0°E. Nighttime lights of Kyiv, Moscow, Gomel and Warsaw marked as A, B, C and D, respectively, in . Kyiv and Gomel are at nearly the same longitude, and are closer to each other than Kyiv and Moscow. Kyiv and Warsaw are at nearly the same latitude. Comparing Moscow, Gomel and Warsaw with Kyiv, we can easily conclude that as a larger city known by everyone, Moscow is larger and brighter in nighttime light images, Gomel is smaller and dimmer and Warsaw is similar to Kyiv.
Figure 2. Daily light data (units: nW cm−2 sr−1) for day 264 (September 21, 2021) of H20 V03 and H21 V03 grid, with nighttime lights of Kyiv, Moscow, Gomel and Warsaw, marked as A, B, C and D.
To calculate the relative light ratios of the number and average intensity of light pixels, we collected daily light data from areas around Moscow (500 × 800 pixels), Gomel (90 × 120 pixels), and Warsaw (220 × 300 pixels), taking into account the spatial size of the three reference cities.
If day-by-day fluctuations in light data are due to non-war factors, then the number or average intensity of light pixels in Kyiv and the three reference cities should increase or decrease in a similar way. In this case, fluctuations of the relative light ratio will be significantly smaller. When Kyiv is greatly affected by the war but the reference city is not, the corresponding relative light ratio will still change as markedly as the number or average intensity of light pixels in Kyiv. The use of relative light ratio parameters allows for the analysis of light trends caused by war, reducing the influences of non-war factors.
Results
Monthly light data analysis
shows the monthly variation of monthly lighting parameters in the area around Kyiv for a total of 19 months since January 2021. In January 2021, the number of light pixels around Kyiv was 5,854, and it fluctuated around 7000 for nearly a year after that, similar to the pre-war light observations of Yemen by Jiang et al(Cao et al., Citation2013). It peaked at 9693 in January 2022, then fell to 6671 in February, 2321 in March, and 2128 in April. A slight increase to 2426 was found in May. The outbreak of the Russia – Ukraine conflict in late February led to a significant decrease in the lit area around Kyiv, which reached its lowest point in April, and gradually resumed after May, as Russian forces withdrew. From February to March 2022, the number of light pixels declined by 65.2%.
Figure 3. Monthly number and average intensity of light pixels around Kyiv (the Ukraine-Russia conflict began on month 14).
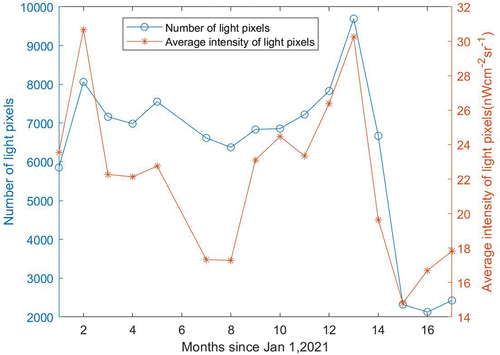
The trend in the average intensity of light pixels around Kyiv was similar, reaching a value of 23.6 nWcm−2 sr−1 in January 2021, and 30.7 nWcm−2 sr−1 in February, then fluctuating around 20 nWcm−2 sr−1. The average intensity of light pixels reached 30.3 nWcm−2 sr−1 in January 2022, then dropped rapidly to 19.6 nWcm−2 sr−1 in February, and 14.8 nWcm−2 sr−1 in March. The value increased slightly to 16.7 nWcm−2 sr−1 and 17.8 nWcm−2 sr−1 in April and May, respectively, indicating an increase in the density of ground light sources after the end of fighting. From February to March 2022, the average intensity of light pixels declined by 24.5%. Using the two parameters of light pixels, the beginning time of conflict was easy to find from the monthly light products.
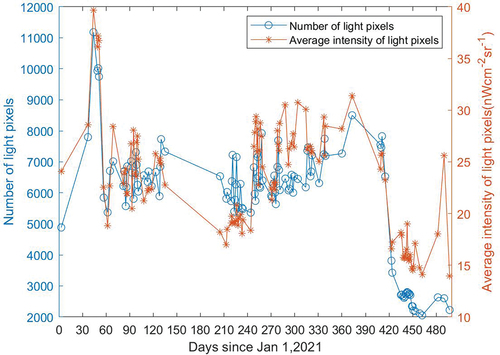
Figure 4. Daily number and average intensity of light pixels around Kyiv (the Ukraine-Russia conflict began on day 420).
Changes in the number of daily light pixels
We used the same strategy as for the monthly light data analysis to process the daily light data and observe its overall trends. The trend in daily light data was broadly consistent with that of monthly light data, but day-to-day fluctuations were more pronounced. The number of light pixels was generally flat in early 2021, hovering around 6000 except for days 44 to 51, when it was around 10,000. The daily data were found missing for a relatively long period, between days 135 and 205. Then there was a slow upward trend, with large daily fluctuations, from around 6000 to 7000 in general. Beginning on day 415, corresponding to 19 February 2022, there was a sharp decrease in the number of light pixels from 6525 to 3815 on day 423, to 2710 on day 435 and the lowest value, 2051, on day 462, followed by a rise to 2633 on day 482.
The light data of Moscow, Gomel and Warsaw are shown for comparison in . shows the changing number of light pixels for Kyiv, with 115 sets of data meeting the above quality control requirements, selected from the daily light data. show the number of light pixels for Moscow Gomel and Warsaw, respectively. All reference cities and Kyiv met the quality control requirements. Hence, uses only 34 sets of data, while uses 85 sets of data, and uses 52 sets of data, which is fewer than the number of data sets used in . The likelihood of cloud coverage may be higher for more pixels in larger cities. show the ratios of the number of light pixels for Kyiv – Moscow, Kyiv – Gomel and Kyiv – Warsaw, respectively. The distance between Gomel and Kyiv is shorter than the distance between Moscow and Kyiv or Warsaw and Kyiv. This proximity allows both cities to obtain cloudless, high-quality data simultaneously during the night. As a result, the number of data points in is less than that in , respectively.
Figure 5. Daily change in number of light pixels and relative light ratios for Kyiv and reference cities (the Ukraine-Russia conflict began on day 420).
Comparing , we can see that before the Russia – Ukraine conflict of day 420, the absolute numbers of light pixels in Kyiv, Moscow, and Gomel were around 7000, 70000, 800 and 11,000, respectively, consistent with the relative sizes of the three cities. However, the change trend in the number of light pixels in Kyiv largely coincided with those seen from the limited data points in Moscow, Gomel and Warsaw. For example, there were a significant number of light pixels in Kyiv, Gomel and Warsaw on day 44, with no data for Moscow, and a higher value at all four cities on day 279. The relative light ratios of the number of light pixels for Kyiv – Moscow, shown in (around 9%), for Kyiv – Gomel, shown in (around 800%), and for Kyiv – Warsaw, shown in (around 60%) were found to fluctuate somewhat less than the number of light pixels for Kyiv, shown in . According to , the relative light ratios for Kyiv and the three reference cities began to decrease significantly between day 411 and day 423, consistent with the beginning of the Russia – Ukraine conflict. In a matter of days, the relative light ratios for Kyiv – Moscow and Kyiv – Gomel declined by 70.6%, 63.5% and 57.3%, respectively. The results of the three groups of data obtained using the three reference cities were relatively close. The outbreak of the conflict greatly decreased the number of light pixels for Kyiv.
Figure 6. Daily changes in average intensity of light pixels and their relative light ratios for Kyiv and reference cities (the Ukraine-Russia conflict began on day 420).
Changes in average intensity of daily lights
From , we can understand the daily variation of the average intensity of light pixels around Kyiv, with relatively pronounced daily fluctuations. In general, the trend of average intensity of light pixels was almost consistent with that of the number of light pixels. When the number of light pixels increased, the average intensity also increased, and vice versa. The average intensity of light pixels was generally stable in early 2021 at around 23 nWcm−2 sr−1, with the exception of days 44 to 51, when it remained around 37 nWcm−2 sr−1. The daily data were found missing for a relatively long period, between days 135 and 205. Then, unlike the slow rise in the number of light pixels, their average intensity underwent a remarkable jump from day 244, rising from near 19 nWcm−2 sr−1 to near 26 nWcm−2 sr−1. From day 415, 19 February 2022, there was a sharp decline, with the average intensity of light pixels decreasing from 23.3 nWcm−2 sr−1 on day 415 to 16.6 nWcm−2 sr−1 on day 423. Then the parameter remained relatively stable, fluctuating slightly between 14 nWcm−2 sr−1 and 18 nWcm−2 sr−1, and then rising to 18.0 nWcm−2 sr−1 on day 482, and to 25.6 nWcm−2 sr−1 on day 490.
The light data of Moscow, Gomel and Warsaw are introduced for comparison in , with the same principle of data filtering as in . shows the changing average intensity of light pixels for Kyiv, with 115 sets of data selected under the above quality control requirements among all daily light data. show the average intensity of light pixels for Moscow, Gomel and Warsaw, respectively, and show ratios of average intensity of light pixels for Kyiv – Moscow, Kyiv – Gomel and Kyiv – Warsaw, respectively. Comparing the 34 groups of data shared by , the 85 groups of data from , and the 52 groups of data from , we can infer that the average intensity of light pixels in Kyiv, Moscow, Gomel and Warsaw were approximately 24.9, 30.5, 14.1 and 23.6 nWcm−2 sr−1, respectively, prior to day 420, the beginning of the Russia – Ukraine conflict, which are consistent with the sizes of the cities. However, the trend of average intensity of light pixels in Kyiv was generally consistent with those of Moscow and Gomel. For example, Kyiv, Gomel and Warsaw both had high values on days 44 and 51, with no data from Moscow, while These four cities exhibit a significantly low value around day 93 and a significantly high value around day 95. The relative light ratios of the average intensity of light pixels for Kyiv – Moscow, shown in (around 80%), for Kyiv – Gomel, shown in (around 180%), and for Kyiv – Warsaw, shown in (around 110%) were found to fluctuate somewhat less than the average intensity of light pixels for Kyiv, shown in . According to , the relative light ratios began to decrease significantly between days 411 and 423, consistent with the beginning of the Russia – Ukraine conflict. In a matter of days, the relative light ratios for Kyiv – Moscow and Kyiv – Gomel declined by 9.5%, 24.2 and 48.4%, respectively. The results obtained from the three reference cities were significantly different. It was found that the average intensity of light pixels in Moscow increased abnormally to 43.4 nWcm−2 sr−1 on day 411, resulting in a smaller relative light ratio, and therefore a smaller decrease than expected. In contrast, the average intensity of light pixels in Gomel increased abnormally to 21.8 nWcm−2 sr−1 on day 360. The outbreak of the conflict slightly decreased the average intensity of light pixels for Kyiv. We advise the readers to use the relative light ratios of two light parameters together and consider the light changes comprehensively.
Discussion
There is no doubt that nighttime light data of satellite-borne low-light imagers can reflect the changes caused by military conflicts on the ground. Monthly light data were used more often in the past to analyze armed conflicts lasting for several months or years. It was found that the trend in daily light data was generally consistent with that of traditional monthly light data, but daily light data can reveal more details about how light changes over time. For example, the average intensity of light pixels between the third to fifth month among the monthly light data was around 22 nWcm−2 sr−1, with little variation, but the average intensity of light pixels between the corresponding days 60 to 150 among the daily light data was between 18.8 and 28.4 nWcm−2 sr−1. In the monthly light data, the average intensity of light pixels from July to August was around 17 nWcm−2 sr−1 between days 180 and 240. Looking back to , there were only a few scatters in the second half of that time, with a mean value of 19.0 nWcm−2 sr−1 in this period, suggesting that the daily values in the first half of the month were not used for reasons related to quality control. Moreover, there would be some errors in the corresponding monthly light data for the same reason. In addition, the consecutive loss of daily light data between days 135 and 25 May indicate the relatively poor quality of daily light data from May to July, but in the monthly light data, only data in the sixth month were lost. By comparing the monthly and daily light data, we can conclude that there were some errors in the fifth and seventh months of monthly light data. As for the long data gap of poor quality, reader should avoid to use and to conclude, as we have marked the available data points with symbols.
The quality of daily light data is also challenged by normalized day-by-day fluctuations and data quality control. Strict data quality control standards reduce the amount of valid data, especially in the presence of meteorological clouds. Thick clouds caused by rainfall would result in no effective light data, exactly as shown in .
Furthermore, the algorithm of VNP46A2 can greatly reduce the effects of moonlight on the city lights. Nevertheless, the residual natural environmental effects and measurement errors from the observational instrument itself can also contribute to the fluctuations in satellite light products. For a certain city, daily light data could still have small day-to-day fluctuations. Fortunately, these impacts are largely unrelated to the characteristics of Kyiv itself. Using the relative light ratio as we presented in this paper, we were able to use the reference cities of Moscow, Gomel and Warsaw to counteract undesirable impacts, and trends in the relative light ratios for Kyiv – Moscow, Kyiv – Gomel and Kyiv – Warsaw were broadly consistent from the limited data points. We tried to add daily light products in viewing the armed conflicts lasting for a shorter period.
Of course, the introduction of relative light ratios can cause new problems, such as exposure to unusual fluctuations in reference cities themselves and the limitation of this method is the need to extract daily nighttime light data from reference cities at moderate distances from Kyiv, which are neither too close to be affected by the war nor too far away to be geometrically similar in terms of weather conditions and satellite observations. By further analysis, it can be found that the number of light pixels for the four cities also had some obvious differences in trends, with some numerical anomalies. On day 360, the number of light pixels for Gomel abnormally decreased to a low of 521, while the average intensity of light pixels abnormally increased, which may be related to that being Christmas Day. As a small city, Gomel may have experienced decreased traffic on its outskirts on Christmas Day, and some celebrations in the downtown business center, accounting for the abnormal phenomena of the two light parameters. The number of light pixels for Moscow increased abnormally to 115,492 on day 423, while the average intensity of light pixels for Moscow increased abnormally 12 days earlier, on day 411. shows the light images of the area around Moscow on days 298, 411 and 423 of 2021. The panel of day 411 in was significantly brighter than that of day 298 in , with the lights in the center of Moscow linked to each other. In contrast, the panel of day 423 in sees a return to normal intensity in the center of the city. However, a large number of relatively scattered and dimmer lights were seen on the outskirts of the city. Considering that the Russia – Ukraine conflict began on 24 February 2022, day 420, i.e. this phenomenon may have been related to a deployment for military operations.
Conclusions
Satellite-borne low-light imagers are capable of sensing light changes caused by military conflicts on the ground and forming nighttime light data products by data processing. Focusing on Kyiv Offensive, which lasted less than 40 days during the Russia – Ukraine conflict that began on 24 February 2022, in addition to the monthly light data commonly used in the literature, we used daily light products to analyze the number and average intensity of light pixels versus the date in the surrounding region of Kyiv. The method we proposed in this paper is helpful for tracking future armed conflicts in near real time.
The changing trends of the two daily light parameters were similar to those of monthly light data, generally stable before the outbreak of the war. After the outbreak of the Russia – Ukraine conflict in February 2022, it was evident from monthly and daily light data that both parameters declined rapidly in a short period from February to March, with the number of light pixels decreasing by 65.2%, and the average intensity of light pixels by 24.5%, with aerosol effects not considered. The aerosol effects around Kyiv on the nighttime observed lights by satellites will be studied in the future.
However, the daily light data, excluding the effects of war, still had some day-to-day fluctuations, usually of a small magnitude, which can be attributed to normal changes in the city lights, but on some dates, such as day 44, the fluctuations were much larger than normal. To analyze the causes of the larger fluctuations and to suppress daily fluctuations in the event of no war, we proposed a method to calculate the relative light ratio. Other cities at moderate distances, such as Moscow and Gomel, were selected as reference cities for comparison with Kyiv. The relative light ratios for Kyiv – Moscow, Kyiv – Gomel and Kyiv – Warsaw began to decrease significantly between days 411 and 423, which coincided with the beginning of the Russia – Ukraine conflict. Within a few days, the relative light ratio of the number of light pixels for Kyiv – Moscow and Kyiv – Gomel decreased by 70.6%, 63.5% and 57.3%, respectively. The results were fairly consistent between the two groups. In contrast, the relative light ratio of the average intensity of light pixels decreased by 9.5%, 24.2% and 48.4% for the three groups, respectively. Although the decreases in the relative light ratios of average intensity varied considerably, they had a similar overall trend of nighttime lights in Kyiv. It reflects the great impact of the Kyiv offensive on the city lights. We also hope that the war will end soon and all people will be able to live in a peaceful and beautiful environment.
Of course, the introduction of relative light ratios can cause new problems, such as exposure to unusual fluctuations in reference cities and the limits of reference cities. On the specific dates determined for outlier occurrence, we can find some unique light changes in Gomel over Christmas and in Moscow at the beginning of the Russia – Ukraine conflict. The choice of the reference city is also limited.
Acknowledgments
We thank NASA for making satellite light products publicly available.
Disclosure statement
No potential conflict of interest was reported by the author(s).
Additional information
Funding
References
- Cahoon, D. R., Stocks, B. J., Levine, J. S., Cofer, W. R., & O’Neill, K. P. (1992). Seasonal distribution of African savanna fires. Nature, 359(6398), 812–13. https://doi.org/10.1038/359812a0
- Cao, C., Shao, X., & Uprety, S. (2013). Detecting light outages after severe storms using the S-NPP/VIIRS day/night band radiances. IEEE Geoscience and Remote Sensing Letters, 10(6), 1582–1586. https://doi.org/10.1109/LGRS.2013.2262258
- Elvidge, C. D., Baugh, K. E., Dietz, J. B., Bland, T., Sutton, P. C., & Kroehl, H. W. (1999). Radiance calibration of DMSP-OLS low-light imaging data of human settlements. Remote Sensing of Environment, 68(1), 77–88. https://doi.org/10.1016/S0034-4257(98)00098-4
- Elvidge, C. D., Baugh, K. E., Zhizhin, M., & Hsu, F. C. (2013). Why VIIRS data are superior to DMSP for mapping nighttime lights. Asia-Pacific Advanced Network 35th Meeting, Hawaii, USA. http://dx.doi.org/10.7125/APAN.35.7
- Giavi, S., Blösch, S., Schuster, G., & Knop, E. (2020). Artificial light at night can modify ecosystem functioning beyond the lit area. Scientific Reports, 10(1), 1–11. https://doi.org/10.1038/s41598-020-68667-y
- Hillger, D., Kopp, T., Lee, T., Lindsey, D., Seaman, C., Miller, S., Solbrig, J., Kidder, S., Bachmeier, S., Jasmin, T., & Rink, T. (2013). First-light imagery from Suomi NPP VIIRS. Bulletin of the American Meteorological Society, 94(7), 1019–1029. https://doi.org/10.1175/BAMS-D-12-00097.1
- Hu, S., Ma, S., Yan, W., Lu, W., & Zhao, X. (2018). Feasibility of a specialized ground light source for night-time low-light calibration. International Journal of Remote Sensing, 39(8), 2543–2559. https://doi.org/10.1080/01431161.2018.1430915
- Imhoff, M. L., Lawrence, W. T., Stutzer, D. C., & Elvidge, C. D. (1997). A technique for using composite DMSP/OLS “city lights” satellite data to map urban area. Remote Sensing of Environment, 61(3), 361–370. https://doi.org/10.1016/S0034-4257(97)00046-1
- Jiang, W., He, G., Long, T., & Liu, H. (2017). Ongoing conflict makes Yemen dark: From the perspective of nighttime light. Remote Sensing, 9(8), 798. https://doi.org/10.3390/rs9080798
- Knop, E., Zoller, L., Ryser, R., Gerpe, C., Hörler, M., & Fontaine, C. (2017). Artificial light at night as a new threat to pollination. Nature, 548(7666), 206–209. https://doi.org/10.1038/nature23288
- Kyba, C. C., Kuester, T., Sánchez de Miguel, A., Baugh, K., Jechow, A., Hölker, F., Bennie, J., Elvidge, C. D., Gaston, K. J., & Guanter, L. (2017). Artificially lit surface of Earth at night increasing in radiance and extent. Science Advances, 3(11), e1701528. https://doi.org/10.1126/sciadv.1701528
- Lee, T. E., Miller, S. D., Turk, F. J., Schueler, C., Julian, R., Deyo, S., Dills, P., & Wang, S. (2006). The NPOESS VIIRS Day/Night Visible Sensor. Bulletin of the American Meteorological Society, 87(2), 191–199. https://doi.org/10.1175/BAMS-87-2-191
- Lei, N., Wang, Z., Guenther, B., Xiong, X., & Gleason, J. (2012). Modeling the detector radiometric response gains of the Suomi NPP VIIRS reflective solar bands. In R. Meynart, S. P. Neeck, & S. Haruhisa (Eds.), Sensors, Systems, and Next-Generation Satellites XVI (Vol. 8533, pp. 319–329). International Society for Optics and Photonics. https://doi.org/10.1117/12.974728
- Levin, N., Ali, S., & Crandall, D. (2018). Utilizing remote sensing and big data to quantify conflict intensity: The Arab Spring as a case study. Applied Geography, 94, 1–17. https://doi.org/10.1016/j.apgeog.2018.03.001
- Levin, N., Johansen, K., Hacker, J. M., & Phinn, S. (2014). A new source for high spatial resolution night time images — the EROS-B commercial satellite. Remote Sensing of Environment, 149, 1–12. https://doi.org/10.1016/j.rse.2014.03.019
- Levin, N., Kyba, C. C., Zhang, Q., de Miguel, A. S., Román, M. O., Li, X., Portnov, B. A., Molthan, A. L., Jechow, A., Miller, S. D., Wang, Z., Shrestha, R. M., & Elvidge, C. D. (2020). Remote sensing of night lights: A review and an outlook for the future. Remote Sensing of Environment, 237, 111443. https://doi.org/10.1016/j.rse.2019.111443
- Liao, L. B., Weiss, S., Mills, S., & Hauss, B. (2013). Suomi NPP VIIRS day‐night band on‐orbit performance. Journal of Geophysical Research: Atmospheres, 118(22), 12705–12718. https://doi.org/10.1002/2013JD020475
- Li, X., & Li, D. (2014). Can night-time light images play a role in evaluating the Syrian Crisis? International Journal of Remote Sensing, 35(18), 6648–6661. https://doi.org/10.1080/01431161.2014.971469
- Li, L.-L., Liang, P., Jiang, S., & Chen, Z.-Q. (2022). Multi-scale dynamic analysis of the Russian–Ukrainian conflict from the perspective of night-time lights. Applied Sciences, 12(24), 12998. https://doi.org/10.3390/app122412998
- Li, X., Li, X., Li, D., He, X., & Jendryke, M. (2019). A preliminary investigation of Luojia-1 night-time light imagery. Remote Sensing Letters, 10(6), 526–535. https://doi.org/10.1080/2150704X.2019.1577573
- Li, X., Liu, S., Jendryke, M., Li, D., & Wu, C. (2018). Night-time light dynamics during the Iraqi civil war. Remote Sensing, 10(6), 858. https://doi.org/10.3390/rs10060858
- Li, X., Li, D., Xu, H., & Wu, C. (2017). Intercalibration between DMSP/OLS and VIIRS night-time light images to evaluate city light dynamics of Syria’s major human settlement during Syrian Civil war. International Journal of Remote Sensing, 38(21), 5934–5951. https://doi.org/10.1080/01431161.2017.1331476
- Lin, G., Wolfe, R. E., Tilton, J. C., Zhang, P., Dellomo, J. J., & Tan, B. (2018). JPSS-1/NOAA-20 VIIRS early on-orbit geometric performance. In J. J. Butler, X. Xiong, & X. Gu (Eds.), Earth Observing Systems XXIII (Vol. 10764, pp. 440–449). San Diego, California, United States: SPIE.
- Li, X., Shang, X., Zhang, Q., Li, D., Chen, F., Jia, M., & Wang, Y. (2022). Using radiant intensity to characterize the anisotropy of satellite-derived city light at night. Remote Sensing of Environment, 271, 112920. https://doi.org/10.1016/j.rse.2022.112920
- Ma, S., Yan, W., Huang, Y. X., Ai, W. H., & Zhao, X. (2015). Vicarious calibration of S-NPP/VIIRS day–night band using deep convective clouds. Remote Sensing of Environment, 158, 42–55. https://doi.org/10.1016/j.rse.2014.11.006
- Miller, S. D., Mills, S. P., Elvidge, C. D., Lindsey, D. T., Lee, T. F., & Hawkins, J. D. (2012). Suomi satellite brings to light a unique frontier of nighttime environmental sensing capabilities. Proceedings of the National Academy of Sciences, 109(39), 15706–15711. https://doi.org/10.1073/pnas.1207034109
- Miller, S. D., & Turner, R. E. (2009). A dynamic lunar spectral irradiance data set for NPOESS/VIIRS day/night band nighttime environmental applications. IEEE Transactions on Geoscience & Remote Sensing, 47(7), 2316–2329. https://doi.org/10.1109/TGRS.2009.2012696
- Mills, S., Jacobson, E., Jaron, J., Mccarthy, J., Ohnuki, T., Plonski, M., Searcy, D., & Weiss, S. (2010). Calibration of the VIIRS day/night band (DNB). 6th Annual Symposium on Future National Operational Environmental Satellite Systems-NPOESS and GOES-R, Atlanta, GA. https://ams.confex.com/ams/90annual/webprogram/6GOESRNPOESS.html
- Román, M. O., & Stokes, E. C. (2015). Holidays in lights: Tracking cultural patterns in demand for energy services. Earth’s Future, 3(6), 182–205. https://doi.org/10.1002/2014EF000285
- Sanchez de Miguel, A., Kyba, C., Zamorano, J., Gallego, J., & Gaston, K. J. (2020). The nature of the diffuse light near cities detected in nighttime satellite imagery. Scientific Reports, 10(1), 1–16. https://doi.org/10.1038/s41598-020-64673-2
- Shao, X., & Cao, C. (2013). Vicarious calibration of S-NPP/VIIRS day-night band. International Society for Optics and Photonics.
- Small, C., Pozzi, F., & Elvidge, C. D. (2005). Spatial analysis of global urban extent from DMSP-OLS night lights. Remote Sensing of Environment, 96(3–4), 277–291. https://doi.org/10.1016/j.rse.2005.02.002
- Solbrig, J. E., Miller, S. D., Zhang, J., Grasso, L., & Kliewer, A. (2020). Assessing the stability of surface lights for use in retrievals of nocturnal atmospheric parameters. Atmospheric Measurement Techniques, 13(1), 165–190. https://doi.org/10.5194/amt-13-165-2020
- The UN and the war in Ukraine: key information. n.d. https://unric.org/en/the-un-and-the-war-in-ukraine-key-information
- Wang, Z., Román, M. O., Kalb, V. L., Miller, S. D., Zhang, J., & Shrestha, R. M. (2021). Quantifying uncertainties in nighttime light retrievals from Suomi-NPP and NOAA-20 VIIRS day/night band data. Remote Sensing of Environment, 263, 112557. https://doi.org/10.1016/j.rse.2021.112557
- Wei, J., Zhong, Y., & Fan, J. (2022). Estimating the spatial heterogeneity and seasonal differences of the contribution of tourism industry activities to night light index by POI. Sustainability, 14(2), 692. https://doi.org/10.3390/su14020692
- Witmer, F. D. (2015). Remote sensing of violent conflict: Eyes from above. International Journal of Remote Sensing, 36(9), 2326–2352. https://doi.org/10.1080/01431161.2015.1035412
- Witmer, F. D., & O’Loughlin, J. (2011). Detecting the effects of wars in the Caucasus regions of Russia and Georgia using radiometrically normalized DMSP-OLS nighttime lights imagery. GIScience & Remote Sensing, 48(4), 478–500. https://doi.org/10.2747/1548-1603.48.4.478
- Zheng, Q., Weng, Q., Huang, L., Wang, K., Deng, J., Jiang, R., Ye, Z., & Gan, M. (2018). A new source of multi-spectral high spatial resolution night-time light imagery—JL1-3B. Remote Sensing of Environment, 215, 300–312. https://doi.org/10.1016/j.rse.2018.06.016
- Zheng, Z., Wu, Z., Cao, Z., Zhang, Q., Chen, Y., Guo, G., Yang, Z., Guo, C., Wang, X., & Marinello, F. (2022). Estimates of power shortages and affected populations during the initial period of the Ukrainian-Russian conflict. Remote Sensing, 14(19), 4793. https://doi.org/10.3390/rs14194793
- Zhukov, Y. M. (2023). Near-real time analysis of war and economic activity during Russia’s invasion of Ukraine. Journal of Comparative Economics, 51(4), 1232–1243. https://doi.org/10.1016/j.jce.2023.06.003
Appendix A
Figure A1. Light images (units: nW cm−2 sr−1) around Moscow on days 298 (October 25, 2021), 411 (February 15, 2022), and 423 (February 27, 2022).