
 ?Mathematical formulae have been encoded as MathML and are displayed in this HTML version using MathJax in order to improve their display. Uncheck the box to turn MathJax off. This feature requires Javascript. Click on a formula to zoom.
Abstract
We propose a methodology based on multiple automated data sources for evaluating the effects of station layout, arriving traveler flows, and platform and on-board crowding on the distribution of boarding passengers among individual cars of metro trains. The methodology is applied to a case study for a sequence of stations in the Stockholm metro network. The findings suggest that passengers opt for less crowded train cars in crowded situations, trading-off walking and in-vehicle crowding while waiting and riding. We find that the boarding car distribution is also affected by the locations of platform access points and the distribution of entering traveler flows. These insights may be used by transit planners and operators to increase the understanding of how passengers behave under varying crowding conditions, identify the factors that affect travelers' choice of metro car and eventually reduce experienced on-board crowding and increase the capacity utilization of the trains through investments in infrastructure or operational interventions.
1. Introduction
As travel demand increases in many cities around the world, overcrowding in the public transport system is recognized as a major issue, particularly during peak periods. Demand level close to capacity leads to higher congestion levels on station platforms and inside vehicles. There is a general need to understand public transport users' travel behavior under crowded conditions as well as their motivation for making a certain boarding decision. This study focuses on advancing the understanding of how metro users are distributed across a train.
On-platform passenger volumes influence train dwell times and passengers waiting times, as well as headway variability and service reliability (Lam, Chung, and Lam Citation1999). The larger the passenger load on the platform, the longer the boarding and alighting times per passenger, which results in longer train dwell times. Models that are describing the relation between crowding on platforms and dwell times have been empirically estimated (Hänseler et al. Citation2017; Suazo-Vecino, Dragicevic, and Muñoz Citation2017). Platform congestion also has a critical impact on crowding within vehicles. On-board crowding is associated with many negative consequences, such as discomfort and stress, unexpected delays, low probability of getting a seat and risk of failing to board a train (Tirachini, Hensher, and Rose Citation2013). It is well established that on-board discomfort conditions, not getting a seat, high density of passengers while riding and less efficient use of time during the journey cause a higher disutility of on-board crowding perceived by users, reducing passengers' level of satisfaction (Cantwell, Caulfield, and O'Mahony Citation2009; Haywood, Koning, and Monchambert Citation2017). Batarce, Muñoz, and de Dios Ortúzar (Citation2016) showed that the disutility of travel time in a congested vehicle is 2.5 times higher than in a vehicle where there are available seats. Wardman and Whelan (Citation2011) showed that passengers' valuation of time spent seated starts increasing when passenger demand exceeds 50% of the seating capacity. Crowding valuation is determined by Yap, Cats, and van Arem (Citation2020) based on smart-card data, showing that frequent travelers are more sensitive to on-board crowding than those who do not travel frequently and lack prior experience.
Passenger loads can be highly unevenly distributed along platforms and between different cars of the train even during peak hours (TRB Citation2014; Zhang, Jenelius, and Kottenhoff Citation2017). This implies that train cars are not equally utilized, which results in higher train requirements and operating costs, as well as higher experienced crowding discomfort. Some studies aim to reduce the skewness of the passenger distribution in the train by determining the optimal train stop location along a platform (Sohn Citation2013) or by means of providing real-time crowding information (Zhang, Jenelius, and Kottenhoff Citation2017). Muñoz et al. (Citation2018) evaluate the installation of a gate, that allows only unidirectional flows, in the middle of the platform at a metro station in Santiago aiming to decrease congestion by inducing different passenger boarding behavior. The interventions resulted in shorter travel times and increased regularity of the trains.
Public transport users consider a variety of factors, such as travel time, transfers, occupancy, comfort and network characteristics, when making travel decisions. Raveau et al. (Citation2014) compare travelers' behavior in London and Santiago metro networks and find that the latter are more willing to travel in crowded trains. In crowded situations passengers have been found to make trade-offs, i.e. board a less crowded train car, wait for the next train service or adapt their departure time to ensure a seat, to avoid the effects of on-board congestion (Pownall, Prior, and Segal Citation2008). Metro passengers have been shown to choose an alternative path in order to avoid delays and on-board crowding (Kim et al. Citation2015). Pel, Bel, and Pieters (Citation2014) analyze the effect of in-vehicle crowding conditions on rail passengers' route choice, considering the average load factor, expressed as a ratio of the average on-board passenger load to the seating capacity, as on-board discomfort indicator. A review of the range of the on-board crowding indicators is provided by Li and Hensher (Citation2013).
The distribution of passengers waiting on a platform is closely related to the physical layout of the platform and the position of entrance/exit points (Szplett and Wirasinghe Citation1984; Krstanoski Citation2014). The distance between the platform entrance and the waiting position, the capacity of each waiting position, and the exit location at the destination station, are some of the factors that determine the skewness of the distribution of passengers along the platform (Liu, Li, and Wang Citation2016). A recent stated preference survey in Paris showed that 81% of the passengers during the morning peak hour choose the platform waiting position based on their desired exit at the egress station, while on average, passengers were found to be willing to walk 50 m in order to avoid on-board crowding (Christoforou et al. Citation2017). Kim, Kwon, and Wu (Citation2014) conducted a survey at congested metro stations, studying passengers' motivation for choosing a specific metro car to board. The results showed that 77% of the respondents reported choosing a specific car intentionally; among these, 70% stated that their motivation was to minimize walking distance at the destination station, 17% sought to minimize walking distance at the origin station, and 13% stated that they sought to maximize comfort during the trip.
Notwithstanding the insights gained by stated preference studies, travel behavior in practice may differ from the surveyed. As a result, it is desirable to use actual observations to increase our understanding of how metro users make their travel decisions and investigate the impact of the underlying explanatory variables on their car boarding choice. The increasing availability of automated data sources opens up new possibilities of revealed preference studies, providing unbiased, massive and continuous public transport data that enable transport agencies to adjust public transport supply to passenger needs better. To the best of our knowledge, no studies have examined passengers' car boarding choice using automatically collected data sources.
This paper investigates the factors that affect the skewness of the distribution of passengers in the metro train and passengers' motivation for boarding a specific metro car. A framework is proposed for investigating the effects of on-board and on-platform crowding as well as incoming traveler flows at each platform access point on passengers' choice among different train cars using automated data sources. The framework utilizes train car load data (e.g. automated passenger counts (APC) or weight measurements), station entering traveler flows (e.g. APC or automated fare collection (AFC) ) and a station-to-station OD demand matrix, and is applied to a sequence of stations in the Stockholm metro network where passenger loads are highly skewed among cars.
The remainder of the paper is structured as follows. Section 2 describes the proposed methodology and the data required. A case study for metro line 14 in Stockholm is provided in Section 3. Results regarding the factors that have a significant impact on passengers' decision to board a specific metro car are presented in Section 4. Section 5 draws conclusions, assesses the limitations of the study and outlines follow-up work.
2. Methodology
This section presents the framework for evaluating passengers' boarding car choice. Ideally, it would be possible to observe the time and location of individual passengers' entrance at the origin station, their on-platform walking distances, choice of platform location for waiting and car to board, and time and location of exit at the destination station. Such information would allow for analyzing the trade-offs between walking distances and on-board crowding at an individual level. In practice, however, such information is not readily available. This paper proposes a method for analyzing the trade-offs at an aggregate level using a combination of common automated data sources. Specifically, the paper models the share of passengers boarding a specific train car as a function of the crowding of the metro train approaching the station, the physical layout of the station, and platform crowding.
Further, the framework does not require automated passenger count data that distinguishes between boarding and alighting passengers, but proposes a method for estimating the number of boarding passengers in each car based on passenger load data and aggregate station-level OD demand data. However, the framework can readily incorporate boarding passenger data when available. The notation used in the paper is summarized in Table .
Table 1. Notation.
2.1. Data requirements
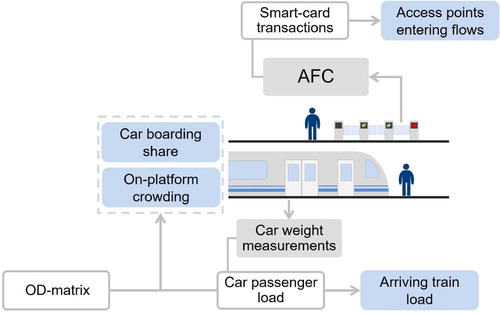
Figure summarizes the types of information obtained through combining the available data sources. Entering passenger flow data, aggregated at the level of station entrances, are utilized to estimate the proportion of passengers entering through a given access point. Car load data are used as an indicator of crowding on-board the train arriving at a station. Combining the car load data and the average ratio of boarding to alighting passengers at a station, obtained from the aggregate travel demand patterns, the number of passengers boarding each car unit is estimated. On-platform crowding, given by the total number of passengers waiting on the platform prior to train departure, assuming that there are no denied passengers, is then estimated based on the car load data and the aggregate travel demand.
Figure 1. Information (blue rectangles) obtained by processing the data (white rectangles) retrieved by automated data sources (gray rectangles).
The analysis of passenger boarding car choice is based on the following data sources:
2.1.1. Train passenger loads
Passenger loads for each car i, train run j and station s describe the utilization of each train car and are used to calculate on-board congestion and evaluate the level of service. Such data may be obtained through car weighing devices which modern trains are often equipped with (Nielsen et al. Citation2014) or through APC data from sensors installed at the vehicle doors. The passenger load data of each car upon departure from the station is used to characterize the in-vehicle crowding as well as the load difference for each individual metro car between consecutive stations.
2.1.2. Station entering flows
Incoming passenger flows at the various access points of each train station are useful for understanding the density of travelers at station facilities such as escalators and platform sections. The entering traveler flow at each access point k of station s during the time interval relevant for each vehicle trip j is denoted by . This information may be obtained through passenger count systems at the entrances, or automated fare collection systems providing information about the user's entrance and exit locations. In this study, the entering traveler flows are used to estimate the share of incoming passengers at each access point.
2.1.3. Station-level OD matrix
Aggregate travel demand data describes the average station-to-station demand for each pair of stations s, t. These origin-destination (OD) demand data can be derived from transit assignment models, or directly observed from automated fare collection (AFC) system depending on the fare collection scheme. The aggregated travel demand is used together with passenger load data to estimate the number of boarding and alighting passengers for each train and station. If automated passenger count data, that distinguish between boarding and alighting passengers, are available, the OD matrix is not needed.
2.1.4. Station layout
In addition to the passenger-oriented data, the physical infrastructure characteristics of the station, including the dimensions of the platform, the layout of the station platforms and the location of entrance/exit points, is also required.
2.2. Data processing
2.2.1. Boarding car distribution
Passenger load data are used to estimate the distribution of passengers among the cars of each metro train. The passenger load difference in each car , after train j departs from station s, denoted by
, is defined as the difference in load between two consecutive stations, s−1 and s,
and
, respectively,
(1)
(1)
The average number of boarding and alighting passengers at station s for a train direction, obtained from the aggregate OD matrix, is used to estimate the number of passengers boarding each car i on trip j upon departure from station s. The ratio of the average number of boarding to alighting passengers at station s, denoted by , is computed as
(2)
(2) The ratio of boarding to alighting passengers is assumed to be the same for all the individual cars of the trains. The estimated number of passengers boarding car i on train trip j at metro station s is then
(3)
(3) The share of passengers boarding car i on train trip j at metro station s, denoted by
, is
(4)
(4)
The framework is applicable for positive and negative car passenger load difference but it requires consistency between the average ratio of boarding to alighting passengers at a station
and the car load difference for each car, i.e.
requires
, while
requires
. The rare case where the average number of boarding and alighting passengers at the same station are equal is not taken into account.
The analysis framework is also applicable for trains where movement between cars inside the train is possible. However, it is expected that when the movement between cars is allowed, the effect of on-board crowding on the car choice is lower because passengers can avoid a crowded car after boarding by moving to another one.
2.2.2. Platform entry point distribution
A hypothesis is that the passenger car boarding distribution can be partly affected by the physical infrastructure of the platform and the access point locations as well as the incoming passenger counts at each platform entrance (Szplett and Wirasinghe Citation1984). We investigate the impact of the distribution of incoming passengers among the entry points of the metro station on passengers' boarding car choice. The share of incoming passengers at platform entry location k is computed from the station access points entering flows,
(5)
(5)
2.2.3. Waiting passengers
Passenger's decision to board a specific metro car may also be influenced by on-platform crowding, approximated through the number of passengers waiting on the platform. Assuming that no passengers are denied from boarding due to capacity constraints, the number of waiting passengers on the platform prior to train departure j is equal to the total number of passengers boarding train j. The number of waiting passengers is then computed from the passenger load data and the aggregate OD demand data,
(6)
(6) The assumption is valid when there is observed remaining car capacity after the train departs from a station.
2.3. Boarding car share model
Linear regression analysis is used due to its flexible formulation and interpretability to infer the relations between several variables and passengers' decision to board a specific train car. Stepwise regression with backward elimination is a sequential method used to identify the least possible number of determinants that have a significant impact on the share of boarding passengers. The procedure starts with all the candidate independent variables in the model, which are examined for multicollinearity. Considering a conservative 1% level of significance, the least significant variable (i.e. the one with the largest p-value) is excluded and the model is refitted iteratively. After termination, all the remaining determinants have p-values smaller than 0.01.
3. Stockholm case study
The daily travel demand in Stockholm's metro network is steadily increasing. On average, more than 1,273,000 passengers board Stockholm metro trains daily (SL Citation2017). Key stations and segments are confronted with overcrowding during the peak hours, while the passenger load is often not evenly distributed among individual metro cars. On average, 80% of the available seats are occupied during the highest peak of the morning rush hour (07:30 am–08:30 am) (SL Citation2017).
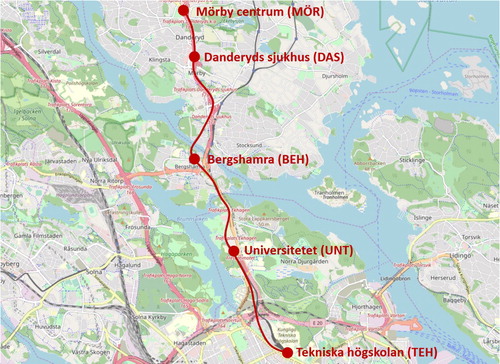
The proposed analysis framework is applied to a case study for the southbound segment of the metro line 14 between Mörby centrum and Tekniska Högskolan. The segment serves five metro stations: the terminus Mörby centrum (MÖR), Danderyds sjukhus (DAS), Bergshamra (BEH), Universitetet (UNT), and Tekniska högskolan (TEH) (Figure ). Two stations after TEH, the line joins a corridor shared with another line and serves 14 additional stations. During the morning peak hour, the planned headway for the considered metro line is 5 min.
Figure 2. Map of the studied segment of the Stockholm metro network. Map source: OpenStreetMap.
3.1. Data
In order to apply the analysis framework in Section 2, several sets of data regarding passenger loads, access points traveler flows, travel demand and station infrastructure, are used. Passenger load data for each car unit are available for each southbound train trip at departure from each station during the morning rush period (6:00 am–9:00 am) on working days in October 2016. The number of passengers in each car is estimated based on an average weight of 78 kg per passenger including luggage. In total, 948 train load observations for different train runs and stations are available during the analysis period. A full-length standard metro train in Stockholm consists of three cars (front, middle and rear). According to the train manufacturer, the design capacity of a car unit is 126 seated passengers and 288 standees.
Passenger flow data in the Stockholm metro system are obtained through contactless smart card transactions at the station, recording the date, the name of the access station and the gate id. Incoming passenger counts at each entrance point of the station are obtained through smart card transactions for the morning peak period for the same analysis period (6:00 am–9:00 am on working days in October 2016) and they are available for 15-min time intervals of the analysis period. It is assumed that the entering flow in a 15-min-period is equally distributed between the three train arrivals during the same period. Since metro users in Stockholm do not have to tap the smart card when they exit metro stations, information about users' exit station is not available.
Aggregate origin-destination travel demand data for the morning peak period at the station-to-station level for the metro line are produced in the traffic assignment model Visum, based on the official planning zonal OD matrix. These data are used to estimate the average proportion of boarding to alighting passengers at each metro station.
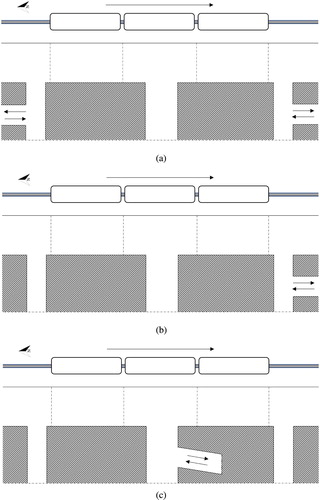
Infrastructure characteristics, namely the layout of the platforms that serve the metro trains heading south, specifying the available entrance/exit points on the platform as well as the location of those, are available for the five selected metro stations (Figure ). Mörby centrum and Universitetet are the only stations that have a single entrance point, placed in the middle and south part of the platform, respectively. The train stop location on the platform is assumed to be at the middle of the platform.
Figure 3. Layouts of the southbound platforms of the Mörby centrum–Tekniska Högskolan corridor: (a) Danderyds sjukhus (DAS), Bergshamra (BEH), Tekniska högskolan (TEH); (b) Universitetet (UNT); (c) Mörby centrum (MÖR). The metro train, heading south, is represented by rounded rectangles, indicating individual car units. The double arrows indicate the platform access points and the grey shaded parts indicate the non-walkable areas.
All considered stations have average boarding-to-alighting ratios larger than 1. To be consistent with the analysis framework, observations with a negative passenger load difference in at least one metro car are excluded.
3.2. Descriptive statistics
The average crowding level during the analysis period in each of the three metro cars of the southbound train trips is illustrated in Figure . On average, between DAS and TEH the front train car exhibits the highest passenger load in the morning rush hour, in particular from 7:30 am to 8:30 am. The south entrances of these four stations are located close to popular bus terminals and the main campuses of KTH Royal Institute of Technology (TEH) and Stockholm University (UNT), while many downstream stations have popular exits on the southern end of the platform. Together, these factors create a significantly skewed distribution of passengers on-board the train. On average, 54.6% of the passengers entering the selected stations, enter at the south station access points. At MÖR, which has a single access point, located close to the middle of the platform, the middle train car tends to have a slightly higher crowding level. We observe that the on-board car occupancy does not reach total car capacity in any of the available train trips, which validates the assumption made in the proposed framework that no passengers are denied from boarding.
Figure 4. Average metro car occupancy for train trips upon departure from each station.
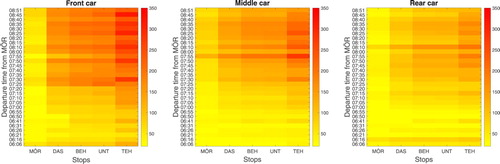
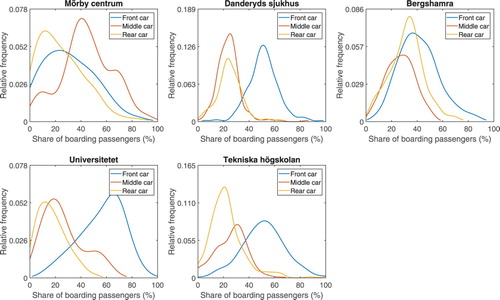
Figure shows the estimated distribution of passengers boarding each metro car at the studied metro stations during the analysis period. Uneven boarding passenger distributions, skewed towards the front cars, are observed at DAS, BEH, UNT and TEH. The average boarding share of the front car is 51.1%, 41.3%, 55.9% and 51.3% for DAS, BEH, UNT and TEH, respectively, during the analysis period. On average, 44.2% of the passengers at MÖR typically board the middle train car.
Figure 5. Relative frequency distribution of passengers boarding each car at the studied metro stations.
4. Results
4.1. Bivariate correlations
4.1.1. Impact of on-board crowding
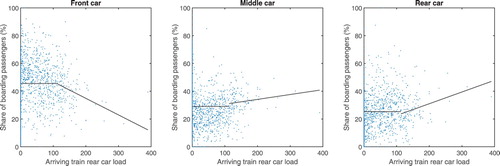
The share of boarding passengers of each metro car is plotted against the car passenger load of arriving train in Figures . The arriving train car load at station s is equal to the train car passenger load at departure from station s−1, . It can be observed that the boarding share of the front car decreases with the passenger load in the arriving train. Conversely, for the middle and rear cars, the share of boarding passengers seems to increase for larger car passenger loads.
Figure 6. Share of passengers boarding (%) individual metro cars as a function of the arriving train front car passenger load.
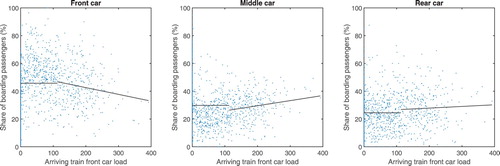
Figure 7. Share of passengers boarding (%) individual metro cars as a function of the arriving train middle car passenger load.
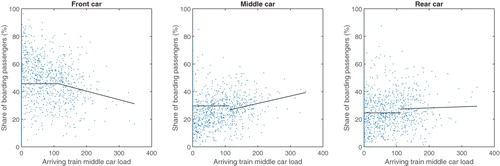
Figure 8. Share of passengers boarding (%) individual metro cars as a function of the arriving train rear car passenger load.
Crowding indicators are introduced to evaluate the impact of crowding in each car of the arriving train. Based on the bivariate plots, the baseline assumption is that crowding above a certain level has a significant effect on car choice and a threshold α is used to classify each car into one of two categories: crowded and not crowded. The crowded train car variable is
(7)
(7) and describes the excess passenger load on-board a crowded car of the arriving train. With this indicator, the on-board passenger car load is assumed to have no impact on passengers' boarding choice when the arriving train car is not crowded. Several different crowding thresholds have been evaluated and it is found that the model has the highest explanatory power when the threshold is set to 90% of the seated capacity
. For reference, on average 90% of the available seats of the studied metro line in Stockholm are occupied during the highest peak of the morning rush hour (07:30–08:30 am) (SL Citation2017).
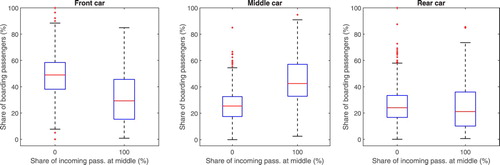
4.1.2. Impact of station layout and entering traveler flows
Figures and show the share of passengers boarding each metro car as a function of the share of incoming passengers at the south and middle access point of the southbound platform, respectively. MÖR is the only station of the considered segment that has a single access point at the middle of the platform; hence, the share of incoming passengers at the middle platform entrance is either 100% for the observations at this station, or 0% for the observations at the other stations. It is seen that for larger proportions of passengers entering the southern platform entrance, the boarding share increases in the front car and decreases in the middle and rear cars. As can be expected, the existence of an access point at the middle of the platform leads to a higher boarding share for the middle car.
Figure 9. Boxplots representing the share of passengers boarding (%) individual metro cars as a function of the share of incoming passenger counts at the south platform entrance.
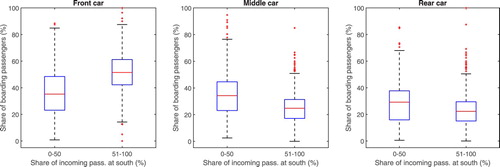
Figure 10. Boxplots representing the share of passengers boarding (%) individual metro cars as a function of the share of incoming passenger counts at the middle platform entrance.
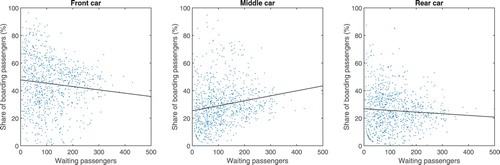
4.1.3. Impact of platform crowding
The crowding level on the platform affects on-board crowding. Many studies on public transport crowding use the average area on the platform that is occupied by a pedestrian or the average walking speed as on-platform crowding indicators. In this study, the total passenger occupancy of the platform prior to the departure of the train is used as the platform crowding measure. Figure indicates the boarding share of each metro car as a function of the number of passengers waiting on the platform. It can be observed that for the middle car, the boarding share increases with the number of passengers waiting on the platform. For the front and rear cars, the boarding share decreases with the platform crowding.
Figure 11. Share of passengers boarding (%) individual metro cars as a function of the number of passengers waiting on the platform.
Descriptive statistics for all dependent and independent variables are provided in Table . The average boarding passenger shares are skewed towards the front car. The mean car passenger load in the arriving train is larger for the front car. However, there is considerable variation in car load, as shown by the minimum and maximum values. The percentages of passengers entering at the south and middle platform access points are highly spread out from the mean values of 54.62% and 20.25%, respectively.
Table 2. Descriptive statistics: dependent and independent variables.
4.2. Multiple regression analysis
To evaluate the combined impact of on-board and on-platform crowding as well as the distribution of entering travelers at different platform access points on the boarding share of each train car i (i = 1, 2, 3), regression models
(8)
(8) are estimated using the backward elimination approach. Multicollinearity among the explanatory variables has been tested and it is found that they are not highly correlated.
Analysis results for Model I, presented in Table , show that the crowding indicator of the front car is significant at the 5% level for the front and middle cars. The middle and rear car crowding indicators do not have a statistically significant impact on passengers' car choice. The share of incoming flow at the south entry location is found to have a highly statistically significant impact at the 1% level on the share of passengers boarding the front and rear cars, while the boarding share of the middle car is affected at the 5% level (). The arriving passenger flow at the middle platform entrance is highly significant at the 1% level for the middle and rear cars, while the front car boarding share is affected at the 5% level. Model results indicate that the number of passengers waiting on the platform prior to train departure does not have a significant effect for the front and rear cars (
).
Table 3. Regression results for the share of passengers boarding each metro car for models I and II.
Insignificant determinants at the 1% significance level are sequentially excluded through backward elimination, and the final regression model (Model II) for each metro car i (i = 1, 2, 3) is
(9)
(9) Regression model II yields the estimation results summarized in Table . The remaining variables have a measurable statistically significant effect on the car boarding share at the 1% level. The residuals of the regression models are analyzed for violations of the regression analysis assumptions and found to be normally distributed.
Model II results indicate that an increase of arriving train front car load by 1 unit, given that the front car load exceeds the crowding threshold, when all the other determinants remain unchanged, is associated with a 0.08% points decrease in the boarding share of the front car and a 0.05% increase in the middle car boarding share. The share of travelers entering the south entry point has a positive marginal effect, 0.19% points per passenger share %, on the boarding share of the front car which is closer to the south platform access point. The arriving flow at the middle platform entrance is found to increase the boarding share of the middle car by 0.19% points per passenger share %. The estimated impact of the on-platform crowding indicator on the boarding share of the middle car is 0.02% points, indicating that for a larger number of waiting passengers on the platform, passengers tend to walk to the middle of the platform.
The explanatory power of the models, described by , is relatively low. This is to be expected since the model investigates travel behavior and does not include all the possible relevant determinants to explain individual travelers' car boarding choice.
To assert the robustness of the results, alternative model specification is also evaluated. The passenger load factor of car i of train j at station s
(10)
(10) describes the capacity utilization of the arriving train and is used to represent on-board crowding as an independent variable instead of the car crowding indicator
. This specification assumes that on-board load affects passengers' car choice even when train car is not regarded crowded. Estimation with OLS indicate that
have a weak correlation with the car boarding shares, implying that on-board crowding above a certain level, defined by the threshold used in this study, has effect on the car boarding choice.
To evaluate the effect of the coefficient estimates of Model II, the forecasted effect of each independent variable of Model II on the car boarding shares, holding all other determinants unchanged and equal to the mean of the historical data, is examined. Figure (a) indicates the impact of crowded front car variable on the boarding share of individual train cars. It is shown that the front and middle car boarding share is expected to change by −0.08 % and 0.05%, respectively, if the crowded front car load of the arriving train increases by 1 additional passenger. The share of passengers boarding a car is constant and the crowded car variable has no effect on passengers' boarding distribution in the train when less than 90% of the seats are occupied. The effect of on-platform crowding, which is found to be statistically significant at the 1% level for the middle car boarding share, is shown in Figure (b). For each additional passenger waiting on the platform, the middle car boarding share increases by 0.02%.
Figure 12. Effect of (a) front crowded car indicator; (b) on-platform crowding; (c) entering traveler flow at the south entrance point; (d) entering traveler flow at the middle entrance point; on passengers' car boarding choice.
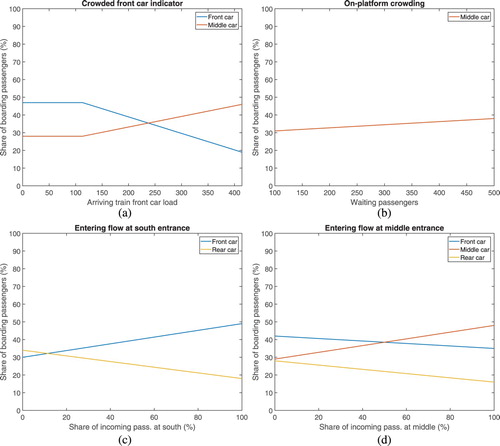
Figure (c,d) present the expected variation in car boarding shares as a function of the proportion of entering flow at a platform entrance, if the rest of the determinants in Model II are constant, taking their average values. If the share of travelers entering at the south platform entrance increases by 1%, the boarding shares of the front and rear cars change by 0.19% and , respectively. Similarly, the effect of the share of travelers entering at the middle access point on the car boarding shares is shown in Figure (d). Front and rear car boarding shares decrease by 0.07% and 0.12%, respectively, if the share of entering flow at the middle platform entrance increases by 1%, while the boarding share of the middle train car increases by 0.19%.
4.3. Application illustration
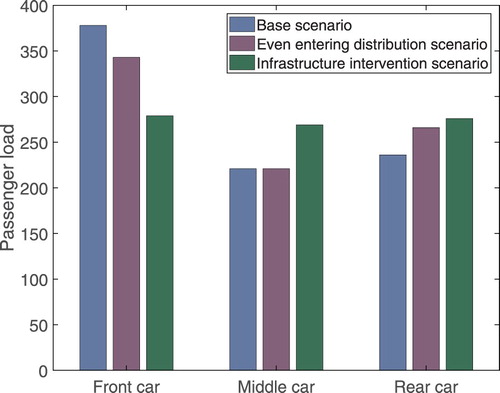
The contribution of the proposed methodology in reducing crowding cost of metro passengers is demonstrated for the most crowded train trip at Danderyds sjukhus (DAS) where the empirical passenger load distribution is highly skewed towards the front car. Model II is used to assess passenger boarding distribution and car passenger load upon departure from the station for three scenarios:
Base scenario, where the on-board crowding distribution is calculated based on the current entering flow distribution between the existing access points.
Even entering distribution scenario, where the on-board crowding distribution is calculated assuming even entering flow distribution between the existing access points.
Infrastructure intervention scenario, where a physical layout change is considered at DAS, which has two access points located at the two ends of the platform. The southern entrance is replaced by an access point located close to the middle of the platform and the entering flow is assumed to be equally distributed between the two entrances.
Figure presents the calculated passenger load distribution in individual cars of the train after it departs from DAS for the three scenarios. The proposed methodology suggests a significant improvement in reducing crowding unevenness on-board the train caused by the proposed interventions. The rearrangement of the station access points is found to have the largest effect on passengers' car boarding choice, leading to highly even load distribution in the train upon departure.
Figure 13. Car passenger load at departure from Danderyds sjukhus for three scenarios.
5. Conclusion
In this study, we propose a methodology based on a combination of automated data sources to evaluate the effects of on-board and on-platform crowding, as well as the distribution of entering traveler flow among the platform access points, on passengers' boarding behavior and their distribution across the metro train. An application of the methodology is carried out for a sequence of stations along metro line 14 in Stockholm, where a highly skewed passenger distribution is observed. Automated passenger load data, involving the trips over a one-month period, and aggregate automated fare collection data for the same period are utilized.
On average, train car loads at the studied stations are highly skewed towards the leading cars. Analysis results show that the shares of incoming passengers at the south and middle platform access points increase the share of boarding passengers in the front and middle car, respectively. These findings suggest that the share of incoming passengers at an access point positively affects the boarding share of the closest car, implying that passengers aim to minimize the walking distance at the origin station.
Further, above a certain crowding threshold, the passenger load on-board the front car of the arriving train has a negative statistically significant impact on the boarding share of the front car and a positive impact on the middle car boarding share, which implies that some passengers are willing to increase walking distance to experience lower in-vehicle crowding. Platform congestion, given by the number of waiting passengers prior to train departure, is observed to have a positive statistically significant impact on the boarding share of the middle train car. This suggests that passengers choose to wait at the middle section of the platform to minimize discomfort or in anticipation of high on-board crowding. As a result, the passenger distribution between cars tends to be less uneven in higher on-platform crowding situations.
Evaluating the effect of each determinant of the selected model on the car boarding shares, assuming that the other determinants take the average values, it is found that the effect of the passenger load in the crowded front car of the arriving train is larger on the boarding share of the leading car and equal to per additional passenger for an already crowded front car. An increase in the proportion of entering flow at a platform access point by 1% is found to have an effect on the boarding share of the closest car of around 0.2%.
The analysis conducted in this study is limited to factors that affect the car boarding choice related to passengers' origin location, since smart-card tap-outs are not available for metro users in Stockholm. As a result, passengers' travel behavior at their destination station could not be analyzed. Smart-card tap-ins are used in Munizaga and Palma (Citation2012) to observe boarding sequences, estimate the destination stop and build OD matrices. Information about passengers' destination stop, in-vehicle travel time, waiting time on the platform prior to train arrival as well as the walking distance of each passenger is expected to explain some of the variability in car boarding choice which hitherto remains unexplained. Xie and Leurent (Citation2017) related the tap-in and tap-out times obtained from smart-card transactions to estimate the walking speed, walking time within a station and waiting time of individual passengers. Further, this study estimates the number of boarding passengers from net load differences and aggregated station-level demand patterns, which will tend to underestimate the impacts of the studied variables on car boarding choice. Data on the observed number of boarding passengers are expected to reveal stronger impacts of the studied variables. Moreover, passengers that are denied from boarding due to capacity constraints or choose not to board are not taken into account in this study. Observed data about passenger's waiting position on the platform, would be insightful for handling denied boarding, explaining the relationship between passenger distribution on the platform and inside the vehicle as well as for investigating passenger's behavior before and after the arrival of the train.
The proposed methodology is useful for metro operators to understand the uneven passenger distribution across the train and increase the utilization of the train capacity, thereby reducing the operating costs through infrastructure investments or operational changes. Infrastructure interventions, such as re-planning of the station layout and rearrangement of the location of entrances, or operational interventions, such as implementation of real-time information systems informing passengers about the crowding level across the platform and in the arriving train, could reduce the unevenness of car crowding. Experienced passengers make car boarding decisions considering the trade-off between walking distance and crowding, that can be expected to be based on passengers' prior route experience. Such passengers may update the car boarding choice if real-time crowding information is available, since crowding varies over time and days. Furthermore, occasional inexperienced users, having no prior knowledge about the station infrastructure characteristics or route crowding, are expected to adjust their car choice according to the real-time information system on the on-board and platform crowding level.
The variables used to explain the car boarding choice in this study are general and the proposed methodology could be applied to other stations and cities if the same type of data are available and the same assumptions can be made. The study results could be generalized by studying other metro transit locations with different demand level and infrastructure characteristics to enable transferability of the proposed model. In future work, the estimated outgoing traveler flow at individual platform access points could be used to analyze the alighting share of individual cars and examine other factors related to passengers' destination stop that might affect passengers' boarding decision. Moreover, to increase the generality of the proposed framework, further research is required to handle denied boarding and increase the applicability of the model.
Acknowledgments
The authors would like to thank MTR Nordic for providing the metro train car load data and SLL for providing the smart-card data.
Disclosure statement
No potential conflict of interest was reported by the author(s).
ORCID
Erik Jenelius http://orcid.org/0000-0002-4106-3126
Oded Cats http://orcid.org/0000-0002-4506-0459
Additional information
Funding
Related Research Data
References
- Batarce, M., J. C. Muñoz, and J. de Dios Ortúzar. 2016. “Valuing Crowding in Public Transport: Implications for Cost-Benefit Analysis.” Transportation Research Part A: Policy and Practice 91: 358–378.
- Cantwell, M., B. Caulfield, and M. O'Mahony. 2009. “Examining the Factors that Impact Public Transport Commuting Satisfaction.” Journal of Public Transportation 12 (2): 1–21. doi: 10.5038/2375-0901.12.2.1
- Christoforou, Z., P. A. Collet, B. Kabalan, F. Leurent, A. de Feraudy, A. Ali, T. J. Arakelian-von Freeden, and Y. Li. 2017. “Influencing Longitudinal Passenger Distribution on Railway Platforms to Shorten and Regularize Train Dwell Times.” Transportation Research Record: Journal of the Transportation Research Board 2648: 117–125. doi: 10.3141/2648-14
- Hänseler, F. S., W. H. K. Lam, M. Bierlaire, G. Lederrey, and M. Nikolić. 2017. “A Dynamic Network Loading Model for Anisotropic and Congested Pedestrian Flows.” Transportation Research Part B: Methodological 95: 149–168. doi: 10.1016/j.trb.2016.10.017
- Haywood, L., M. Koning, and G. Monchambert. 2017. “Crowding in Public Transport: Who Cares and why?” Transportation Research Part A 100: 215–227.
- Kim, K. M., S. P. Hong, S. J. Ko, and D. Kim. 2015. “Does Crowding Affect the Path Choice of Metro Passengers?” Transportation Research Part A 77: 292–304.
- Kim, H., S. Kwon, and S. K. Wu. 2014. “Why Do Passengers Choose a Specific Car of a Metro Train During the Morning Peak Hours?” Transportation Research Part A 61: 249–258.
- Krstanoski, N. 2014. “Modelling Passenger Distribution on Metro Station Platform.” International Journal for Traffic and Transport Engineering 4 (4): 456–465. doi: 10.7708/ijtte.2014.4(4).08
- Lam, W. H. K., C.-Y. Chung, and C. F. Lam. 1999. “A Study of Crowding Effects At the Hong Kong Light Rail Transit Stations.” Transportation Research Part A 33: 401–415.
- Li, Z., and D. A. Hensher. 2013. “Crowding in Public Transport: A Review of Objective and Subjective Measures.” Journal of Public Transportation 16 (2): 107–134. doi: 10.5038/2375-0901.16.2.6
- Liu, Z., D. Li, and X. Wang. 2016. “Passenger Distribution and Waiting Position Selection Model on Metro Station Platform.” In International Conference on Civil, Structure, Environmental Engineering (I3CSEE 2016), 35–41. Guangzhou, China: Atlantis Press.
- Muñoz, J. C., J. Soza-Parra, A. Didier, and C. Silva. 2018. “Alleviating a Subway Bottleneck Through a Platform Gate.” Transportation Research Part A: Policy and Practice 116: 446–455.
- Munizaga, M. A., and C. Palma. 2012. “Estimation of a Disaggregate Multimodal Public Transport Origin–Destination Matrix From Passive Smartcard Data From Santiago, Chile.” Transportation Research Part C: Emerging Technologies 24: 9–18. doi: 10.1016/j.trc.2012.01.007
- Nielsen, B. F., L. Frølich, O. A. Nielsen, and D. Filges. 2014. “Estimating Passenger Numbers in Trains Using Existing Weighting Capabilities.” Transportmetrica A: Transport Science 10 (6): 502–517. doi: 10.1080/23249935.2013.795199
- Pel, A. J., N. H. Bel, and M. Pieters. 2014. “Including Passengers' Response to Crowding in the Dutch National Train Passenger Assignment Model.” Transportation Research Part A 66: 111–126.
- Pownall, C., M. Prior, and J Segal. 2008. “What Rail Passengers Will Do to Get a Seat.” In Proceedings of European Transport Conference, 1–27. Leiden, The Netherlands: Association for European Transport.
- Raveau, S., Z. Guo, J. C. Muñoz, and N. H. M. Wilson. 2014. “A Behavioral Comparison of Route Choice on Metro Networks: Time, Transfers, Crowding, Topology and Socio-Demographics.” Transportation Research Part A 66: 185–195.
- SL. 2017. “Fakta om SL och länet 2016, Storstockholms Lokaltrafik.” Diarienummer: S–2016–0762. (In Swedish).
- Sohn, K. 2013. “Optimizing Train-Stop Positions Along a Platform to Distribute the Passenger Load More Evenly Across Individual Cars.” IEEE Transactions on Intelligent Transportation Systems 14 (2): 994–1002. doi: 10.1109/TITS.2013.2252166
- Suazo-Vecino, G., M. Dragicevic, and J. C. Muñoz. 2017. “Holding Boarding Passengers to Improve Train Operation Onbasis of An Economic Dwell Time Model.” Transportation Research Record 2648: 96–102. doi: 10.3141/2648-11
- Szplett, D., and S. C. Wirasinghe. 1984. “An Investigation of Passenger Interchange and Train Standing Time At LRT Stations: (i) Alighting, Boarding and Platform Distribution of Passengers.” Journal of Advanced Transportation 18 (1): 1–12. doi: 10.1002/atr.5670180102
- Tirachini, A., D. A. Hensher, and J. M. Rose. 2013. “Crowding in Public Transport Systems: Effects on Users, Operation and Implications for the Estimation of Demand.” Transportation Research Part A 53: 36–52.
- TRB. 2014. “Transit Capacity and Quality of Service Manual.” Transit Cooperative Highway Research Program (TCRP) Report 165. Transportation Research Board.
- Wardman, M., and G. Whelan. 2011. “Twenty Years of Rail Crowding Valuation Studies: Evidence and Lessons From British Experience.” Transport Reviews 31 (3): 379–398. doi: 10.1080/01441647.2010.519127
- Xie, X., and F. Leurent. 2017. “Estimating Distributions of Walking Speed, Walking Distance and Waiting Time with Automated Fare Collection Data for Rail Transit.” Transportation Research Procedia 22: 45–54. doi: 10.1016/j.trpro.2017.03.006
- Yap, M., O. Cats, and B. van Arem. 2020. “Crowding Valuation in Urban Tram and Bus Transportation Based on Smart-Card Data.” Transportmetrica A: Transport Science 16 (1): 23–42. doi: 10.1080/23249935.2018.1537319
- Zhang, Y., E. Jenelius, and K. Kottenhoff. 2017. “Impact of Real-Time Crowding Information: A Stockholm Metro Case Study.” Public Transport 9 (3): 483–499. doi: 10.1007/s12469-016-0150-y