
 ?Mathematical formulae have been encoded as MathML and are displayed in this HTML version using MathJax in order to improve their display. Uncheck the box to turn MathJax off. This feature requires Javascript. Click on a formula to zoom.
Abstract
Public transport is one of the most disrupted sectors of the COVID-19 pandemic with reported ridership drops up to 90% in majorly affected countries. As many government authorities strive to partially resume activities, public transport operators are in an urgent need for models that can evaluate the impact of different social distancing policies on operational and passenger-related costs. In this study, we introduce a mixed-integer quadratic programming model for the redesign of public transport services considering the operational, passenger, and revenue loss-related costs by evaluating the effects of different social distancing policies. Our model is applied at the metro network of Washington DC and provides optimal redistribution of vehicles across lines for different social distancing scenarios. This model can be used as a decision support tool by other policymakers and public transport operators that are in need of evaluating the costs related to the implementation of different social distancing policies.
1. Introduction
The spread of COVID-19 has forced public authorities to implement strict distancing measures in closed spaces, such as schools, shops, working places, and public transport. The COVID-19 epidemic was first reported to the World Health Organization (WHO) on 31 December 2019 and it was recognized as a pandemic on 11 March 2020 (WHO Citation2020). Public transport is one of the most disrupted sectors of the COVID-19 pandemic with early estimates suggesting that the drop has been as much as 80–90% in major cities in China, Iran and the US, and as much as 70% for some operators in the UK (UITP Citation2020).
Several public transport operators have reduced their service span (e.g. have canceled night services), have reduced service frequencies, and have closed selected public transport stations (Tirachini and Cats Citation2020; Gkiotsalitis and Cats Citation2020). For example, Transport for London (TfL) has suspended the night tube service and closed 40 metro stations that do not interchange with other lines (TfL Citation2020). Similarly, the Washington Metropolitan Area Transit Authority (WMATA) closed 19 metro stations out of 91 and requested all passengers to wear a cloth face-covering (WMATA Citation2020b). In addition, it has reduced the service frequencies from 10 trains per hour to 3 or 4 trains per hour during peak hours and has imposed early rail closures at 9pm (WMATA Citation2020a).
Government authorities propose social distancing rules ranging from 1- to 2-m distancing in closed spaces because large droplets do not travel further than 2 m (Bahl et al. Citation2020; Jarvis et al. Citation2020). Consequently, public transport service providers have to re-design their services while considering the local distancing regulations. This calls for the development of novel methods for managing the limited capacity available and allocating resources accordingly so as to minimize the ramifications of the newly imposed constraints driven by public health considerations.
The limited capacity implied by the corona-related distancing measures requires the reallocation of public transport resources so as to cater most efficiently and effectively for the prevailing demand patterns while maintaining the functionality of the public transport system. Notwithstanding this, even when all available resources (vehicles, drivers) are deployed, it is expected that not all passenger demand can be absorbed along the busiest service segments. Determining the optimal reallocation of service resources, which also implies the determination of which demand segments may not be satisfied, is not trivial. Most public transport networks are denser in their high-demand core and become thinner as they branch out. During peak periods, passenger load levels in the core of the network are often such that it is not possible to safely transport all passengers. Moreover, passengers boarding at the edges of the central area may not be able to board as the occupancy level is already approaching the new corona-era capacity standard, leaving many stranded passengers. Should one cater for the long-distance low-volume travel from the branches to the core and vice-versa or for the short-distance high-volume demand within the network core?
Existing public transport network design (Mandl Citation1980; Ceder and Wilson Citation1986; Pattnaik, Mohan, and Tom Citation1998; Borndörfer, Grötschel, and Pfetsch Citation2007; Szeto and Wu Citation2011; Ul Abedin et al. Citation2018) and frequency setting (Gkiotsalitis and Cats Citation2018; Sun and Szeto Citation2019; Gkiotsalitis, Wu, and Cats Citation2019) methods cannot answer the above-mentioned research question because they consider only the trade-off between operational costs (e.g. running costs, in-vehicle occupancy levels) and passenger-related costs (e.g.waiting times at stations, total trip travel times). Thus, these models do not account for the implications of the implementation of social distancing measures and cannot, therefore, support public transport service providers in the planning of their services in the era of COVID-19.
To this end, we develop a method that supports the re-design of mass transit services in the context of complying with COVID-19 distancing measures. More specifically, we formulate and solve a network-wide model that can set the optimal frequencies of services lines under different social distancing scenarios. The proposed model extends on the classic trade-off between operational-related and passenger-related costs by considering the revenue losses associated with the unaccommodated passenger demand when complying with the distancing measures. Our network-wide frequency setting model can be used by public transport operators that seek to re-design their services under different distancing scenarios and investigate their performance in terms of passenger waiting time costs, operational costs, in-vehicle occupancy levels, violations of distancing standards, and revenue losses due to denied boarding. In this study, our objective is to develop a frequency planning model that can be applied when the passenger demand has almost returned to its pre-pandemic levels yet public transport operators need to comply with the social distancing regulations to avoid the spreading of the virus.
The remainder of this study is structured as follows: in Section 2 we review frequency setting models and introduce the well-established model of Furth and Wilson (Citation1981) which is adopted and adapted in this study. Section 3 presents our network-wide frequency setting model that considers the impacts of distancing measures. Our model is formulated as a mixed-integer nonlinear program (MINLP) and it is reformulated to an easier-to-solve mixed-integer quadratic program (MIQP) that can be applied to different case studies. In our case study (Section 4), we apply our model to compute the optimal service frequencies of the Washington DC metro lines under different distancing policies (no distancing, 1-m distancing, 1.5-m distancing, 2-m distancing). In addition, we investigate the impact of different distancing policies on operational costs, passenger-related costs, vehicle occupancy levels, and revenue losses due to denied boarding. This is instrumental for public transport service providers that need to plan their operations while taking into consideration public health risks and the operational/passenger-related costs, as elaborated in our discussion (Section 5).
2. Literature review and baseline frequency setting model
In this study, we propose a frequency setting model for planning the frequencies of service lines under the pandemic-imposed capacity limitations. The setting of service frequencies is performed at the tactical planning stage and it is followed by the timetabling (Cao and Ceder Citation2019; Su et al. Citation2019) and the operational control stages that might include short-turning (Tirachini, Cortés, and Jara-Díaz Citation2011), stop-skipping (Gkiotsalitis Citation2021), vehicle insertion or bus holding options (Gkiotsalitis Citation2020a; Gkiotsalitis and Van Berkum Citation2020; Gkiotsalitis Citation2020b). These additional operational control options are described in the literature review paper of Gkiotsalitis and Cats (Citation2021). Frequency setting models determine the allocation of the available fleet to different line services by considering the trade-off between productivity and operational costs (Ibarra-Rojas et al. Citation2015). Earlier works were limited to determining the frequency of a single line at a time (Furth and Wilson Citation1981; Ceder Citation1984, Citation2002). Ceder (Citation1984) proposed closed-form expressions that do not need to solve complex mathematical programs when determining the frequency of a single line (namely, the maximum load and the load profile methods).
In the last decade, a series of models have been proposed for setting service frequencies network-wide by determining the optimal resource allocation subject to limited resources. Yu, Yang, and Yao (Citation2010) proposed a bi-level programming model for the frequency setting problem which determines the optimal frequencies by minimizing the total travel time of passengers subject to overall fleet size limitations. The optimal frequency setting and allocation of a mixed-fleet was considered by Cats and Glück (Citation2019) and dell–Olio, Ibeas, and Ruisánchez (Citation2012). Using meta-heuristics, the frequency setting problem was integrated with the route design by Szeto and Wu (Citation2011) and Arbex and da Cunha (Citation2015). Cipriani, Gori, and Petrelli (Citation2012) also addressed the frequency setting problem as an exercise of balancing the passenger demand with the available supply. Verbas and Mahmassani (Citation2013), Verbas et al. (Citation2015), Verbas and Mahmassani (Citation2015) and Gkiotsalitis, Wu, and Cats (Citation2019) developed frequency setting models that consider flexible virtual lines (e.g. short-turning/interlining lines) to exploit the available vehicle/driver resources as much as possible. The works of Delle Site and Filippi (Citation1998) and Cortés, Jara-Díaz, and Tirachini (Citation2011) also focus on generating short-turning lines to serve the excessive demand at crowded line segments.
In this study we adopt the model formulation proposed by Furth and Wilson (Citation1981) as a baseline. This formulation is limited to a single line and considers the operational costs expressed by the number of vehicles required and the passenger-related costs expressed by the total passenger waiting times.
To describe the approach of Furth and Wilson (Citation1981), let us consider a time period of 1 h and a number of available vehicles, N. Let also x be the number of vehicles allocated to the service line and f the resulting frequency. Finally, let T be the round-trip travel time and the expected passenger demand between the origin station s and the destination station y within the 1-h time period (note that
corresponds to the hourly passenger arrival rate). Then, the optimal service frequency is determined by the model of Furth and Wilson (Citation1981) by solving the following mixed-integer nonlinear program (MINLP):
(1)
(1)
(2)
(2)
(3)
(3)
(4)
(4)
(5)
(5)
(6)
(6)
The objective function of the above program minimizes two components: (i) Wx which is the operational cost expressed by the number of assigned vehicles x multiplied by a weight factor W associated with the cost of operating an extra vehicle, and (ii) which is the passenger-related cost expressed by the number of passengers traveling between each origin-destination pair sy multiplied by the inverse of the service frequency f (note that the higher the service frequency, the less passengers
will have to wait at stations thus reducing the passenger-related costs).
Constraint (Equation2(2)
(2) ) ensures that we will not assign more vehicles than the total number of vehicles available, N, constraint (Equation3
(3)
(3) ) ensures that the selected frequency is not higher than the maximum allowed frequency, constraint (Equation4
(4)
(4) ) ensures that the service frequency is lower than the number of vehicles divided by the round-trip travel time. Constraint (Equation5
(5)
(5) ) ensures that each line is operated by a non-negative, integer number of trains and constraint (Equation6
(6)
(6) ) that the determined frequency can only take values greater than 1 vehicle per hour. In the next section, we expand the approach of Furth and Wilson (Citation1981) to a network-wide frequency settings problem by allowing the redistribution of vehicles among lines and adding elements to the problem formulation in order to account for the impact of distancing measures. The main extensions of our work are:
we consider multiple lines solving the frequency setting problem at the network-wide level, and not at the single-line level;
we explicitly model the pandemic-imposed capacity limits and the safety-related constraints when multiple lines use the same track (arc);
we explicitly model the revenue losses from refused passenger trips due to the pandemic-imposed capacity limits;
we incorporate an assignment step to allow passengers to use alternative lines running along overlapping corridors to arrive at their final destination.
3. Network-wide frequency setting model that considers distancing
3.1. Model formulation
Let us consider a set of lines operating in a metro network. Each line l serves a number of metro stations
. Let
be the expected passenger demand between station
and station
of line l within an 1-h period (corresponding to the passenger arrival rate). Before introducing our nomenclature, we list the main assumptions of our study:
The passenger arrival rate
is stable within each 1-h period of the day. That is, passenger arrivals at stations are uniformly distributed within the 1-h period (see Furth and Wilson Citation1981; Fu and Yang Citation2002).
The obtained passenger demand patterns from historical data are inelastic to the changes made in service frequencies.
Passengers may choose the rail car of preference for their boarding (e.g. a central rail car or a rail car on a convenient spot within close proximity to an egress or ingress mode) as long as this rail car does not reach its pandemic-imposed capacity limit.
The detailed nomenclature of our network-wide frequency setting model that considers distancing measures is presented in Table .
Table 1. Nomenclature.
Let be the number of trains assigned to each line
within a certain time period. Let also
be the round-trip travel time of line l. Then, the hourly frequency of line l should satisfy the inequality constraint (Equation7
(7)
(7) ) because the service frequency is limited by the number of assigned vehicles to line l:
(7)
(7)
In addition, the number of vehicles of all lines that pass arc
over the course of 1 h should not exceed the maximum permitted number of vehicles to ensure safe headways between trains operating along the same corridor (i.e. we cannot allow trains operating too close to each other because tracks are split into blocks into which only one train can enter at a time due to traffic safety constraints). That is,
(8)
(8)
Next, let be the average train load of each train serving line l when it departs from station s. We hereby assume that:
passengers within each train try to maintain the maximum possible distance between each other,
and all trains serving line l have the same capacity,
This implies a new corona-era capacity limit, , where
is the maximum train load for trains of line l below which all passengers can keep a safe distance with each other. This corona-era capacity limit should not be exceeded at any station to ensure that the risk of COVID-19 infections is minimized. This can be expressed by the following inequality constraint:
(9)
(9)
If is the actual passenger demand between stations s and y that can be accommodated by the allocated trains to line l without exceeding the corona-era capacity limit, then
(10)
(10) where
is the unaccommodated passenger demand that should be served outside our metro system. The passenger demand that is not accommodated by the metro system represents a loss. When refusing to accommodate demand
, the public transport service provider incurs a loss. From a societal perspective this loss can mean reduced accessibility. From the service provider perspective this may mean offering a compensation, arranging alternative means of transport, or simply the revenue loss of ticket sales. We hereby assume that the loss is proportional to the travel distance and we adopt the distance-based fare as a proxy of the loss per unserved passenger-km. If
is the distance between stations s and y of metro line l, the operator will lose a revenue of
because
passengers are refused service and M is the average ticket fee per km traveled. Then, our objective function for the network-wide frequency setting problem that considers social distancing becomes:
(11)
(11)
The first term is the cost of operating the vehicles, the second term, , is the cost related to passengers' waiting times and the third term,
, is the cost of the revenue losses associated with the passengers that are refused service. The objective function is formulated as a compensatory monetary term and expresses a generalized cost. Considering the above formulation, the mathematical program for the network-wide frequency setting problem that considers distancing measures is formulated as follows:
(12)
(12)
(13)
(13)
(14)
(14)
(15)
(15)
(16)
(16)
(17)
(17)
(18)
(18)
(19)
(19)
(20)
(20)
(21)
(21)
(22)
(22)
Note that constraint (Equation13(13)
(13) ) ensures that the number of all assigned trains within our time period does not exceed N. In addition, constraint (Equation17
(17)
(17) ) determines the train load when a train departs the terminal as the number of passengers that board at station 1 and will alight at any other station y within our 1-h time period,
, divided by the hourly frequency,
. Similarly, the recursive equation (Equation18
(18)
(18) ) determines the train load when a train belonging to line l departs from station
. This is a passenger flow conservation equation where the train load is equal to the train load when departing from the previous station,
, minus the number of passengers that alight at station s,
, plus the number of passengers that board at station s and will alight at any other station y>s of line l. Finally, constraint (Equation20
(20)
(20) ) ensures that the sum of expected hourly boardings of all lines that serve the origin-destination pair
and
is equal to the observed hourly passenger arrival rate at station s for passenger whose destination is y. This constraint allows distributing passengers over different lines that serve the origin-destination pair
in order to balance the passenger load among overlapping lines.
The mathematical program for the network-wide frequency setting problem that considers distancing measures, , is a mixed-integer nonlinear programming problem (MINLP) because of its fractional objective function and its fractional constraints (Equation17
(17)
(17) ) and (Equation18
(18)
(18) ).
3.2. Reformulation to a mixed-integer quadratic program (MIQP)
The MINLP problem can be transformed to an easier-to-solve mixed-integer quadratic program (MIQP) that neither contains a fractional objective function nor fractional constraints. Let us consider a line headway of
. Then, the fractional constraint in Equation (Equation17
(17)
(17) ) becomes
. In addition, the fractional constraint (Equation18
(18)
(18) ) becomes
.
Constraint (Equation14(14)
(14) ) is transformed into the following quadratic constraint:
. Finally, the objective function takes the following form:
(23)
(23) where the headway of each line l,
, is expressed in minutes and it can receive values from the set
given that the service frequencies receive values from set
. This reformulation results in the following MIQP:
(24)
(24)
(25)
(25)
(26)
(26)
(27)
(27)
(28)
(28)
(29)
(29)
(30)
(30)
(31)
(31)
(32)
(32)
(33)
(33)
(34)
(34)
4. Model application
4.1. Case study description
We apply our model to the case study of the Washington DC Metro system of the Washington Metropolitan Area Transit Authority (WMATA). It is a rapid transit system serving the Washington metropolitan area in the United States. The network consists of 6 lines, 91 metro stations. The metro system serves the District of Columbia, as well as several jurisdictions in the states of Maryland and Virginia. It is the second busiest rapid transit system in the United States with 295 million passenger trips in 2018 (WMATA Citation2019a). In 2019, the average weekday ridership was 626 thousand trips (WMATA Citation2019b). Passengers validate their smart card (SmartTrip) upon entering an origin station and leaving a destination station, and the fee is determined based on the traveled distance of the origin-destination combination. The network configuration consisting of the six metro lines is presented in Figure .
Figure 1. Washington DC metro network map. Source: www.wmata.com
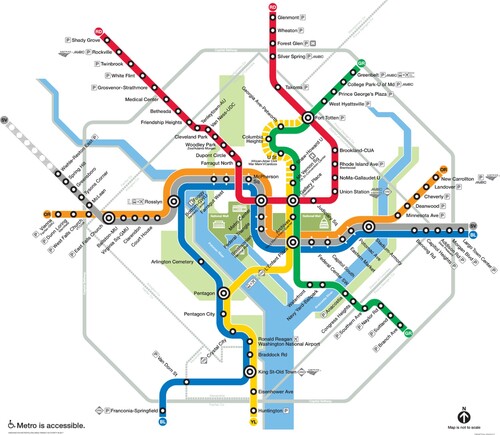
Due to infrastructure capacity limits, the maximum allowed frequency per track segment is vehicles per hour for each arc a, resulting in a minimum permitted headway of 2 min at common track corridors. From Figure one can note that there are several track corridors that are traversed by vehicles serving more than one line. For the purpose of our case study, we assume the availability of N = 140 trains. Table provides information on each of the service lines, including the number of stations, total bi-directional track length, and the names of the terminal stations.
Table 2. Terminals and line distances.
In order to investigate the impact of distancing measures, we concentrate on the rush hour (8:00–9:00 am) of a typical weekday. In particular, we examine the need to deploy additional trains and possibly refuse boardings. The expected hourly rate of passengers arriving at station s of line l and destined to station y is derived from the analysis of historical smart card data with complete information regarding passenger boarding and alighting locations from 20 working days in September 2018. The line-specific origin-destination matrices have been inferred using the origin, destination, and transfer inference (ODX) method as detailed in Sánchez-Martínez (Citation2017). We use peak demand data from the pre-pandemic era because our objective is to investigate the effect of our frequency planning model when the passenger demand has almost returned to its pre-pandemic levels yet there is still a need to comply with the social distancing regulations.
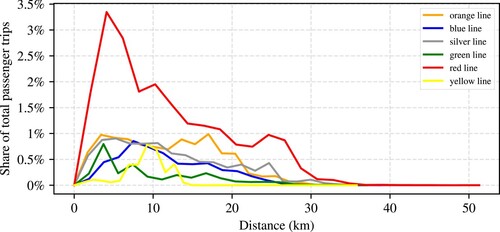
The distances traveled by each of the metro lines vary considerably. Figure shows the share of passenger trips of a certain traveled distance for each of the lines. This share is calculated as the number of passenger trips of a line for a specific travel distance divided by the total number of trips performed by all lines. As can be seen in Figure the Red line has up to three times more passenger trips than other lines and passengers trips on the Red, Orange and Silver lines travel longer distances than those on the Blue, Yellow and Green lines.
Figure 2. Share of passenger trips of each metro line from 8 am to 9 am with respect to the traveled distance.
The values of the remaining model parameters are given in Table . Each metro train consists of 6–8 rail cars, with an average maximum capacity of 1700 people. During the morning period (5 am–12 pm) a metro train carries an average of 133 travelers at any given time. This value, however, varies greatly with some central segments reaching capacity limits. Assuming that passengers are evenly spaced across platforms, each train operating in any line can carry only
people at any given time to satisfy a 1-m distancing requirement,
to fulfill a 1.5-m distance, and
to comply with a 2-m distance. These values are estimated using the calculation made in Krishnakumari and Cats (Citation2020). In this work the effective capacity under each social-distancing requirement is calculated based on the total square meters of each train car, the number of cars per train and the total area required per person to maintain the distance-keeping regulations. In reality, passenger crowding may vary also among rail cars as shown in Peftitsi, Jenelius, and Cats (Citation2020). Such variations may result in an under utilization of the limited capacity available, further reducing the effective capacity.
Table 3. Parameter values.
Passengers' value of time in our case study is per hour, or, equivalently, 24.4 cents per minute (based on the value of travel time reported in White (Citation2016) and adjusting the value by 1% per year). In addition, we have two parameters W and M corresponding to the operational cost of using an extra train and the cost associated with the travel distances of passengers who are refused service, respectively. The value of parameter W depends on the preferences of the metro operator since some operators might be willing to use all their available trains to reduce the passenger waiting times, whereas other operators might seek an economically beneficial trade-off between operational costs and passenger waiting times. We tested our model with different values of W and selected a cost of
per extra train since this cost returns the same train allocation to lines when solving program
for the case of no distancing (i.e. normal capacity levels) as the planned train allocation actually performed by the metro operator. Further, the passenger fare at the metro system depends on the travel distance and the time period (peak/off-peak periods). The 8 am–9 am is a peak hour and the fare cost per passenger is found to have an average value of
per km traveled.
4.2. Scenario design and implementation
The topic of distancing is currently contested as the transmission of COVID-19 is not yet well characterized. It is likely to be similar to SARS, which was spread by contact, droplet, and airborne routes (Yu et al. Citation2004). The World Health Organization and most countries recommend an 1.5–2-m social distancing. In a study with 94 patients of influenza, Bischoff et al. (Citation2013) showed that the virus can be transmitted up to ∼1.9 m from patients during non-aerosol-generating patient-care activities. It is important to note that increasing the distance among passengers does not proportionally decrease the probability of transmitting COVID-19.
To assess the impact of distancing measures, we consider the following 4 scenarios:
the do-nothing scenario that does not consider distancing measures and can utilize the full capacity of 1700 passengers per train;
the 1-m distancing scenario that allows train loads of up to 703 passengers per train;
the 1.5-m distancing scenario that allows train loads of up to 312 passengers per train;
the 2-m distancing scenario that allows train loads of up to 176 passengers per train.
We solve our MIQP model in program using Gurobi 9.0.3. The software code of our mathematical model is programmed in Python 3. Gurobi 9.0.3. is an optimization solver which is appropriate for mixed-integer quadratically constrained programs and it has an interface with Python (the gurobipy module). Our numerical experiments are executed in a general-purpose computer with Intel Core i7-7700HQ CPU @ 2.80GHz and 16 GB RAM. To facilitate the reproduction of our model to other networks, its source code is publicly released at GitHub (Citation2020).
4.3. Results and analysis
The objective function score(s) of the solution of each scenario as well as the computation times are presented in Table .
Table 4. Objective function value of the respective solution, iterations until convergence, and computational costs.
Note that the optimal score of the objective function for cases III and IV increases significantly in Table because for such social distancing cases we have unserved passengers and revenue losses despite deploying all available trains. The decision variable values in the optimal solutions under each distancing scenario are reported in Table and present the allocated vehicles per line and the resulting service headway.
Table 5. Assigned trains, , and headway (in minutes),
, per line
at each one of the social distancing scenarios.
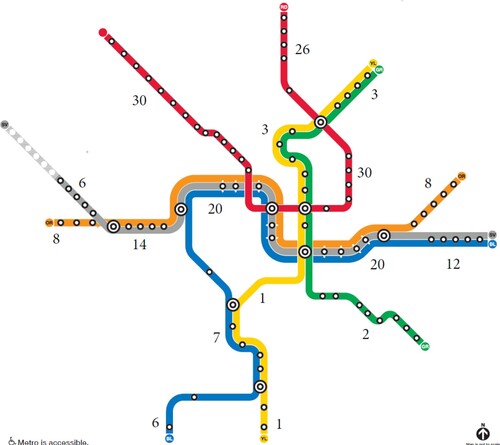
In case IV we deploy 80 trains to the red line because it has the highest passenger demand. The red line does not have an overlapping corridor with any other line and it requires more trains because its passengers cannot use alternative lines. The number of vehicles passing different arcs over 1 h in the worst case (case IV where we deploy all vehicles) is presented in Figure . Even though all vehicles are deployed, no arc is visited by more than 30 vehicles per hour because of our safety-imposed frequency per arc of 30 vehicles per hour (see constraint (Equation8(8)
(8) )).
Figure 3. Joint vehicle frequency per track segment expressed in vehicles per hour.
From Table one can note that at the do-nothing case we only deploy 62 trains out of the . The same passenger demand requires the utilization of 122 trains in the case of 1-m distancing (case II). Finally, scenarios III and IV require the deployment of all available trains.
In addition to the increase in operational costs due to the deployment of more vehicles and train drivers, a number of passengers are also refused service in scenarios III and IV. In Figure we present the train load at each station for each one of the six lines. The normal vehicle capacity of passengers is not reached at the base case scenario once the fleet is optimally allocated. It can also be observed that the optimal allocation results with trains loads not exceeding 703 passengers per train on the Green line in the base case (scenario I). Consequently, there is sufficient residual capacity to also accommodate the demand when subject to 1-m distancing (scenario II). In contrast, all other lines require re-allocating trains to ensure that the new capacity limit is not violated when switching from scenario I to scenario II, as can be seen in Table .
Figure 4. Passenger load of each train operating from 8 am to 9 am at each metro station in scenarios I, II, III and IV. A load of 176 passengers ensures 2-m distancing, 312 an 1.5-m distancing, 703 an 1-m distancing, whereas 1700 indicates the nominal capacity.
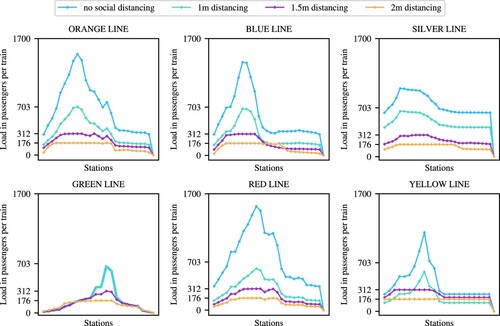
As specified in the problem constraints, the optimal solution for case II does not allow train loads of more than 703 passengers, for case III of more than 312, and for case IV of more than 176. This results in different train occupancy levels for each distancing scenario. Let the seated train occupancy be defined as the train load divided by the number of seats (in our case study, each train has available seats):
(35)
(35)
The average train occupancy level per line for each one of the distancing scenarios is presented in Table . The occupancy level averaged over all line segments ranges in the optimal solution for the base case from 30% for the Green line to 125% for the Yellow line. A seated occupancy of more than 100% indicates that all seats are occupied and we have a number of standees. These levels drop to 19–28% for all lines when complying with 2-m distancing (scenario IV).
Table 6. Average seated occupancy for each distancing scenario.
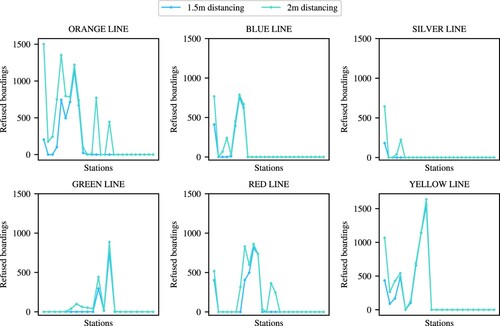
When enforcing distancing measures of 1.5- or 2-m, even after optimally reallocating the fleet, some passengers are refused service. In Figure we report the number of refused boardings at each metro station for the 1.5- and 2-m distancing policies. The Orange and Yellow lines exhibit the highest numbers of refused passenger boardings. Note that allocating more trains to the service lines is not possible given that we utilized all 140 trains in both the 1.5- and 2-m social distancing scenarios.
Figure 5. Refused passenger boardings at each station during the 8–9 am period in 1.5- and 2-m distancing scenarios-
To summarize the results of the impact of considering social distancing in the planning phase of metro operations, we use the following key performance indicators:
the average value of the maximum possible passenger waiting times,
the number of trains that are needed to operate the metro service, which indicate the operational costs,
the average train occupancy,
the number of instances where passengers cannot maintain a distance of at least 1.5 m from each other,
the number of passengers who are refused service multiplied by their traveled distance,
the number of passengers who are refused service,
5. Discussion and conclusion
We propose a network-wide model that can set the optimal frequencies of services lines under different distancing scenarios and apply it to the case study network of the Washington DC metro. The model determines the optimal fleet allocation while considering unsatisfied demand in the event that not all demand can be absorbed due to the varying capacity limits of different distancing policies.
The results of our model indicate that the normal capacity limit is not binding in the optimal solution for the base case scenario with no distancing requirements. Moreover, all passenger demand can be satisfied when deploying 62 out of the 140 trains available so as to optimally balance between the operational costs and the passenger waiting times at stations. Furthermore, it is possible to comply with the 1m distancing requirements while still accommodating all passengers by increasing the service frequency, hence requiring a larger fleet size of 122 vehicles. This also yields shorter passenger waiting times. This does imply, however, that in about 75 instances, a distancing of less than 1.5 m occurs, potentially inducing public health risks (see the graph of the key performance indicator in Figure ).
Figure 6. Values of key performance indicators under different social distancing scenarios.
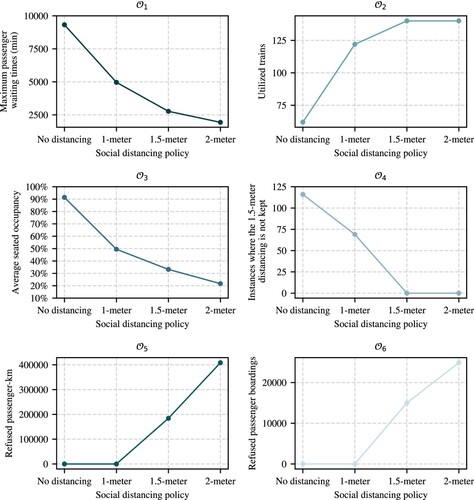
Stricter distancing policies come at a greater cost. Enforcing 1.5 m distancing requires deploying the maximum number of trains assumed available in our case study. Even though the entire fleet of 140 vehicles is utilized, 15,002 passenger-trips of more than 184,124 passenger-km cannot be accommodated. These numbers increase by more than half (24,869 pass trips) and almost two-fold (408,444 pass-km), respectively, when imposing 2 m distancing. In the latter case, the average train occupancy considering only the seated capacity plummets below 30% for all metro lines (see Table ).
As can be expected, our model allocates as many vehicles as possible to the most heavily-utilized line (i.e. Red line) given the safety-related 30-min minimum arc frequency constraint. In contrast, for some other lines (e.g. Yellow), there are more allocated vehicles in the scenario with 1m distancing than in the scenarios with 1.5 and 2 m distancing where more vehicles are deployed (see Table ). This is an interesting finding since one might have expected that the number of trains assigned to each line will increase (or at least will not decrease) when allocating an overall larger fleet and imposing stricter capacity constraints. However, when the permitted vehicle capacity is enough to satisfy the passenger demand (i.e. in the 1m scenario where we allocate only 122 out of the 140 available trains), the relatively lightly-utilized lines receive more vehicles to reduce passenger waiting times at stations since this is one of our main objectives. Notwithstanding, when the permitted capacity is reduced to comply with the distancing policies and we cannot anymore accommodate all passengers despite having employed all available resources, then vehicles are redistributed from lightly-utilized lines to heavily-utilized lines that already have to refuse many passengers (see Figure ). That is, the inability to accommodate the passenger demand in some lines results in the redistribution of vehicles because of the higher priority given to reducing the number of refused passengers compared to shortening waiting times.
Our model formulation strives to minimize the refused pass-km so as to mitigate the associated loss revenues or costs inflicted. The reallocation of trains over lines under stricter distancing policies is hence not only driven by the wish to reduce the number of denied boardings, but more specifically the objective to reduce unsatisfied passenger-km. This implies that the model seeks to prioritize the allocation of resources to lines characterized by longer passenger trips over lines that are mostly used for shorter trips. This effect is visible in Table as vehicles are reallocated from lines characterized by short passenger trips (e.g. Green, majority of the trips are less than 10 km, see Figure ) to lines characterized by longer passenger trips (e.g. Red, many trips are between 10 and 30 km) when switching from 1.5 to 2 m distancing. This change in resource allocation is hence driven by the underlying demand patterns -- passenger volumes and travel distance.
The aforementioned findings of our network-wide frequency setting approach that considers distancing measures can support planning decisions made by public transport service providers in the phasing of exit strategies and the aftermath of the corona crisis. Model formulation strives to balance between operational, passenger, revenue loss, and health-risk related considerations. Depending on the local circumstances, planners and policymakers may assign different terms to the different objectives and compare the resulting performance under different distancing requirements. The model can also be used to dimension service supply for different demand levels during lock-down periods and potential changes associated with the outbreak and evolution of an epidemic.
Primary directions for further research pertain to refining and modeling the impact of refused demand. The cost associated with unsatisfied demand can be modified to account for aspects extending beyond revenue losses, such as reduced access to activities, customer retention effect, externalities caused by switching to using a car, or the cost of offering compensation or an alternative mean of transport. Future analysis may consider the equity implications of alternative solutions. The potential of partnerships with on-demand service providers to cater for the unsatisfied demand that exceeds the permitted capacity limits by offering them a (shared)ride as well as the operations of such services can possibly be the subject of further investigation.
Finally, although our frequency planning approach is implemented at the tactical planning stage, quasi real-time control approaches -- such as deadheading, stop-skipping or vehicle injection -- can be part of future research because they will require substantial changes regarding service provision that cannot be addressed directly at the frequency settings stage. Furthermore, we believe it is important to study next to supply management in the form of resource allocation, also measures such as real-time crowding information (Drabicki et al. Citation2021) to facilitate a more even distribution of passenger demand across services.
Acknowledgments
The authors thank Washington Metropolitan Area Transit Authority and in particular Jordan Holt for their invaluable cooperation and for providing the data that made this study possible.
Disclosure statement
No potential conflict of interest was reported by the authors.
References
- Arbex, Renato Oliveira, and Claudio Barbieri da Cunha. 2015. “Efficient Transit Network Design and Frequencies Setting Multi-objective Optimization by Alternating Objective Genetic Algorithm.” Transportation Research Part B: Methodological 81: 355–376.
- Bahl, Prateek, Con Doolan, Charitha de Silva, Abrar Ahmad Chughtai, Lydia Bourouiba, and C. Raina MacIntyre. 2020. “Airborne or Droplet Precautions for Health Workers Treating COVID-19?.” The Journal of Infectious Diseases 1–8.
- Bischoff, Werner E., Katrina Swett, Iris Leng, and Timothy R. Peters. 2013. “Exposure to Influenza Virus Aerosols During Routine Patient Care.” The Journal of Infectious Diseases 207 (7): 1037–1046.
- Borndörfer, Ralf, Martin Grötschel, and Marc E. Pfetsch. 2007. “A Column-generation Approach to Line Planning in Public Transport.” Transportation Science 41 (1): 123–132.
- Cao, Zhichao, and Avishai Avi Ceder. 2019. “Autonomous Shuttle Bus Service Timetabling and Vehicle Scheduling Using Skip-stop Tactic.” Transportation Research Part C: Emerging Technologies 102: 370–395.
- Cats, Oded, and Stefan Glück. 2019. “Frequency and Vehicle Capacity Determination Using a Dynamic Transit Assignment Model.” Transportation Research Record 2673 (3): 574–585.
- Ceder, Avishai. 1984. “Bus Frequency Determination Using Passenger Count Data.” Transportation Research Part A: General 18 (5–6): 439–453.
- Ceder, Avishai. 2002. “Urban Transit Scheduling: Framework, Review and Examples.” Journal of Urban Planning and Development 128 (4): 225–244.
- Ceder, Avishai, and Nigel H. M. Wilson. 1986. “Bus Network Design.” Transportation Research Part B: Methodological 20 (4): 331–344.
- Cipriani, Ernesto, Stefano Gori, and Marco Petrelli. 2012. “Transit Network Design: A Procedure and an Application to a Large Urban Area.” Transportation Research Part C: Emerging Technologies 20 (1): 3–14.
- Cortés, Cristián E., Sergio Jara-Díaz, and Alejandro Tirachini. 2011. “Integrating Short Turning and Deadheading in the Optimization of Transit Services.” Transportation Research Part A: Policy and Practice 45 (5): 419–434.
- Delle Site, Paolo, and Francesco Filippi. 1998. “Service Optimization for Bus Corridors with Short-turn Strategies and Variable Vehicle Size.” Transportation Research Part A: Policy and Practice 32 (1): 19–38.
- dell–Olio, Luigi, Angel Ibeas, and Francisco Ruisánchez. 2012. “Optimizing Bus-size and Headway in Transit Networks.” Transportation 39 (2): 449–464.
- Drabicki, Arkadiusz, Rafał Kucharski, Oded Cats, and Andrzej Szarata. 2021. “Modelling the Effects of Real-time Crowding Information in Urban Public Transport Systems.” Transportmetrica A: Transport Science 17 (4): 675–713.
- Fu, Liping, and Xuhui Yang. 2002. “Design and Implementation of Bus-holding Control Strategies with Real-time Information.” Transportation Research Record: Journal of the Transportation Research Board1791: 6–12.
- Furth, Peter G, and Nigel H. M. Wilson. 1981. “Setting Frequencies on Bus Routes: Theory and Practice.” Transportation Research Record 818 (1981): 1–7.
- GitHub. 2020. “Covid-19 Frequency Setting Model Source Code.” https://github.com/KGkiotsalitis/covid-19-frequency-setting-model.
- Gkiotsalitis, K. 2020a. “A Model for the Periodic Optimization of Bus Dispatching Times.” Applied Mathematical Modelling 82: 785–801.
- Gkiotsalitis, Konstantinos. 2020b. “Bus Holding of Electric Buses With Scheduled Charging Times.” IEEE Transactions on Intelligent Transportation Systems 1–12.
- Gkiotsalitis, Konstantinos. 2021. “Stop-skipping in Rolling Horizons.” Transportmetrica A: Transport Science 17 (4): 492–520.
- Gkiotsalitis, K., and O. Cats. 2018. “Reliable Frequency Determination: Incorporating Information on Service Uncertainty when Setting Dispatching Headways.” Transportation Research Part C: Emerging Technologies 88: 187–207.
- Gkiotsalitis, Konstantinos, and Oded Cats. 2020. “Public Transport Planning Adaption Under the COVID-19 Pandemic Crisis: Literature Review of Research Needs and Directions.” Transport Reviews1–19.
- Gkiotsalitis, K., and O. Cats. 2021. “At-stop Control Measures in Public Transport: Literature Review and Research Agenda.” Transportation Research Part E: Logistics and Transportation Review 145: 102176.
- Gkiotsalitis, K, and E. C. Van Berkum. 2020. “An Exact Method for the Bus Dispatching Problem in Rolling Horizons.” Transportation Research Part C: Emerging Technologies 110: 143–165.
- Gkiotsalitis, Konstantinos, Zongxiang Wu, and O. Cats. 2019. “A Cost-minimization Model for Bus Fleet Allocation Featuring the Tactical Generation of Short-turning and Interlining Options.” Transportation Research Part C: Emerging Technologies 98: 14–36.
- Ibarra-Rojas, O. J., F Delgado, R Giesen, and J. C. Muñoz. 2015. “Planning, Operation, and Control of Bus Transport Systems: A Literature Review.” Transportation Research Part B: Methodological 77: 38–75.
- Jarvis, Christopher I., Kevin Van Zandvoort, Amy Gimma, Kiesha Prem, Petra Klepac, G. James Rubin, and W. John Edmunds. 2020. “Quantifying the Impact of Physical Distance Measures on the Transmission of COVID-19 in the UK.” BMC Medicine 18 (1): 1–10.
- Krishnakumari, Panchamy, and Oded Cats. 2020. “Virus Spreading in Public Transport Networks: The Alarming Consequences of the Business as Usual Scenario.” https://www.linkedin.com/pulse/virus-spreading-public-transport-networks-alarming-usual-krishnan/.
- Mandl, Christoph E. 1980. “Evaluation and Optimization of Urban Public Transportation Networks.” European Journal of Operational Research 5 (6): 396–404.
- Pattnaik, S. B., S. Mohan, and V. M. Tom. 1998. “Urban Bus Transit Route Network Design Using Genetic Algorithm.” Journal of Transportation Engineering 124 (4): 368–375.
- Peftitsi, Soumela, Erik Jenelius, and Oded Cats. 2020. “Determinants of Passengers' Metro Car Choice Revealed Through Automated Data Sources: A Stockholm Case Study.” Transportmetrica A: Transport Science 16 (3): 529–549.
- Sánchez-Martínez, Gabriel E. 2017. “Inference of Public Transportation Trip Destinations by Using Fare Transaction and Vehicle Location Data: Dynamic Programming Approach.” Transportation Research Record 2652 (1): 1–7.
- Su, Shuai, Xuekai Wang, Yuan Cao, and Jiateng Yin. 2019. “An Energy-efficient Train Operation Approach by Integrating the Metro Timetabling and Eco-driving.” IEEE Transactions on Intelligent Transportation Systems 21 (10): 4252–4268.
- Sun, S, and W. Y. Szeto. 2019. “Optimal Sectional Fare and Frequency Settings for Transit Networks with Elastic Demand.” Transportation Research Part B: Methodological 127: 147–177.
- Szeto, Wai Yuen, and Yongzhong Wu. 2011. “A Simultaneous Bus Route Design and Frequency Setting Problem for Tin Shui Wai, Hong Kong.” European Journal of Operational Research 209 (2): 141–155.
- TfL. 2020. “Check the Latest Travel Information and Find Out How We're Responding to Coronavirus.” https://tfl.gov.uk/campaign/coronavirus-covid-.
- Tirachini, Alejandro, and Oded Cats. 2020. “COVID-19 and Public Transportation: Current Assessment, Prospects, and Research Needs.” Journal of Public Transportation 22 (1): 1.
- Tirachini, Alejandro, Cristián E. Cortés, and Sergio R. Jara-Díaz. 2011. “Optimal Design and Benefits of a Short Turning Strategy for a Bus Corridor.” Transportation 38 (1): 169–189.
- UITP. 2020. “Public Transport Authorities and COVID-19 Impact and Response to a Pandemic.” https://australia-newzealand.uitp.org/sites/default/files/V1_COVID-19%20impacts_AJ_v03.pdf.
- Ul Abedin, Zain, Fritz Busch, David Z. W. Wang, Andreas Rau, and Bo Du. 2018. “Comparison of Public Transport Network Design Methodologies Using Solution-quality Evaluation.” Journal of Transportation Engineering, Part A: Systems 144 (8): 04018036.
- Verbas, İ Ömer, Charlotte Frei, Hani S. Mahmassani, and Raymond Chan. 2015. “Stretching Resources: Sensitivity of Optimal Bus Frequency Allocation to Stop-level Demand Elasticities.” Public Transport 7 (1): 1–20.
- Verbas, İ Ömer, and Hani S. Mahmassani. 2013. “Optimal Allocation of Service Frequencies Over Transit Network Routes and Time Periods: Formulation, Solution, and Implementation Using Bus Route Patterns.” Transportation Research Record 2334 (1): 50–59.
- Verbas, İ Ömer, and Hani S. Mahmassani. 2015. “Exploring Trade-offs in Frequency Allocation in a Transit Network Using Bus Route Patterns: Methodology and Application to Large-scale Urban Systems.” Transportation Research Part B: Methodological 81: 577–595.
- White, V. 2016. “Revised Departmental Guidance on Valuation of Travel Time in Economic Analysis.” Office of the Secretary of Transportation, US Department of Transportation. transportation.gov/sites/dot.gov/files/docs/2016%20Revised%20Value%20of%20Travel%20Time%20Guidance.pdf.
- WHO. 2020. “Rolling Updates on Coronavirus Disease (COVID-19).” https://www.who.int/emergencies/diseases/novel-coronavirus-2019/events-as-they-happen.
- WMATA. 2019a. “Metro Snapshot.” https://www.wmata.com/about/upload/2019-Metro-Snapshot-Fact-Sheet.pdf.
- WMATA. 2019b. “Metrorail Ridership Grew by 20,000 Trips Per Weekday in 2019.” https://www.wmata.com/about/news/2019-Metrorail-ridership.cfm.
- WMATA. 2020a. “Covid-19 Service Information.” https://www.wmata.com/service/status/details/covid-operating-status.cfm.
- WMATA. 2020b. “Customers Should Wear Cloth Face Coverings on Metro.” https://www.wmata.com/service/status/details/covid-face-covering.cfm.
- Yu, Ignatius T. S., Yuguo Li, Tze Wai Wong, Wilson Tam, Andy T. Chan, Joseph H. W. Lee, Dennis Y. C. Leung, and Tommy Ho. 2004. “Evidence of Airborne Transmission of the Severe Acute Respiratory Syndrome Virus.” New England Journal of Medicine 350 (17): 1731–1739.
- Yu, Bin, Zhongzhen Yang, and Jinbao Yao. 2010. “Genetic Algorithm for Bus Frequency Optimization.” Journal of Transportation Engineering 136 (6): 576–583.