
ABSTRACT
Prediction of upcoming words facilitates language processing. Individual differences in social experience, however, might influence prediction ability by influencing input variability and representativeness. This paper explores how individual differences in social network size influence prediction and how this influence differs across linguistic levels. In Experiment 1, participants predicted likely sentence completions from several plausible endings differing in meaning or only form (e.g. work vs. job). In Experiment 2, participants’ pupil size was measured as they listened to sentences whose ending was the dominant one or deviated from it in either meaning or form. Both experiments show that people with larger social networks are better at predicting upcoming meanings but not the form they would take. The results thus show that people with different social experience process language differently, and shed light on how social dynamics interact with the structure of the linguistic level to influence learning of linguistic patterns.
Language processing does not consist of processing one word at a time in isolation. Rather, it exploits the linguistic and non-linguistic context to interpret incoming input. Much research has examined how reliance on the linguistic context allows us to predict incoming input and facilitates its integration. A less explored question is how people differ in their ability to exploit linguistic context. This paper investigates how individual differences in people’s social network size can shape their knowledge about language statistics, and thus influence their ability to correctly predict incoming speech.
Lexical prediction and integration
There is uncontroversial evidence that it is easier to process words that are predictable rather than unpredictable in context. For example, words are read more quickly when they are predictable (e.g. Kliegl, Grabner, Rolfs, & Engbert, Citation2004; Rayner, Slattery, Drieghe, & Liversedge, Citation2011; Smith & Levy, Citation2013). Thus truth is read faster in “Gary had become a compulsive liar. He just couldn’t seem to tell the truth about anything“ than in “Gary has some mental health issues. He just couldn’t seem to tell the truth about anything” (Rayner et al., Citation2011). Predictable words are also more likely to be skipped (e.g. Rayner et al., Citation2011). Furthermore, predictability has a gradient effect on the N400, an ERP component sensitive to ease of semantic integration, such that the more predictable a word is in a context, the smaller the N400 (e.g. Kutas & Hillyard, Citation1984).
Several recent theories suggest that the linguistic context not only facilitates processing at the moment of integration, but that it is also used to predict incoming input (e.g. Altmann & Mirković, Citation2009; Chang, Dell, & Bock, Citation2006; Kutas, DeLong, & Smith, Citation2011; Pickering & Garrod, Citation2007). This claim is supported by studies that show anticipatory looks towards likely referents according to the context. For example, when viewing a screen that shows, among others, a motorcyclist, a girl, a motorcycle and a carrousel, participants direct their gaze towards the motorcycle when hearing The man will ride but towards the carrousel when hearing The girl will ride (Kamide, Altmann, & Haywood, Citation2003). Furthermore, upon hearing a grammatical gender marker that does not fit the grammatical gender of the noun that is predicted in the context, listeners demonstrate an effect of syntactic incongruency, as reflected in a P600 component (van Berkum, Brown, Zwitserlood, Kooijman, & Hagoort, Citation2005; Wicha, Bates, Moreno, & Kutas, Citation2003). As the gender marked unit was the determiner or adjective preceding the noun it modified, these effects indicate that listener predicted the upcoming word.
Several accounts have been proposed regarding the nature and underlying mechanism of prediction. For example, Pickering and Garrod (Citation2007) propose that individuals covertly produce the upcoming linguistic unit, and then compare incoming input to their covert predictive productions. Other models also assume that learning occurs by comparing incoming input to the predicted input, and modifying representations in accordance to the prediction error (e.g. Chang et al., Citation2006). In general, Bayesian models of learning propose that comprehenders activate distributions of candidates for the upcoming linguistic unit according to their probability given the preceding context and the a-priori probabilities (Smith & Levy, Citation2008). The relative activation of different candidates can then influence interpretation and integration. Once the unit has been processed, priors are updated, and so are predictions for the next upcoming unit (e.g. Kleinschmidt & Jaeger, Citation2015).
Importantly, success at prediction and the ability to engage in prediction differ across individuals. For example, individuals with lower working memory and slower processing speed do not rely on predictive processing to the same degree, as indicated by fewer anticipatory looks at a target object when it is predicted by the grammatical gender of the preceding determiner (Huettig & Janse, Citation2016). Proficiency in a language has also been argued to influence individuals’ ability to anticipate upcoming input. For example, second language learners showed reduced sensitivity to the predictability of a word, as reflected in a reduced N400 effect for unpredictable words compared with monolinguals speakers (Martin et al., Citation2013).
Successful prediction, at all linguistic levels, requires both the ability to engage in prediction and relatively accurate knowledge of the statistics of the language. That statistical knowledge can range from knowledge of word frequency and grammatical structure frequency, to knowledge of phonotactic rules and their frequency or pragmatic choices, but across all linguistic levels, it encompasses familiarity with the distribution of different linguistic and communicative choices across the population and across linguistic contexts. Individual differences in executive function influence the ability to engage in prediction, while lower proficiency can influence both the ability to use prediction, as second language processing is more taxing than first language processing, and the accuracy of the knowledge that is relied on during prediction. Even among monolinguals, differences in past input could influence the accuracy of one’s knowledge, and therefore the success of the prediction process. This paper focuses on one relatively unexplored factor that can shape individuals’ knowledge of the language’s statistics, namely, individuals’ social network size.
Social network size and prediction
Social network size is defined here as the number of people someone regularly interacts with. It encompasses someone’s friends, but also relatives, co-workers, clients etc. In general, the larger the sample, the more representative it should be of the population, so people with larger social networks should know better the statistics of the language. One caveat is that this principle is true as long as the sample is independently and randomly sampled, yet our interlocutors are often neither randomly nor independently sampled. For example, we might be likely to interact with people from a specific geographical location, certain socio-economic status, certain age bands etc. Additionally, our interlocutors might know and interact with each other, especially if they are co-workers, friends, or family members, and therefore their language use, and the input we receive from them, would not independent. Perhaps due to this complex relation between social network size and sample representativeness, the few studies that looked at the effect of social network size on linguistic skills found mixed results. On the one hand, having a larger social network was found to lead to better speech perception and better global comprehension (Lev-Ari, Citation2016, Citation2018). For example, participants who reported interacting with more people a week were better at understanding restaurant reviews, as indicated by more accurate estimates of how many stars the reviewer assigned the restaurant. Similarly, the number of reviewers participants learned new words from influenced their ability to understand those words in the productions of new reviewers. That is, if participants were trained and tested on product reviews containing novel words composed by eight reviewers they were better at understanding new product reviews with novel words from new reviewers than if they were trained and tested on the same number of reviews, but composed by only two reviewers (Lev-Ari, Citation2016). In the case of speech perception, people with larger social networks were found to be better at understanding speech in noise (Lev-Ari, Citation2018). Computational simulations that were used to explore the mechanism underlying the boost in speech comprehension attributed the benefit to the greater variability in the input provided by larger social networks (Lev-Ari, Citation2018). This account aligns with previous experimental lab results that show that phonetic training with multiple talkers boosts learning more than phonetic training with fewer talkers, even when the amount of input is matched (Lively, Logan, & Pisoni, Citation1993; Rost & McMurray, Citation2009, Citation2010). Those results are also argued to reflect the benefit to input variability. While variability is not the same as representativeness, when people are exposed to unrepresentative input, it is often because they are exposed to input that is too homogeneous and does not represent all variation that exist in the community at large. This evidence then suggests that having a larger social network should lead to more representative and variable input, and therefore to more accurate knowledge of the statistics of the language.
At the same time, a recent study that examined the role of social network size at the lexical level found that it does not correlate with relevant variability, and correspondingly, does not predict performance (Lev-Ari & Shao, Citation2017). In particular, participants were tested on their ability to predict how college students and older adults would name pictures. All pictures were selected such that they would have at least two acceptable names (e.g. baby carriage and stroller). Three measures of network variability were used, including social network size and the age heterogeneity in the network. Results indicated that the two measures did not correlate, and it was only the latter that predicted the accuracy in participants’ predictions.
One interpretation of this pattern of results is that having a larger social network increases the variability and representativeness of the input at the phonological and semantic meaning levels, but not at the lexical form level. Consequently, it facilitates performance in speech perception and comprehension of restaurant and product reviews, but it does not boost prediction of lexical form. At the same time, there are many differences between the studies. For example, the studies at the phonological and semantic meaning level tested participants’ comprehension. In contrast, the study at the lexical form level tested participants’ prediction. It might therefore be the case that social network size boosts comprehension at all linguistic levels, but does not boost prediction at any level. Furthermore, differences might be due to measurement error or to unknown differences between the samples. The goal of the current studies is to examine whether the role of social network size indeed depends on the linguistic level. To do so, participants performed the same task, prediction, either at the lexical form level or at the semantic meaning level. Experiment 1 employed an explicit and off-line prediction task. Experiment 2 used pupil dilation to measure implicit online predictions. If the differences between the previous studies were due to differences in the linguistic level that was tested, these experiments should find that social network size predicts performance at the semantic meaning but not at the lexical form level. If, on the other hand, the differences between the previous studies were due to the measured skill or differences in the recruited sample, no difference should appear between the effect of social network size across the two types of items.
Experiment 1
Experiment 1 tested whether the role that social network size plays is different across different linguistic levels, such that a larger social network improves performance at the semantic meaning level, but not at the lexical form level. This was tested by presenting participants with a lexical prediction task that, depending on the nature of the item, can tap either the lexical form or the semantic meaning level. The task was multiple-choice sentence completion prediction. Participants were asked how the average Amazon Mechanical Turk respondent is most likely to complete the sentence. In the lexical form items, participants selected between synonyms, whereas in the semantic meaning items, each completion gave the sentence a different meaning. Participants’ responses were compared to the responses of M-Turk users in a norming study.
Norming study
The goal of the norming study was to know the distribution of responses for the different items. The sentences were taken from Lahar, Tun, and Wingfield’s (Citation2004) norming study, but were adapted from open-ended questions into multiple-choice questions to ensure that items fall neatly into “lexical form” or “semantic meaning” categories. The adaptation into multiple-choice questions constrains participants, as some of them might have preferred providing a response that does not feature among the multiple-choice options. As it is unknown whether the responses of people who would have provided a response that does not feature among the response options follows the same distribution as the rest of the responses, there was a need to re-norm the sentence completion questions.
Participants. Seventy native English speakers with USA IP addresses were recruited via Amazon Mechanical Turk. Participants’ age ranged from 19 to 73 years. The average age was 34 (SD = 10.3).
Stimuli. Forty-two sentences were selected from Lahar et al.’s (Citation2004) sentence completion norming study. Twenty-one “lexical form” items and 21 “semantic meaning” items were selected. “Lexical form” items were sentences for which most responses in Lahar et al. (Citation2004) were synonyms of each other, whereas most responses to the “semantic meaning” items differed from one another in meaning. These sentences were then turned into multiple-choice questions by providing four of the common responses that were originally provided for the item in Lahar et al. (Citation2004) and that fit the question type condition (lexical form/semantic meaning). In one case, the four provided responses were not the four most common responses but a set of synonyms that referred to one specific potential meaning. In a few cases, only three synonyms were spontaneously provided in Lahar et al. (Citation2004) for an item in the “lexical form” condition. In these cases, a fourth synonym was added. An example of a “lexical form” item is:
She called her husband at his _______________
job
office
work
workplace
None of his books made any ______________
impact
impression
money
sense
Responses were always provided in alphabetic order. Lexical form and semantic meaning items were intermixed in one fixed random order.
Procedure. Participants reported their age and then answered the 42 multiple-choice sentence completion sentences. They were asked to select the most appropriate response.
Results. Several items did not have one dominant response, but two or three responses that were of similar frequency. We therefore selected for the study a subset of 33 items (17 Lexical Form, 16 Semantic Meaning items), which had a clear dominant response. The proportion of responses that the dominant response for each item received ranged from 41% to 94% (M = 61%, SD = 13%) for the Lexical Form items, and from 44% to 90% (M = 64%, SD = 14%) for the Semantic Meaning items. While a few of the items were selected in fewer than half of the trials, the difference between the most and second most frequent responses was always at least 10 percentage points, and on average 35 percentage points for both the semantic and lexical items. It is important to note that the dominant response was often not the word with the highest word frequency. Only in 3 out of the 16 Semantic Meaning items, and in 8 out of the 17 Lexical Form items, was the dominant response also the most frequent of the four options according to Corpus of Contemporary American English (COCA). Therefore, responding correctly to the sentence completion questions in the prediction task (see below) cannot be done by picking the word with the highest frequency. Similarly, the dominant responses were rarely the most contextually diverse responses (Brysbaert & New, Citation2009) according to subtlexus: in only 5 out of the 17 Semantic Meaning items and 3 out of the 16 Lexical Form items was the most contextually diverse response also the dominant response (in one additional Lexical Form item the dominant response and one of the alternative were equally contextually diverse). Additionally, the frequency and contextual diversity of the most dominant responses did not differ across the Lexical Form and Semantic Meaning conditions (t < 1 for both).
Main experiment
Method
Participants. Two hundred-twenty-six native English speakers with USA IP addresses were recruited via amazon Mechanical Turk. Their average age was 35 (SD = 12.4).
Stimuli. Social Network Questionnaire. Participants were asked several questions about their social network, including how many people they talk to in a week, and for how long. They were specifically instructed to only count interlocutors with whom they converse for at least 5 minutes, and were asked to list all these interaction partners and their relation to them (e.g. relatives, friends). This questionnaire was a shorter version of the one used in Experiment 1 in Lev-Ari and Shao (Citation2017), and Lev-Ari (Citation2016), and the same as in Lev-Ari (Citation2017). It is available in the Supporting Information in Lev-Ari (Citation2017).
Sentence Completion task. The 33 items that passed the norming served as stimuli in this task (See Appendix A). Additionally, the stimuli included five catch items that were interleaved with the experimental items. The catch items were modified versions of items that did not pass the norming. Instead of including four common responses, these items included the most common response and three highly improbable responses. These items were included to ensure that participants read the questions before responding.
Procedure. Participants answered the social network questionnaire followed by the sentence completion questions from the norming study. Unlike the norming study, where participants were asked to select the best completion, this time participants were asked which sentence ending is the one that the average Amazon Mechanical Turk user would select. They were specifically told that they should select the response they believe most people would find most appropriate, even if it is different from the response they themselves find most appropriate. They were further told that their responses would be compared to the actual responses that another group of Amazon Mechanical Turk users provided when selecting the completion they find most appropriate.
Results
Three participants were correct on 50% or fewer catch trials. They were therefore excluded. Additionally, three participants estimated the number of hours they talk per week to be higher than the number of hours per week and gave atypically high estimates of the number of people they talk to each week. As it seemed possible that the estimate of number of interlocutors might be exaggerated and inaccurate as well, these participants were also excluded. One additional participant provided an extreme estimate of Social Network Size that was 19 (nineteen) SDs away from the average estimate provided by the other participants. That participant was therefore also excluded. Analyses were therefore run over 219 participants. Participants’ Social Network Size ranged from 0 to 100 (M = 15, SD = 16.9).
The data were analyzed with a mixed model logistic regression with Participants and Items as random factors, and Social Network Size, Type (Lexical Form, Semantic Meaning), and their interaction as fixed factors. Social Network Size was scaled. The random structure of the model included intercepts as well as all possible slopes. Results revealed an effect of Social Network Size at the base-level (Semantic Meaning; β = 0.09, SE = 0.04, z = 2.20, p < 0.03). There was also a non-significant trend towards an interaction between Social Network Size and Type (β = −0.09, SE = 0.05, z = −1.62, p = 0.1; See Appendix B for the full results). This analysis thus shows that previous results were not due to the tested skill – comprehension versus prediction – as Social Network Size predicts performance at the Semantic Meaning level even when it is tested with a prediction task. At the same time, the results are equivocal regarding whether the role of Social Network Size differs between the Lexical Form and Semantic Meaning levels. As this interaction is of the main goals of this study, the results were further investigated. In particular, it was examined whether particular items exerted undue influence. To test that, Cook’s D was calculated using influence.ME package in R (Nieuwenhuis, te Grotenhuis, & Pelzer, Citation2012). The test revealed four items with particularly high D.Footnote1 The same analysis was therefore run without these four items, leaving 29 items (15 Lexical Form, 14 Semantic Meaning). This analysis revealed the same effect of Social Network Size at the base-level (Semantic Meaning; β = 0.11, SE = 0.04, z = 2.55, p < 0.02), and, importantly, an interaction between Social Network Size and Type (β = −0.11, SE = 0.06, z = −1.96, p < 0.05; See and Appendix B).
Figure 1. The effect of Social Network Size on accuracy in predicting sentence completion by others, as dependent on semantic level (Lexical Form, semantic Meaning). The shaded regions show one standard deviation in each direction. Tick marks on the x-axis indicate the values of participants' Social Network Size.
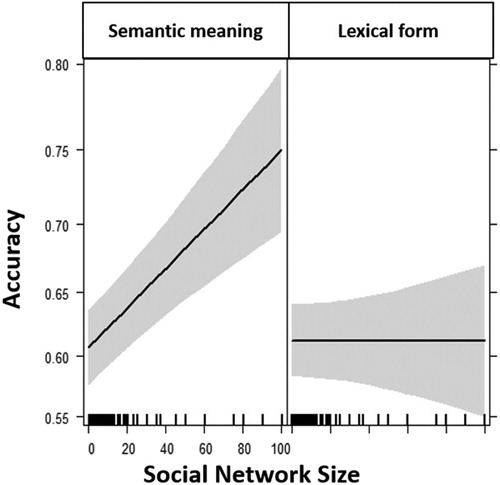
The results of this study, then, replicate the earlier studies by showing that having a larger social network boosts linguistic skills at the Semantic Meaning level but not at the Lexical Form level. These results thus confirm that the difference between the results of previous studies at the Semantic Meaning and Lexical Form levels are probably at least partly due to the different linguistic level they tap. They suggest that linguistic variants are distributed differently across the population at different linguistic levels, and that the optimal exposure for improving performance at different levels is therefore different. This will be further discussed in the General Discussion. Furthermore, by demonstrating this difference between linguistic levels with a prediction task, these results are also the first to show that having a larger social network can boost prediction at the meaning level.
suggests that performing the task at the Lexical Form level might have been more difficult than performing it at the Semantic Meaning level. However, this difference did not reach significance in the statistical model (p > 0.3), so it will not be further discussed. Importantly, even at the potentially more difficult Lexical Form level, performance was around 60%, which is well above chance (25%), indicating that in neither condition was there a floor effect.
The results of Experiment 1 allow better interpretation of previous results. It is less clear though what their relevance is for online language processing. Previous literature highlights the role of prediction in processing and learning. Explicit offline predictions, however, are quite different from online predictions and do not necessarily rely on the same mechanisms or even draw on the same knowledge base. Thus, while the results of Experiment 1 indicate that social network size influences the explicit knowledge that people have about the statistics of their language, studies that utilise online measures are required in order to link these differences to differences in processing. Another potential weakness of Experiment 1 is that the items in the Lexical Form condition were different from the items in the Semantic Meaning condition. Therefore, it cannot be excluded that the pattern of results is due to differences in the content of the sentences in the two conditions rather than to their linguistic level. Lastly, the original planned analysis did not reveal a significant interaction but only a main effect of social network size on performance. It was an unplanned test searching for influential items and their exclusion that led to the final pattern of results. Therefore, one should treat these conclusion with care. Experiment 2 addressed all these issues by trying to replicate the findings using an online measure, pupil dilation, and by modifying the design such that the same template sentences were used in all conditions and only the last word differed across conditions.
Experiment 2
The goal of Experiment 2 was the same as in Experiment 1, to test whether having a larger social network boosts performance at the semantic meaning level, but not at the lexical form level. Experiment 2, however, improved on Experiment 1 in two aspects. First, instead of relying on explicit offline predictions, Experiment 2 measured implicit online prediction, as reflected in pupil dilation. Pupil size is sensitive to cognitive effort (e.g. Kahneman & Beatty, Citation1966). Additionally, it has been found to increase upon reading or hearing incongruent or more complex linguistic material (e.g. Hyönä, Tommola, & Alaja, Citation1995; Just, Carpenter, & Miyake, Citation2003; Tromp, Hagoort, & Meyer, Citation2016) and it positively correlates with a word’s surprisal (Frank & Thompson, Citation2012). Therefore, the degree to which listeners exhibit pupil dilation reflects to what degree the incoming input fits with their prediction or deviates from it.
Another goal of Experiment 2 was to manipulate the linguistic level within items. In Experiment 1, the Lexical Form and Semantic Meaning items were different, and while they were similar in the frequency of the dominant response, and there is no reason to assume that they systematically differed from each other in contents or other elements, this cannot be fully ruled out. In Experiment 2, the base sentence in all conditions was the same, and only the last word differed. This was done by gathering sentence completion norms, and then creating triplets for each item based on these norms, such that the dominant response was substituted with a synonym in the Form-Deviation condition, and with a less common response that differs in meaning in the Meaning-Deviation condition. For example, the norming study showed that the dominant ending to the sentence, Hij weigerde om het toe te geven, maar de man was _____ (English: He refused to admit it, but the man was _____), is dronken (drunk). Therefore, two additional alternatives were created substituting dronken with either zat (drunk) or fout (wrong). As the sentences in the three conditions are identical in all but the last word, measuring surprise on the last word allows comparing to what degree participants predicted the meaning of the sentence’s final word versus its form.
Norming study
In order to test the influence of social network size on lexical prediction, it is necessary to know the predictability of the lexical items, that is, the distribution of sentence endings. Therefore, sentence completion norms were collected using Survey-Monkey Audience Design.
Participants. One-hundred-and-nine native Dutch speaker representative of the general Dutch population in terms of gender and age were recruited using an audience design company. Three respondents completed only few or none of the sentences.
Stimuli. Ninety-five sentences from Lahar et al.’s (Citation2004) English norms were translated into Dutch.
Procedure. Participants saw the sentences in random order. They were asked to complete them with the first word that came to mind.
Results. Examination of the results revealed that some participants occasionally skipped a sentence or provided an ending that was not a Dutch word. These responses were excluded. Each sentence therefore had between 96 and 103 valid responses with most sentences having 102 or 103 valid responses.
Once the norms were collected, triplets were created for 53 sentences, such that one ending was a frequent response (Dominant condition; e.g. dronken, English: drunk), another one was a synonym of the frequent response (Form-Deviation condition; e.g. zat, English: drunk), and another one was a less frequent response with a different meaning (Meaning-Deviation condition; e.g. fout, English: wrong). The responses in the Dominant and Meaning-Deviation condition were therefore always selected from responses that respondents provided. When possible, the word in the Form-Deviation condition was also selected from the provided responses, but when no synonym was provided, a synonym was generated. For both provided and generated synonyms, the target words were judged by two native Dutch speakers to have the same meaning in the context of the sentence. Sentences were used for triplets whenever there was a clear difference in frequency between the dominant response and the subordinate response for the Meaning-Deviation condition, as well as between the Dominant response and the response for the Form-Deviation condition. As the question format in this norming study allowed participants to enter any word they choose, the frequency of the dominant response varied (10%–85%) but was always higher than in the other conditions, with an average difference of 41 and 39 percentage points for the Form-Deviation and Meaning-Deviation conditions, respectively. The predictability in the Form-Deviation and Meaning-Deviation condition did not differ (t(104) < 1). Note that several views of prediction assume that prediction is not of a single word in an all-or-none fashion, but consists of activating a distribution of potential continuations, with the level of activation being proportional to the predicted probability. According to such models, processing should show sensitivity to a word’s predictability even when there is no single likely continuation, but relative difference in likelihood of continuations than others. Indeed, predictability’s effects are often graded (e.g. Kutas et al., Citation2011).
The frequency of the critical words was examined using SubtlexNL (Keuleers, Brysbaert, & New, Citation2010). Three critical words in the Form-Deviation condition did not appear in SubtlexNL and were therefore excluded from analysis. A t-test revealed that the frequency in the Meaning-Deviation condition was higher than the frequency in the Form-Deviation condition (t(101) = 2.96, p < 0.04). No attempt was made to match these frequencies as the norming for Experiment 1 has shown effects of predictability even when it is not confounded with frequency. Nonetheless, additional analyses were conducted to ensure that reported effects are not due to frequency, and these are reported towards the end of the Results section.
Main study
Method
Participants. Fifty native Dutch speakers participated in the main experiment for pay.
Stimuli. Pupillometry task. Three native Dutch speakers (all women) recorded the 53 triplets of sentences (See Appendix C for the list of stimuli). Recordings were edited such that, for each speaker, a recording comprising of the sentence up until its final word was used as a template, and for all conditions, a final word from a different recording was pasted into it. Therefore, none of the conditions included a full natural recording, but all conditions were edited such that the sentence would sound natural and the editing would not be perceptible. Note that there were no inserted pauses before the final word. When co-articulation differences across the words in the different conditions prevented editing at the last word from sounding natural, the editing occurred a phoneme or a few earlier (within or at the beginning of the penultimate word).
Each participant heard only one of the 9 versions (three conditions spoken by each of the three speakers). The goal of using multiple speakers was to prevent participants from learning that a speaker does not always use the predicted ending. Additionally, there were 36 filler sentences. These were sentences from the norming for which it was difficult to create triplets. They ended with the most common response. Thus, each participant heard a total of 89 sentences, with 29–30 sentences from each speaker – five or six sentences per condition and twelve filler sentences. The majority of sentences heard from each speaker ended with a frequent response.
Social Network Questionnaire. The questionnaire was the same one as in Experiment 2 in Lev-Ari and Shao (Citation2017) and in Lev-Ari (Citation2017).Footnote2 The main section of the questionnaire asked participants to list all the people they regularly talk to in a week and specify their relation to them, their age, and their educational level. Participants were asked not to include non-native speakers and children below the age of 12. Participants were also asked to only include people with whom they talk for at least five minutes. As in Experiment 2 in Lev-Ari and Shao (Citation2017), both Social Network Size and Age Variability were calculated according to the responses. These represent the number of interlocutors participants listed, and the Standard Deviation of the ages of these interlocutors. Both measures were extracted because Lev-Ari and Shao (Citation2017) contrasted the roles of Social Network Size and Age Variability at the Lexical Form level and found the latter, but not the former to predict behaviour. This is in contrast to the results of Experiment 1 and Lev-Ari (Citation2016) which found that Social Network Size predicts behaviour at the Semantic Meaning level. Thus, using both measures allows examining whether the role of the two dimensions of the social network differs across the linguistic levels. Social Network Size varied from 5 to 45 (M = 19.14, SD = 10.83), and Age Variability ranged from 3.94 to 21.14 (M = 13.81, SD = 3.75).
Procedure. All participants performed the pupillometry task and then answered a Social Network Questionnaire. In the pupillometry task, participants were first calibrated using Eyelink 1000 Plus with a headmount. Participants were then assigned to one of nine versions differing only in which speaker produced which sentence and in which condition. Trial order was random. Each trial started with a 1500 ms fixation cross. Following the fixation cross, an audio file logo appeared in the centre of the screen to maintain participants’ fixation on the centre. One hundred milliseconds after its appearance, the audio file started. After four seconds, either a fixation cross appeared for 2500 ms or a comprehension question appeared, followed by the 2500 ms fixation cross. Comprehension questions appeared on 18 out of the 89 trials – on three or four trials in each of the Dominant, Meaning-Deviation, and Form-Deviation conditions, and on seven filler trials. All questions were yes/no questions. They were intended to keep participants engaged and ensure they are listening to the audio files.
Results
First, to test whether participants’ performance is in line with prior findings, and ensure that participants’ pupil size is sensitive to word predictability, an analysis was run on the Dominant condition only, exploiting the wide range of predictability that items in this condition had (0.1–0.85). Items in other conditions were not included as they all had very low cloze probabilities, and adding them would confound condition with cloze probability. The analysis was therefore a mixed model analysis with Participants and Items as random variables, and Cloze Probability, Time and their interaction as fixed factors. Cloze Probability was centred, and Time (0–1000 ms after word onset) was binned into windows of 100 ms and centred. Binning is common practice with eye-tracking data aimed at reducing the problem of the interdependence of adjacent samples, as participants cannot shift their gaze as frequently and quickly as the sampling rate (every 2 milliseconds). The random structure included intercepts for Participants and Items, and a slope for Cloze Probability for the Participants variable, as the model did not converge when slopes for Time were included. The dependent measure was the ratio of current pupil size by its size at baseline, 100 ms prior to word onset. That is, all pupil size measurements were divided by pupil size for the same item during the 100 ms time window prior to the onset of the critical word. Time windows for which there was no data due to blinks were excluded (13 out of 8830 data points, <0.02% of data), and cases in which pupil size ratio was more than 2.5 Standard Deviations from the participant’s mean were trimmed to that value. Using this ratio as a dependent measure rather than the raw pupil size allows controlling for both individual and contextual differences in pupil size. Pupil size measurements rely on an arbitrary unit of measure that varies greatly between individuals – the pupil size ranges of different participants might not even overlap. The ratio, in contrast, reflects the magnitude of the pupil’s dilation in response to the critical word, and can thus be directly compared across individuals. In general, we should find pupil dilation at the end of the sentence, reflecting integration and sentence wrap up processes. Crucially, if pupil dilation is an appropriate measure that is sensitive to predictability, we should find greater pupil dilation over time for words of lower cloze probability.
Results showed an effect of Time (β = 2.2e-3, SE = 4e-4, t = 5.49), and, importantly, this effect was modulated by an interaction between Time and Cloze Probability (β = −5.5e-3, SE = 1.9e-3, t = −2.92). These results show that, as predicted, the more predictable a word was, the less participants dilated their pupils across the time window when processing it. This shows that participants’ pupil size is indeed sensitive to words’ predictability allowing a test of the main hypotheses.
Next, the main question was tested, whether Social Network Size influences prediction, and differently for the different linguistic levels. In particular, the model tested whether the dynamic of pupil dilation is influenced by Social Network Size at the Meaning-Deviation level, but less so at the Form-Deviation level. Due to the results of Lev-Ari and Shao (Citation2017), it was similarly tested whether Age Variability has such a differential effect on prediction across the different linguistic levels. A mixed model analysis was conducted with Participants and Items as random variables, and Social Network Size, Age Variability, Type (Dominant, Form-Deviation, Meaning-Deviation; dummy coded), Time, and the interactions of Social Network Size, Type, and Time, and Age Variability, Type, and Time as fixed variables.Footnote3 Social Network Size and Age Variability were scaled. Time was binned into windows of 100 ms and centred. The reference level for Type was set at the Meaning-Deviation level to facilitate the direct comparison of the Meaning-Deviation and Form-Deviation levels. The random structure included an intercept and a slope for Type for the Participants variable, and an intercept and slopes for Type, Social Network Size , and Age Variability for the Items variable.Footnote4 The dependent measure was the ratio of current pupil size to its size during the 100 ms time window prior to the onset of the critical word. Note that sentences in all conditions were identical 100 ms prior to the onset on the critical word, and thus this ratio indicates to what degree the participant dilated their pupil in reaction to the critical word, independently of individual differences in baseline pupil size. The time window ranged from 0 to 1000 ms after word onset in 100 ms bins. Time windows with no data because of blinks were excluded (42 out of 26,500 data points, <0.02% of data), and pupil size ratios that were more than 2.5 Standard Deviations from the participant’s mean were trimmed to that value.
The results of the analysis are illustrated in . As can be seen, there was a significant effect of Time (β = 1.90e-3, SE = 3.79e-4, t = 5.01; See Appendix D for the full results), such that pupil size increased with time. The statistical effect is reported at the reference level (Meaning-Deviation), but as can be seen, in all conditions, participants showed pupil dilation, and indeed, there was no interaction of Type and Time. Results also showed an interaction of Social Network Size and Time at the reference level (Meaning-Deviation; β = −8.65e-4, SE = 3.82e-4, t = −2.27) indicating that Social Network Size influences pupil dynamics at the Meaning-Deviation level, and, in particular, that the difference in pupil size across individuals with different Social Network Sizes decreases with Time. Indeed, as the top row shows, the reason for the decreased difference in pupil dilation across people with different Social Network Sizes later in the time window is driven by the fact that the larger participants’ Social Network Size, the more likely they were to show early pupil dilation upon hearing the unpredictable word in the Meaning-Deviation condition, whereas those with smaller Social Network Sizes exhibited later pupil dilation, thus matching the degree of pupil dilation that those with larger Social Networks show, but with a time delay. This could suggest that people with larger Social Networks were more likely to predict the dominant ending, or at least an ending different from the one they heard, and were therefore more surprised by the unpredictable word. In contrast, those with smaller Social Networks only showed difficulty of integrating the word.
Figure 2. Pupil Dilation as dependent on Time (in 100 ms bins), Social Network Size, and Type (Meaning, Form, Dominant). Grey bands indicate standard errors. Classification into Social Network Size groups was done automatically by the Effects package in R (Nieuwenhuis et al., Citation2012).
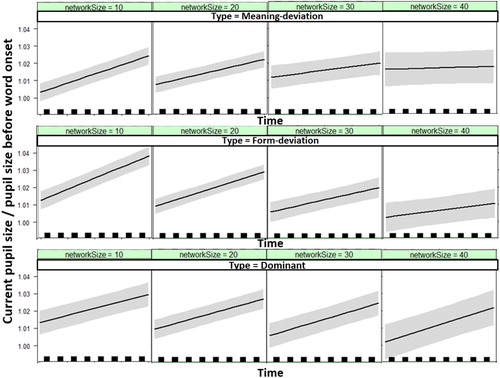
In contrast, the pattern of results in the Form-Deviation condition is quite different, as illustrated in the second row of and by an interaction of Type and Social Network Size when contrasting the Meaning-Deviation level with the Form-Deviation levelFootnote5 (β = −7.80e-3, SE = 3.24e-43, t = −2.41). This interaction indicates that the effect of Social Network Size was different at the Meaning-Deviation and Form-Deviation conditions, and that there was less pupil dilation for participants with larger Social Network Size in the Form-Deviation condition. While this effect did not interact with Time, as illustrates, in this condition none of the participants, regardless of their Social Network Size, showed early surprise or difficulty. However, the lower individuals’ Social Network Size, the more they increased their pupil size with time, indicating difficulty with integrating the target word. This suggests that the form of a word is not predicted, regardless of Social Network Size, but again, having a smaller Social Network leads to greater difficulty in integration of information. It should be noted that it is possible that people are sensitive to form deviations as well, but that this sensitivity requires a more sensitive measure than pupil dilation or a different time window to be observed.
The bottom row depicts the Dominant condition. Pupil dilation in this condition was not predicted to be influenced by Social Network Size, and indeed, as the plot shows, Social Network Size did not play an important role in the Dominant condition except perhaps more modest pupil dilation throughout the time window for participants with larger Social Network Sizes, though this difference was not significant in the model. The model only showed a marginal triple interaction between Social Network Size, Time, and Type at the Dominant level (β = 1.03e-3, SE = 5.40e-4, t = 1.91), indicating that, unlike in the Meaning-Deviation condition (the reference level), the difference between people with different Social Network Sizes did not decrease with time.
No other effects or interactions approached significance. In particular, Age Variability did not show any significant effects or interactions but only a trending triple interaction between Time, Age Variability, and Type at the Form-Deviation level (β = −8.91e-4, SE = 5.35e-4, t = −1.67).
While the results indicate that social network size plays a different role in the prediction of form and meaning, one may wonder whether the results could be interpreted alternatively as reflecting a different role that social network plays at different bands of frequency, as the critical items in the Meaning-Deviation condition were more frequent than those in the Form-Deviation condition. Therefore, a mixed model analysis that included an interaction with Frequency was conducted. The model included a 4-way interaction between Type (Dominant, Form-Deviation, Meaning-Deviation), Social Network Size (scaled), Time (centred and in 100 ms bins), and Frequency (scaled), and all the lower-order effects and interactions within. The random structure included intercepts for Participants and Items, and slopes for Type and Frequency for the Participants variable, and slopes for Social Network Size, Type, and Frequency for the Items variable. Age Variability was not included, as it did not have any effect in the previous analysis, and its exclusion increases the power of the analysis, and thus increases the likelihood of revealing significant effects of Frequency.
The results of this analysis revealed all the effects reported in the analysis without Frequency, namely, a main effect of Time (β = 1.92e-3, SE = 3.83e-4, t = 5), an interaction of Social Network Size and Time at the Meaning-Deviation level (β = −8.58e-4, SE = 3.84e-4, t = −2.23), and an interaction of Social Network Size and Type when contrasting the Form-Deviation level with the Meaning-Deviation level (β = −8.22e-3, SE = 3.78e-3, t = −2.17). The results did not reveal a main effect of Frequency (t < 1), but Frequency significantly interacted with Type when contrasting the Dominant and Meaning-Deviation levels (β = 0.01, SE = 4.82e-3, t = 2.47). This interaction was modulated by a 3-way interaction between Social Network Size, Frequency and Type when contrasting the Dominant and the Meaning-Deviation levels (β = 5.43e-3, SE = 2.05e-3, t = 2.64), and a 4-way interaction between Social Network Size, Time, Frequency, and Type when contrasting the Form-Deviation and Meaning-Deviation levels (β = 1.16e-3, SE = 5.52e-4, t = −2.09). In order to interpret those high-order interactions, follow up analyses were run on each Type condition separately. In none of the conditions, however, did Frequency have a significant effect or interact with any other factor. It seems then that even though Frequency might influence performance to a degree, it cannot account for the differential effect of Social Network Size across the different linguistic levels, as those effects held even after controlling for frequency.
Taken together, these results suggest that individuals with larger Social Network Sizes show prediction of meaning but not of form. Thus they show early dilation when the meaning differs from the one they predicted, but not otherwise. In contrast, individuals with smaller Social Network Sizes seem to either not predict or not predict accurately the upcoming lexical item, in terms of either meaning or form. They therefore do not show early pupil dilation in any condition. Additionally, individuals with smaller Social Networks might require greater effort to integrate the incoming input, as they show greater late pupil dilations.
General discussion
The results of this set of studies support and clarify the previous findings. The findings indicate that the role that social network size plays indeed differs across linguistic levels. In particular, the results demonstrate that having a larger social network indeed boosts performance at the meaning level, but not at the lexical form level. In particular, the experiments reported here found that people with larger social networks were more likely to predict the meaning of final word in a sentence, but not its form, and that this is true regardless of whether explicit offline or implicit online prediction is examined.
It is less clear what the source for this difference across linguistic levels is. Some might argue that the difference between the so-called Form and Meaning levels are not qualitative differences but merely quantitative differences, because no two forms ever have the precise same meaning. Therefore, the differences at the Form level are simply subtler differences of Meaning. Similarly, as differences in Meaning are inherently differences in both Form and Meaning, one may argue that the Form and Meaning levels simply represent different magnitudes of deviation. To the degree that differences in cloze probability reflect differences in magnitude of deviation, the Form and Meaning conditions in both experiments were equated in magnitude of deviation, and thus the results could not be accounted for by this factor. Nevertheless, cloze probability might not capture this difference well, and the Meaning level will inherently include deviation on both Form and Meaning. Therefore, it remains possible that the results of these studies should be interpreted as showing that having a larger social network increases sensitivity to strong but not weak deviations rather than to deviations at the Meaning level but not at the Form level.
Lev-Ari and Shao (Citation2017) showed that having social networks that are more heterogeneous age-wise boosts performance at the lexical form level, and that this measure of network variability did not correlate with social network size. Therefore, it might be the case that having variable input is useful at all linguistic levels, but that different aspects of the network would lead to greater variability at different linguistic levels or even within linguistic levels across different linguistic units. Indeed, language is not distributed uniformly across the population. Even within the same linguistic level (e.g. phonological), the spread of some features might depend on age, while the spread of other features might depend on geographic region, on socioeconomic status or on a complex combination of these and other indexical features. Therefore, receiving more heterogeneous and representative input would require different network structures for different features. In some cases, social network size would increase the variability and representativeness of the input, whereas in others, it would not. It might be the case then that at the phonological and semantic meaning levels social network size is more likely to correlate with heterogeneity across the relevant dimensions than at the lexical level.
A related account would suggest that the two linguistic levels differ not (only) in the social exposure that is optimal for learning the distribution of use across the population, but in generating generalised predictions according to this exposure. That is, it might be the case that people learn well how lexical use varies by age, but are less aware of the age distribution of M-Turk users and the population at large, and are therefore less accurate at predicting the most common lexical form across the entire population.
Alternatively, one may argue that at the lexical level, variability matters less. One reason for that might be that at the meaning level, there are many and potentially an infinite number of alternatives competing, as the range of opinions or ideas that a speaker could choose to convey is very wide. In contrast, at the lexical form level, the number of competing alternatives is quite low. Some concepts can be referred to by more than one label, but the range is low and constrained. For example, one can choose between the terms bicycle and bike but would struggle to find multiple additional alternatives to refer to the same concept. It might therefore be the case that at the lexical form level, exposure to fewer speakers is necessary to learn the pattern of variation, so having a larger or more heterogeneous social network is not necessary. Correspondingly, computational simulations at the phonological level showed that variability is particularly useful when the community is more heterogeneous in terms of production patterns (Lev-Ari, Citation2018). Therefore, if there are only a few competing forms and little variation, having a larger social network might not be useful. This proposal seems to contradict the results of Lev-Ari and Shao (Citation2017) which show that network variability in terms of age heterogeneity in the network boosts performance at the lexical form level. The items and task in those studies were quite different though. For example, in Experiment 1 in that study, participants were specifically asked to predict how a college student and how an older adult would refer to an object. It might be the case that the focus on variation by age led to the stronger role of network age variability. It might be interesting to note that while there was no effect of age variability in Experiment 2 in this paper, the numeric trend that appeared for age variability was in the form condition. Further research should therefore examine whether different types of network heterogeneity that do not necessarily correlate with network size but do correlate with the distribution of lexical forms across the population influence performance at the lexical level.
The results of these studies are also the first to show that having a larger social network can improve prediction of meaning. These studies thus show that individuals’ social network size can influence not only their ability to comprehend others as the previous literature has shown, but also online processing. These results are in line with Lev-Ari and Shao (Citation2017) who find that another property of the social network, age heterogeneity, can influence online processing, and in particular, prediction at the form level.
One unpredicted set of results in this study indicated that social network size might influence the point in time at which listeners experience difficulty. In particular, the results suggest that individuals with larger social networks anticipate the meaning, but not the form of words, and thus show early difficulty when encountering a meaning different from the one they anticipated – regardless of its form – but otherwise, they do not experience any difficulty with integrating the incoming information. In contrast, individuals with smaller social networks do not seem to anticipate either the form or the meaning of the upcoming word, but regardless of what it is, they show greater difficulty at integrating it. While the study was not intended to contrast effects of lesser use of prediction versus insufficient knowledge to predict accurately, the pattern of results fits better with the former. Had individuals simply predicted erroneously, they would have shown modest but early and consistent dilation – as the word would be deviant for some and not for others, in all conditions. These differences in prediction versus integration were not predicted a-priori though, and as this is their first demonstration, this interpretation should be taken with caution.
Throughout the paper, the discussed patterns were interpreted as effects of social network size. As with any individual differences study, however, causality cannot be straightforwardly attributed. For example, it could be that another factor that correlates with social network size accounts for the findings. While this cannot be ruled out, these studies were inspired by previous findings in which the role of social network size was clearer. In particular, Lev-Ari (Citation2016) employed both an individual differences study and an experimental manipulation of social network size and found in both cases that having a larger social network size boosts semantic skills. Other studies failed to find any relation between social network size and cognitive abilities, such as working memory, selective attention, and task switching (Lev-Ari, Citation2018), further reducing the likelihood that the effects here are driven by such factors. Nonetheless, all that can be unequivocally inferred from these studies is that people with larger social networks have better semantic but not lexical skills. Further research is required to establish whether it is indeed the size of the social network that drives the effect.
To conclude, the findings of this set of studies indicates that social network size plays a different role across linguistic levels, such that having a larger social network improves prediction at the meaning, but not at the form level. This has implications for both language learning and language use. The results suggest that different types of exposure are required to improve different linguistic skills, and therefore different interventions might also be required to allow minimisation of a language gap depending on the type of gap. The results also have implications for language use and language change, since, assuming that our own use depends on our exposure, different linguistic features would be learned, used and diffused differently throughout the community relying on different network dynamics. Examining the role that social network properties play in language prediction and processing in general, and how it is modulated by the linguistic level or relevant linguistic feature can thus enhance our understanding of how those features are acquired, processed, used, and change with time.
PLCP_A_1508733 Supplementary Material
Download MS Word (19.2 KB)Disclosure statement
No potential conflict of interest was reported by the author.
Notes
1 Interestingly, three of these items were the items that had the highest item agreement across all items in the norming, and the fourth item had particularly low agreement in the norming. That is, these were the items whose response distribution across the population was quite atypical. In fact, in three of these cases there was very little variation. This might have led them to behave quite differently, and might have been the reason for their undue influence.
2 The main aspect of the questionnaire – asking about the number of interlocutors per week, and the criteria regarding who counts as an interlocutor, was the same as in Experiment 1. The questionnaire differed from the one in Experiment 1 mostly by having a more sophisticated interface and by the collection of more detailed information, including age information, about each interlocutor.
3 In addition, a growth curve model was run. That model included, other than the polynomial effect of Time, Social Network Size, Type, and the interactions of these factors with each polynomial level of Time. Age Variability was not included in order to simplify the model, and because none of its effects of interactions reached significance in the main reported model. The growth curve model showed only a linear effect of Time, whereas the polynomial effects and interactions of Time were all non-significant. The growth curve model showed the same effects as the reported model. In general, pupillometry studies, unlike studies of fixation patterns, are not commonly analyzed using a growth curve model.
4 This is the maximal random structure that still converged. Slopes for all variables other than Time were included.
5 Mixed model analyses report results at the reference level, in this case – the Meaning condition. Therefore, the interaction of Social Network Size and Type tests for each level of Type separately whether the effect of Social Network Size at that level is different from its effect at the reference level, the Meaning condition.
Related Research Data
References
- Altmann, G., & Mirković, J. (2009). Incrementality and prediction in human sentence processing. Cognitive Science, 33(4), 583–609. doi: 10.1111/j.1551-6709.2009.01022.x
- Brysbaert, M., & New, B. (2009). Moving beyond Kučera and Francis: A critical evaluation of current word frequency norms and the introduction of a new and improved word frequency measure for American English. Behavior Research Methods, 41(4), 977–990. doi: 10.3758/BRM.41.4.977
- Chang, F., Dell, G. S., & Bock, K. (2006). Becoming syntactic. Psychological Review, 113(2), 234–272. doi: 10.1037/0033-295X.113.2.234
- Frank, S. L., & Thompson, R. L. (2012). Early effects of word surprisal on pupil size during reading. In Proceedings of the 34th annual conference of the cognitive science society (pp. 1554–1559). Austin, TX: Cognitive Science Society.
- Huettig, F., & Janse, E. (2016). Individual differences in working memory and processing speed predict anticipatory spoken language processing in the visual world. Language, Cognition and Neuroscience, 31(1), 80–93. doi: 10.1080/23273798.2015.1047459
- Hyönä, J., Tommola, J., & Alaja, A. M. (1995). Pupil dilation as a measure of processing load in simultaneous interpretation and other language tasks. The Quarterly Journal of Experimental Psychology Section A, 48(3), 598–612. doi: 10.1080/14640749508401407
- Just, M. A., Carpenter, P. A., & Miyake, A. (2003). Neuroindices of cognitive workload: Neuroimaging, pupillometric and event-related potential studies of brain work. Theoretical Issues in Ergonomics Science, 4(1-2), 56–88. doi: 10.1080/14639220210159735
- Kahneman, D., & Beatty, J. (1966). Pupil diameter and load on memory. Science, 154(3756), 1583–1585. doi: 10.1126/science.154.3756.1583
- Kamide, Y., Altmann, G. T., & Haywood, S. L. (2003). The time-course of prediction in incremental sentence processing: Evidence from anticipatory eye movements. Journal of Memory and Language, 49(1), 133–156. doi: 10.1016/S0749-596X(03)00023-8
- Keuleers, E., Brysbaert, M., & New, B. (2010). SUBTLEX-NL: A new measure for Dutch word frequency based on film subtitles. Behavior Research Methods, 42(3), 643–650. doi: 10.3758/BRM.42.3.643
- Kleinschmidt, D. F., & Jaeger, F. T. (2015). Robust speech perception: Recognize the familiar, generalize to the similar, and adapt to the novel. Psychological Review, 122(2), 148–203. doi: 10.1037/a0038695
- Kliegl, R., Grabner, E., Rolfs, M., & Engbert, R. (2004). Length, frequency, and predictability effects of words on eye movements in reading. European Journal of Cognitive Psychology, 16(1-2), 262–284. doi: 10.1080/09541440340000213
- Kutas, M., DeLong, K. A., & Smith, N. J. (2011). A look around at what lies ahead: Prediction and predictability in language processing. In M. Bar (Ed.), Predictions in the brain: Using our past to generate a future (pp. 190–207). New York: Oxford University Press.
- Kutas, M., & Hillyard, S. A. (1984). Brain potentials during reading reflect word expectancy and semantic association. Nature, 307(5947), 161–163. doi: 10.1038/307161a0
- Lahar, C. J., Tun, P. A., & Wingfield, A. (2004). Sentence–final word completion norms for young, middle-aged, and older adults. The Journals of Gerontology Series B: Psychological Sciences and Social Sciences, 59(1), P7–P10. doi: 10.1093/geronb/59.1.P7
- Lev-Ari, S. (2016). How the size of our social network influences our semantic skills. Cognitive Science, 40, 2050–2064. doi: 10.1111/cogs.12317
- Lev-Ari, S. (2017). Talking to fewer people leads to having more malleable linguistic representations. PLoS One, 12(8), e0183593. doi: 10.1371/journal.pone.0183593
- Lev-Ari, S. (2018). The influence of social network size on speech perception. The Quarterly Journal of Experimental Psychology, Advance online publication. doi: 10.1177/1747021817739865
- Lev-Ari, S., & Shao, Z. (2017). How social network heterogeneity facilitates lexical access and lexical prediction. Memory & Cognition, 45(3), 528–538. doi: 10.3758/s13421-016-0675-y
- Lively, S. E., Logan, J. S., & Pisoni, D. B. (1993). Training Japanese listeners to identify English /r/ and /l/. II: The role of phonetic environment and talker variability in learning new perceptual categories. The Journal of the Acoustical Society of America, 94(3 Pt 1), 1242–1255. doi: 10.1121/1.408177
- Martin, C. D., Thierry, G., Kuipers, J. R., Boutonnet, B., Foucart, A., & Costa, A. (2013). Bilinguals reading in their second language do not predict upcoming words as native readers do. Journal of Memory and Language, 69(4), 574–588. doi: 10.1016/j.jml.2013.08.001
- Nieuwenhuis, R., te Grotenhuis, M., & Pelzer, B. (2012). Influence. ME: Tools for detecting influential data in mixed effects models. R Journal, 4(2), 38–47.
- Pickering, M. J., & Garrod, S. (2007). Do people use language production to make predictions during comprehension? Trends in Cognitive Sciences, 11(3), 105–110. doi: 10.1016/j.tics.2006.12.002
- Rayner, K., Slattery, T. J., Drieghe, D., & Liversedge, S. P. (2011). Eye movements and word skipping during reading: Effects of word length and predictability. Journal of Experimental Psychology: Human Perception and Performance, 37(2), 514–528.
- Rost, G. C., & McMurray, B. (2009). Speaker variability augments phonological processing in early word learning. Developmental Science, 12(2), 339–349. doi: 10.1111/j.1467-7687.2008.00786.x
- Rost, G. C., & McMurray, B. (2010). Finding the signal by adding noise: The role of noncontrastive phonetic variability in early word learning. Infancy, 15(6), 608–635. doi: 10.1111/j.1532-7078.2010.00033.x
- Smith, N. J., & Levy, R. (2008). Optimal processing times in reading: A formal model and empirical investigation. Proceedings of the Annual Meeting of the Cognitive Science Society, 30(30), 595–600.
- Smith, N. J., & Levy, R. (2013). The effect of word predictability on reading time is logarithmic. Cognition, 128(3), 302–319. doi: 10.1016/j.cognition.2013.02.013
- Tromp, J., Hagoort, P., & Meyer, A. S. (2016). Pupillometry reveals increased pupil size during indirect request comprehension. Quarterly Journal of Experimental Psychology, 69(6), 1093–1108. doi: 10.1080/17470218.2015.1065282
- van Berkum, J. J. A., Brown, C. M., Zwitserlood, P., Kooijman, V., & Hagoort, P. (2005). Anticipating upcoming words in discourse: Evidence from ERPs and reading times. Journal of Experimental Psychology: Learning, Memory, and Cognition, 31, 443–467.
- Wicha, N. Y., Bates, E. A., Moreno, E. M., & Kutas, M. (2003). Potato not pope: Human brain potentials to gender expectation and agreement in Spanish spoken sentences. Neuroscience Letters, 346, 165–168. doi: 10.1016/S0304-3940(03)00599-8