
Abstract
Practitioners always want to exclude the possibility that a patient is feigning symptoms. Some experts have suggested that an inconsistent symptom presentation across time (i.e., intraindividual variability) is indicative of feigning. We investigated how individuals with genuine pain-related symptoms (truth tellers; Study 1 n = 32; Study 2 n = 48) and people feigning such complaints (feigners; Study 1 n = 32; Study 2 n = 28) rated the intensity of their symptoms across a 5-day period. In both studies, feigners reported on all 5 days significantly higher symptom intensities than people with genuine complaints, but the two groups did not differ with regard to symptom (in)consistency. Thus, persistently inflated, rather than inconsistent, reports of symptom intensity over time are suggestive of feigning. The implications and limitations of our work are discussed.
In settings such as psychiatric emergency departments, it is paramount that, before diagnosing a patient, a clinician considers the possibility that the patient is feigning their complaints (Hong et al., Citation2019; McDermott & Feldman, Citation2007). People might engage in symptom feigning for a variety of reasons, including financial, legal, or medical benefits (e.g., obtaining drugs).Footnote1 There is no consensus on the prevalence of feigning (Young, Citation2015), with estimates ranging from 0% to 40%, but researchers agree that rates are higher in forensic settings (e.g., litigation) than in clinical settings (Bianchini et al., Citation2005; Greve et al., Citation2013; Mittenberg et al., Citation2002).
Some clinicians have argued that a highly variable, that is, inconsistent symptom presentation is a red flag of feigning, but this practical guideline has not been researched very well (Bianchini et al., Citation2005; McDermott & Feldman, Citation2007). The idea that intraindividual variability in symptom reports points in the direction of feigning, whereas consistent presentations reflect genuine illness, aligns with the medical model, according to which symptoms are signs of underlying problems that are stable and permanent unless treated (Blaney, Citation2014). It also accords with lay peoples’ beliefs about deception (Granhag & Strömwall, Citation1999). They often assume that honest individuals are consistent in their reports, whereas deceptive accounts include many inconsistencies (i.e., consistency heuristic).
The notion that symptom fluctuations (i.e., inconsistencies) are indicative of feigning is also closely related to the assumption that people who feign symptoms are not able to do so in a convincing manner for a prolonged period (Jelicic et al., Citation2017). There are, however, well-documented cases of individuals who were able to engage in convincing symptom feigning for weeks (van der Heide et al., Citation2020). A study on intrainvidual consistency of mental health issues, specifically trauma symptomatology, even suggested that feigned symptoms were more consistent over time than genuine symptoms (Peace et al., Citation2010).
Another argument against the consistency heuristic is that symptom reports of genuine patients often fluctuate (Fishbain et al., Citation1999). For instance, over the course of repeated assessments, patients with depression exhibited fluctuation in their mood and reported “good” and “bad” days (Rogers et al., Citation2010). A related phenomenon is regression to the mean (Morton & Torgerson, Citation2003): Individuals who are selected because of their high symptomatology often tend to report lower symptom levels during follow-up measurements. These considerations are difficult to reconcile with the notion that examination of the consistency of symptom reports across multiple occasions might provide useful clues for the detection of feigning. Still, the potential link between intraindividual symptom fluctuation and feigning has not received systematic research attention (Strauss et al., Citation1999, Citation2002).
Currently, the most commonly used tools for the detection of feigning are Symptom Validity Tests (SVTs). They either gauge the tendency to overreport symptoms on symptom inventories or the tendency to underperform on simple cognitive tasks (Merten & Merckelbach, Citation2013). An example of the first type of test is the Self-Report Symptom Inventory (SRSI; Merten et al., 2016). The SRSI taps into symptom overreporting by comparing individuals’ responses to two types of items: genuine and implausible symptoms. Truth tellers are highly specific in their endorsement of genuine symptoms, whereas people who feign tend to over-endorse both types of symptoms (Boskovic et al., Citation2019; Merten et al., Citation2016). However, tools such as the SRSI are usually not administered to one and the same person on multiple occasions. Here we are interested in whether checking the inconsistency of symptom intensities reported over time might have value in addition to symptom validity assessment with, for example, the SRSI.
To explore the connection between (in)consistency and feigning, we employed experience sampling to monitor symptom intensity ratings of participants (“truth tellers”) instructed to report accurately about their transient complaints (Study 1) or chronic symptoms (Study 2) and participants instructed to feign symptoms over the course of 5 days (“feigners”). If the consistency heuristic has any merit, one would expect that truth tellers show less fluctuating symptom intensity reports than feigners. On the last day of testing, we also administered the SRSI. We expected that truth tellers would endorse fewer symptoms, particularly pseudosymptoms, on the SRSI than feigners.
Study 1
Method
Participants
Participants were bachelor students of Maastricht University. Based on a *G-power analysis (η2 = 0.37; Peace et al., Citation2010; α = .05, β = .95) and the five testing moments, the sample size was set on at least 60 participants, 30 participants for each group. Originally, 108 participants signed up for the study, of whom 44 participants (40.7%) with incomplete records (due to dropping out or missing a day) were excluded.
Our final sample consisted of 64 students (87.5% female), with an average age of 22 years (SD = 2.8; range 18−32). As all of the students reported experiencing symptoms at the time of the study, they were randomly assigned to either the truth telling (n = 32) or feigning condition (n = 32). Students’ self-reported English proficiency, measured on a 5-point Likert scale, was good/extremely good (M = 4.40, SD = 0.56), and truth tellers (M = 4.63, SD = 0.55) did not differ from feigners (M = 4.38, SD = 0.55) in this regard, t(62) = 1.80, p = .076.
The study was approved by the standing ethical committee of Faculty of Psychology and Neuroscience, Maastricht University.
Procedure
We used an experience sampling approach (Verhagen et al., Citation2016): all participants had to report the intensity of their complaints and to briefly describe these over a 5-day period. Participants signed up for the study by registering their email address in a System for Online Training and Research (SOTO) that automatically sent the emails containing links of the questionnaires to them on five consecutive days at noon. After answering demographic questions, students were asked whether they experienced one of the 10 most common symptoms in the last week (Petrie et al., Citation2014). Participants could add another physical symptom, or choose the option “None of the symptoms,” indicating that they did not experience any of the symptoms in the last week. As only three participants endorsed this option, their data were not included in the final data set, and the remaining participants were randomly assigned to the truth telling condition or feigning condition. Truth tellers received instructions to fill in intensity reports about the target symptom they were currently experiencing, whereas the feigning group received instructions to select a symptom, but this time a target symptom they did not actually have. Thus, they were not allowed to select any symptoms they previously reported. Feigners’ instructions stressed that their task was to convince us that they were members of the truth telling group, although they were reporting about symptoms they did not genuinely experience. Subsequently, both groups filled in the intensity reports of their target symptom. The intensity of symptoms was rated using a 10-point scale (0: Totally absent, 10: Extremely high). Next, participants described their (genuine or feigned) symptom as they were currently feeling it. This was to make participants more compliant with their group instructions. At the end of the questions for each day, participants provided their personal code to ensure that their data from all five days could be linked. On the fifth and final day, we administered the SRSI (Merten et al., Citation2016) as well as several exit questions regarding participants’ motivation and experienced difficulty. Participants in the feigning group were asked if they had a certain strategy in how they reported the intensity of their symptom and in how they described their symptom over the course of five days. Also, participants of both groups were explicitly asked whether they had tried to be consistent in their symptom intensity ratings over the five days. Finally, the debriefing form was provided in which the real purpose of the study was revealed.
As a reward for participation, each participant had the option to be paid either 1.5 research credits or a voucher worth €10. Feigners were also instructed upfront that if they provided convincing symptom accounts, they would be entered into a lottery with the opportunity to earn an additional €15.
Materials
Self-Report Symptom Inventory
The Self-Report Symptom Inventory (SRSI) was developed to screen for symptom over-reporting (Merten et al., Citation2016). The SRSI consists of two main scales: the genuine symptom scale (50 items) and the pseudosymptom scale (50 items). Each scale contains five subscales with 10 items. The genuine symptoms scale taps into (1) cognitive problems, (2) depression, (3) pain, (4) nonspecific somatic complaints, and (5) post-traumatic stress disorder (PTSD)/anxiety. The pseudosymptoms scales gauge (1) cognitive/memory issues, (2) neurological: motoric complaints, (3) neurological: sensory complaints, (4) pain, and (5) anxiety/depression. Two items to measure the a priori cooperativeness and five items to check consistency (i.e., consistency of responses to similar items) are included. Altogether, the SRSI consists of 107 items, which are all dichotomous (i.e., true-false). Items that were answered with “False” were coded as 0 and those answered with “True” were coded as 1. Cronbach’s alphas for total genuine symptoms and pseudosymptoms scores were .94 and .81, respectively. To identify feigning, Merten et al. (Citation2016) recommended the following cutoff scores for the total pseudosymptoms score: >6 for screening purposes and >9 for diagnostic purposes.
Analysis
First, a repeated measures Analyses of Variance (ANOVA) using a 2 (group) x 5 (days) design was performed to analyze the differences between the symptom intensity reports of both groups over the five days. Specifically, we examined whether a significant group x days interaction would emerge, because such interaction might indicate stronger consistency in truth tellers than in feigners. In case of significant effects, we conducted follow-up t-tests. As we were interested in whether consistency would be stronger in truth tellers than in feigners, we also looked at variances in both samples with the F-statistic [F(x,y) = s2 (honest participants)/ s2 (feigners)]. We conducted a Multivariate Analyses of Variance (MANOVA) to investigate whether the groups performed differently on the (sub)scales of the SRSI. The data are available on the Open Science Framework platform https://osf.io/rpzt4/.
Results
Motivation and exit questions
Participants rated their motivation on a 5-point scale (1: Not at all, 5: A great deal). On average, the participants were moderately motivated to participate in our study (M = 3.36, SD = 0.78). Truth tellers and feigners did not significantly differ in their motivation, t(62) = .48, p = .64. Furthermore, participants rated the difficulty of rating and describing their (genuine or feigned) symptoms on a 5-point scale (1: Extremely easy, 5: Extremely difficult). On average, participants found both tasks, rating (M = 2.42, SD = 0.97) and describing (M = 2.94, SD = 1.01), neither easy nor difficult, and the two groups did not differ in this respect, ts (62) < 1.50, ps > .14. In both groups, an equal proportion of participants (37.5%) indicated in retrospection that they had tried to be consistent in their symptom intensity ratings. The majority of truth tellers stated they compared their ratings with the ones given the previous day. Feigners were asked whether they had a certain strategy with rating and describing their symptom intensity. A little over a third based their answers on past experiences or chose to display a predetermined course of their symptom, such as getting worse and then getting better. A list of target symptoms endorsed in both groups is shown in the Online Supplementary Material.
Symptom intensity ratings
The intensity reports for both groups on all five days are presented in . The critical interaction effect of groups and days was nonsignificant, F(4, 248) = 1.68, p = .16, ηp2 = .04. The main effect of groups reached significance, F(1, 62) = 3.15, p < .001, ηp2 = .35, due to the feigners’ higher intensity reports than those of truth tellers. The main effect of days did not attain significance, F(3.40, 210.25) = 2.52, p = .052, ηp2 = .04.
Figure 1. Mean symptom reports for truth tellers (n = 32) and feigners (n = 32) across the 5-day period (Study 1). Error bars are 95% Confidence Intervals (CIs).
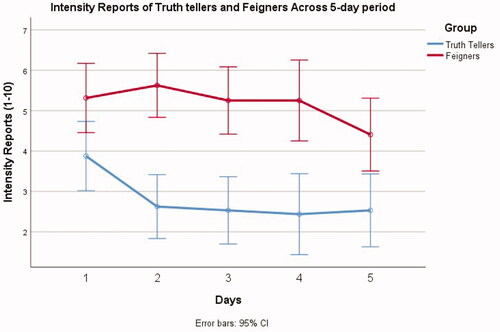
Means and standard deviations are provided in . Follow-up independent t-tests indicated that on all five days, feigners provided significantly higher intensity reports than truth tellers (all ts > 2.37, all ps < 0.05, all Cohen’s ds > 0.59).
Table 1. Means and standard deviations of symptom intensity reports on all five days, with t-test results.
We compared symptom fluctuation in both groups and conducted an F test (cf. supra). Symptom variability was relatively similar in both groups, F’s (31) < 1.32 (with critical F value being 1.84 for p = .05).
Symptom reports on the SRSI
The SRSI scores of both groups are presented in . The feigning group endorsed significantly more genuine and pseudosymptoms than the truth telling group.
Table 2. SRSI subscales scores of Truth tellers and Feigners.
Discussion
Truth tellers reported lower symptom intensities on all five days, and endorsed fewer symptoms on the SRSI than feigners. Also, we found no indication that truth tellers were more consistent in their symptom presentation than feigners. Two potential limitations of this study are (1) the possibility that the genuine target symptoms we examined were short-term; thus, they might have largely disappeared during the testing period, and (2) the fact that feigning participants were symptomatic but were only lying about the type of symptoms that they experienced. With these considerations in mind, we designed Study 2, in which we included participants with chronic symptoms in the truth telling condition, whereas asymptomatic participants were assigned to the feigning group.
Study 2
Method
Participants
In this study, participants who reported any chronic symptom were assigned to the truth telling group, whereas the feigning condition consisted of a nonsymptomatic sample. As we were not able to anticipate how many participants would finish the study on all five days, we recruited 113 participants. Forty-three participants (38.09%) were excluded because they provided incomplete data, withdrew, or indicated they had a symptom which did not meet the chronic requirements (see Procedure below). Our final sample consisted of 70 participants. Most of our sample was female (78.6%). The truth telling group with chronic complaints consisted of 42 participants, whereas the feigning group (participants without any complaints) included 28 participants. The average age of participants was 23 years (SD = 3.9; range: 18–34), and their reported English proficiency was extremely good (M = 4.43, SD = 0.67). Truth tellers (M = 4.33, SD = 0.72) did not differ from feigners (M = 4.61, SD = 0.56) in this respect, t(68) = 1.68, p = .10.
The study was approved by the standing ethical committee of Faculty of Psychology and Neuroscience, Maastricht University.
Procedure
The same procedure as for Study 1 was employed, however, with slight adjustments. In Study 2, we incorporated a criterion for chronicity: Experiencing a physical symptom at least three times a week for the past three months. We assessed this criterion using participants’ self-report. Thus, participants who reported having symptoms, but who did not meet this criterion were excluded. Further, as the participants of the feigning group were asymptomatic, they were informed about the truth telling condition (symptomatic participants with chronic complaints) and asked to convince us that they were members of that group. Except for these elements, the procedure of Study 2 was similar to that of Study 1.
Materials
Self-Report Symptom Inventory
In this study, we also included the SRSI (Merten et al., 2016) on the last day of testing. Cronbach’s alphas of the genuine symptom scale and pseudosymptoms scale were .90 and .91, respectively.
Analysis and design
The data analytic approach was similar as that in Study 1. We also combined the data from both studies to explore further reporting style between truth telling participants who passed the SRSI cutoff point and feigners who were detected by the SRSI.
Results
Motivation and exit questions
On the final day, each participant evaluated their motivation and difficulty when providing descriptions and symptoms intensity on a five-point scale (1: None at all, 5: A great deal). All participants were moderately motivated (M = 3.66, SD = 0.83). Truth tellers, M = 3.64, SD = 0.82, and feigners, M = 3.68, SD = 0.86, reported similar levels of motivation, t(68) = .17, p = .86. Providing symptom descriptions was reported to be moderately difficult (M = 3.06, SD = 1.13), and truth tellers, M = 2.9, SD = 1.19, did not statistically differ from feigners, M = 3.29, SD = 1.01, t(68) = 1.30, p= .20. Similarly, rating symptom intensity was reported to be moderately difficult, M = 2.90, SD = 1.09, and truth tellers, M = 2.86, SD = 1.18, did not differ from feigners, M = 3.29, SD = 1.01, t(68) = 1.57, p = .12.
Both groups were asked whether they had tried to be consistent across the five days. In total, 54.8% (n = 23) of truth tellers and 46.4% (n = 13) of feigners selected “Yes.” Participants in the feigning group were asked whether they had adopted a certain strategy when completing the task. Half of the feigning group (50%) declared having a certain strategy when reporting the intensity of their symptoms. In retrospect, feigners were said to be inclined to report their symptoms from past experience (i.e., embedded lies) or to avoid too extreme or exactly the same scores. For example, one participant said about his/her symptom intensity ratings: “Keep them within a mid to high range, not the same every day.” Type of symptom endorsed in both groups is shown in the Online Supplementary Material.
Symptom intensity ratings
displays the results of the symptom intensity reports across all five days for both the truth telling and feigning group.
Figure 2. Mean symptom reports for truth tellers (n = 48) and feigners (n = 28) across the 5-day period (Study 2). Error bars are 95% CIs.
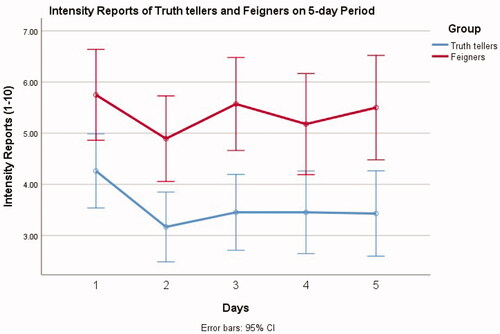
The critical interaction effect of groups and days was nonsignificant, F(4, 272) = .28, p = .89, ηp2 = .04. The main effect of group was significant, with the feigning group reporting higher intensity scores, F(1, 68) = 20.66, p < .001, ηp2 = .23, whereas the main effect of days was nonsignificant, F(4, 272) = 2.01, p = .094, ηp2 = .03.
shows the means and standard deviations on all testing days. Follow up t-tests indicated that feigners scored significantly higher than truth tellers on all five days (ts > 2.60, ps < .012). For all days, Cohen’s ds were indicative of medium to large effect sizes (> .60 and < .85).
Table 3. Means and standard deviations of symptom intensity scores on all five days, including independent t-test results.
Using the F test (cf. supra) for evaluating differences in intraindividual variability, we found that the variance of intensity scores did not significantly differ between groups, Fs (27, 41) < 1.45 (with critical F value being 1.78 for p = .05).
Self-Report Symptom Inventory results
Looking at the p values, there were no statistically significant differences between truth tellers and feigners with regard to genuine symptoms (p = .052), but truth tellers endorsed significantly fewer pseudosymptoms than feigners (see ). However, the reported effect sizes indicate moderate differences between the two groups on both genuine and implausible symptom scales.
Table 4. Means of symptoms from SRSI subscales for both groups.
Explorative analyses with merged data from Study 1 and Study 2
To increase the power, we merged the data from Study 1 and Study 2 (N = 134) and re-ran the main analyses. First, we carried out a repeated measures ANOVA with groups (2), days (5), and study (Study 1 vs. Study 2) as factors. The interaction effect between groups, days, and study remained nonsignificant, F(4, 127) = 1.12, p = .35, ηp2 = .03, as well as the critical interaction of groups and days, F(4, 127) = 1.54, p = .19, ηp2 = .04. The main effect of group was significant, F(1, 130) = 53.21, p < .001, ηp2 = .29, and so was the main effect of days, F(4, 127) = 3.01, p = .021, ηp2 = .08. The effect of study was not significant, F(1, 130) = .89, p = .35. ηp2 = .007. displays the results of the symptom intensity reports across all five days for both the truth telling and feigning group. Using the F test, we found that the intraindividual variance of intensity scores did not significantly differ between groups, Fs (73, 59) < 1.10 (with critical F value being 1.53 for p = .05).
Figure 3. Mean symptom reports for truth tellers (n = 74) and feigners (n = 60) across the 5-day period (Study 1 & Study 2). Error bars are 95% CIs.
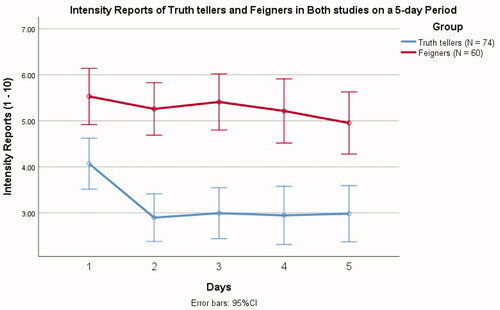
As the interaction between the group and days was insignificant, to inspect the main effect of group, we calculated the total mean of intensity ratings ((Intensity day 1 + Intensity day 2 + Intensity day 3 + Intensity day 4 + Intensity day 5) / 5), and looked at group differences. The results showed that feigners (Mtotal = 5.27, SD = 1.41) produced overall significantly higher intensity scores than truth tellers (Mtotal = 3.22, SD = 1.83), t(132) = 7.07, p < .001, Cohen’s d = 1.25.
Second, we compared the groups on their SRSI scores. Results showed that truth tellers endorsed significantly fewer symptoms from both genuine symptom scale and pseudosymptom scale than feigners (see ).
Table 5. Means of symptoms from SRSI subscales for both groups. One-way ANOVA results also displayed.
Discussion
The results of our studies can be summarized as follows: First, neither in Study 1 nor in Study 2 was there a significant interaction that emerged between the intensity scores of the groups and days of testing, meaning that truth tellers and feigners manifested similar levels of (in)consistency. Two robust differences between feigners and truth tellers were evident in both studies. For one thing, feigners reported higher levels of symptom intensity ratings than did (symptomatic) truth tellers. Also, feigners endorsed more often both genuine and implausible symptoms of the SRSI than truth tellers. Apparently, the tendency to exaggerate symptoms, including atypical and unlikely symptoms, rather than an inconsistent pattern of reporting characterizes feigning, a conclusion that is in accordance with the broader literature (Frueh et al., Citation1997; Merckelbach et al., Citation2017; Merten et al., Citation2016; Strauss et al., Citation1999, Citation2002). Relatedly, when participants were asked whether they intentionally produced consistent scores, similar proportions of truth tellers and feigners responded positively, showing that the consistency heuristic appeals to people with genuine complaints, but also to feigners. In Study 2, approximately half of both groups confirmed that they tried to provide consistent scores, which confirms the omnibus presence of consistency heuristic (Granhag & Strömwall, Citation1999).
Second, the SRSI did not perform as good as expected. Feigners endorsed significantly more often unlikely symptoms than truth tellers, which is in line with previous research (Merten et al., Citation2016; van Helvoort et al., Citation2019). Yet, looking at the effect sizes, these differences were modest, and the feigning group also endorsed more plausible symptoms than the control group did. Hence, the detection rates, based on the endorsement of pseudosymptoms, were below the chance level (15−31%). These low detection rates correspond well with previous studies in which SRSI had relatively low sensitivity in detecting feigned pain (Boskovic et al., Citation2019). Yet, pain-related symptoms were precisely the most often chosen type of complaint among our feigning participants. Another, perhaps more plausible explanation for the low sensitivity might be that the SRSI was administered on the last day. Thus, feigners’ strategy to imitate recovery or to intentionally lower the scores toward the end of testing might have suppressed sensitivity. However, we cannot exclude a possibility is that our participants were not fully compliant with the study instructions. Another issue concerns the SRSI false positive outcomes. When the control group reported short-term symptoms (Study 1), there were no false positives; however, once participants with chronic symptoms were included, the false positive rate was above 12% (Study 2), indicating a possible limitation of SRSI’s utility in patients with chronic complaints.
Finally, to ensure the reliability of our findings, we re-ran the main analyses on collapsed data set from both studies. The results were in accordance with the previously described findings, once again confirming that amplifying the intensity scores on all testing days (i.e., overreporting) was feigners’ dominant report strategy.
In sum, our findings indicate that consistency per se is not a defining feature of genuine symptom reporting, just as inconsistency is not typical for feigning. The most outstanding characteristic of feigners is their tendency to over-report the intensity of symptoms up to a level that exceeds the intensity levels of those with genuine complaints, an observation that has been often described in the extant literature (Sherman et al., Citation2020). The take home message for clinicians is that consistency and its counterpart (i.e., inconsistency) does not provide a reliable cue to genuine or deceptive symptom reporting. In other words, as things stand, clinicians are well advised to avoid the consistency heuristic in symptom validity assessments of their patients.
Several limitations of our work need to be addressed. First, our studies relied on the experience sampling method (ESM) with help of online tools. Perhaps, participants would have provided different symptom intensity reports had we tested them in a face-to-face situation. However, by using the online tools, we could ensure that participants reported their intensity scores on approximately similar times of the day. Second, the incentives we offered cannot fully imitate the attractiveness of real-life benefits feigners want to obtain. Thus, the ecological validity of this research is limited. Yet, our findings do provide a proof of principle (i.e., the consistency heuristic is not necessarily helpful in detecting feigning) that might also apply to individuals who intentionally feign symptoms. Third, our instructions for the feigning condition were possibly too direct and did not include a background story to which students could relate and that could motivate students to feign in a sophisticated way. Also, we recruited students, who might differ in their responses from actual patients. Specifically, actual patients might rate the intensity of their symptoms higher, making them less distinguishable from feigners’ reports. Hence, the generalizability of our findings is limited. Furthermore, it may be the case that the 5-day period of tracking participants’ responses was not long enough to capture the typical intraindividual response variations that might occur over a longer period. Thus, future studies may want to adopt an approach in which response patterns of patients over a longer period of time are compared to instructed feigners. Another limitation is that we focused on one particular form of inconsistency: intraindividual variability in symptom intensity reports. Obviously, there are other types of inconsistent symptom presentation. For example, feigners’ recall performance might be better than their recognition performance or they might generate more correct answers to difficult than to easy items. Similarly, there is evidence to suggest that feigners respond with more variability to repeatedly administered symptom validity tests than do honest participants (Strauss et al., Citation1999, Citation2002). Our results suggest that intraindividual variance in symptom reports do not provide a clue to feigning, yet, looking into inconsistency in test scores might be a promising research avenue.
Supplemental Material
Download MS Word (25.8 KB)Disclosure statement
The authors did not receive any external funding for this project, and they declare no conflict of interest.
Notes
1 Symptom fabrication driven by external incentives is labeled as “malingering.” However, when the incentives are not known, nor clearly defined, the term “feigning” is more commonly used. Therefore, we will use this term.
References
- Bianchini, K. J., Greve, K. W., & Glynn, G. (2005). On the diagnosis of malingered pain-related disability: Lessons from cognitive malingering research. The Spine Journal: Official Journal of the North American Spine Society, 5(4), 404–417. https://doi.org/10.1016/j.spinee.2004.11.016
- Blaney, P. H. (2014). Medical model of mental disorders. In Cautin, R. L. & Lilienfeld, S. O. (Eds.), The Encyclopedia of Clinical Psychology (pp. 1–6). John Wiley & Sons, Inc. https://doi.org/10.1002/9781118625392.wbecp382
- Boskovic, I., Merckelbach, H., Merten, T., Hope, L., & Jelicic, M. (2019). The self-report symptom inventory as an instrument for detecting symptom over-reporting. European Journal of Psychological Assessment, 36, 730–739. https://doi.org/10.1027/1015-5759/a000547
- Fishbain, D. A., Cutler, R., Rosomoff, H. L., & Rosomoff, R. S. (1999). Chronic pain disability exaggeration/malingering and submaximal effort research. The Clinical Journal of Pain, 15(4), 244–274. https://doi.org/10.1097/00002508-199912000-00002
- Frueh, B. C., Gold, P. B., & de Arellano, M. A. (1997). Symptom overreporting in combat veterans evaluated for PTSD: Differentiation on the basis of compensation seeking status. Journal of Personality Assessment, 68(2), 369–384. https://doi.org/10.1207/s15327752jpa6802_8
- Granhag, P. A., & Strömwall, L. A. (1999). Repeated interrogations-stretching the deception detection paradigm. Expert Evidence, 7(3), 163–174. https://doi.org/10.1023/A:1008993326434
- Greve, K. W., Bianchini, K. J., & Brewer, S. T. (2013). The assessment of performance and self-report validity in persons claiming pain-related disability. The Clinical Neuropsychologist, 27(1), 108–137. https://doi.org/10.1080/13854046.2012.739646
- Hong, V., Pirnie, L., & Shobassy, A. (2019). Antisocial and borderline personality disorders in the emergency department: Conceptualizing and managing “malingered” or “exaggerated” symptoms. Current Behavioral Neuroscience Reports, 6(4), 127–132. https://doi.org/10.1007/s40473-019-00183-4
- Jelicic, M., Merckelbach, H., & Boskovic, I. (2017). Seven myths about feigning. In H. Otgaar & M. L. Howe (Eds.), Finding the truth in the courtroom: Handling deception, lies, and memories. Oxford University Press.
- McDermott, B. E., & Feldman, M. D. (2007). Malingering in the medical setting. Psychiatric Clinics of North America, 30(4), 645–662. https://doi.org/10.1016/j.psc.2007.07.007
- Merckelbach, H., Boskovic, I., Pesy, D., Dalsklev, M., & Lynn, S. J. (2017). Symptom overreporting and dissociative experiences: A qualitative review. Consciousness and Cognition, 49, 132–144. https://doi.org/10.1016/j.concog.2017.01.007
- Merten, T., & Merckelbach, H. (2013). Symptom validity testing in somatoform and dissociative disorders: A critical review. Psychological Injury and Law, 6(2), 122–137. https://doi.org/10.1007/s12207-013-9155-x
- Merten, T., Merckelbach, H., Giger, P., & Stevens, A. (2016). The Self-Report Symptom Inventory (SRSI): A new instrument for the assessment of distorted symptom endorsement. Psychological Injury and Law, 9(2), 102–111. https://doi.org/10.1007/s12207-016-9257-3
- Mittenberg, W., Patton, C., Canyock, E. M., & Condit, D. C. (2002). Base rates of malingering and symptom exaggeration. Journal of Clinical and Experimental Neuropsychology, 24(8), 1094–1102. https://doi.org/10.1076/jcen.24.8.1094.8379
- Morton, V., & Torgerson, D. J. (2003). Effect of regression to the mean on decision making in health care. BMJ (Clinical Research ed.), 326(7398), 1083–1084. https://doi.org/10.1136/bmj.326.7398.1083
- Peace, K. A., Porter, S., & Cook, B. L. (2010). Investigating differences in truthful and fabricated symptoms of traumatic stress over time. Psychological Injury and Law, 3(2), 118–129. https://doi.org/10.1007/s12207-010-9078-8
- Petrie, K. J., Faasse, K., Crichton, F., & Grey, A. (2014). How common are symptoms? Evidence from a New Zealand national telephone survey. BMJ Open, 4(6), e005374. https://doi.org/10.1136/bmjopen-2014-005374
- Rogers, R., Vitacco, M. J., & Kurus, S. J. (2010). Assessment of malingering with repeat forensic evaluations: Patient variability and possible misclassification on the SIRS and other feigning measures. Journal of the American Academy of Psychiatry and the Law Online, 38, 109–114.
- Sherman, E. M. S., Slick, D. J., & Iverson, G. L. (2020). Multidimensional malingering criteria for neuropsychological assessment: A 20-year update of the malingered neuropsychological dysfunction criteria. Archives of Clinical Neuropsychology: The Official Journal of the National Academy of Neuropsychologists, 35(6), 735–764. https://doi.org/10.1093/arclin/acaa019
- Strauss, E., Hultsch, D. F., Hunter, M., Slick, D. J., Patry, B., & Levy-Bencheton, J. (1999). Using intraindividual variability to detect malingering in cognitive performance. The Clinical Neuropsychologist, 13(4), 420–432. https://doi.org/10.1076/1385-4046(199911)13:04;1-Y;FT420
- Strauss, E., Slick, D. J., Levy-Bencheton, J., Hunter, M., MacDonald, S. W., & Hultsch, D. F. (2002). Intraindividual variability as an indicator of malingering in head injury. Archives of Clinical Neuropsychology: The Official Journal of the National Academy of Neuropsychologists, 17(5), 423–444.
- van der Heide, D., Boskovic, I., van Harten, P., & Merckelbach, H. (2020). Overlooking feigning behavior may result in potential harmful treatment interventions: two case reports of undetected malingering. Journal of Forensic Sciences, 65(4), 1371–1375. https://doi.org/10.1111/1556-4029.14320
- van Helvoort, D., Merckelbach, H., & Merten, T. (2019). The Self-Report Symptom Inventory (SRSI) is sensitive to instructed feigning, but not to genuine psychopathology in male forensic inpatients: An initial study. The Clinical Neuropsychologist, 33(6), 1069–1082. https://doi.org/10.1080/13854046.2018.1559359
- Verhagen, S. J., Hasmi, L., Drukker, M., van Os, J., & Delespaul, P. A. (2016). Use of the experience sampling method in the context of clinical trials. Evidence-Based Mental Health, 19(3), 86–89. https://doi.org/10.1136/ebmental-2016-102418
- Young, G. (2015). Malingering in forensic disability-related assessments: Prevalence 15 ± 15%. Psychological Injury and Law, 8(3), 188–199. https://doi.org/10.1007/s12207-015-9232-4