Abstract
The Ethiopian health system faces persistent inequities in health-care utilization and outcomes, despite continued efforts to expand health service coverage. There is little evidence in the literature describing the status of equity in the quality of healthcare. This paper aims to understand the disparities in quality of antenatal care (ANC) and family planning (FP) among the poor and non-poor communities. We used the 2016 Ethiopia Demographic and Health Survey (DHS) data to compute a Multidimensional Poverty Index (MPI), and the 2014 Service Provision Assessment (SPA) data to assess quality of ANC and FP services—defined as the level of adherence to World Health Organization (WHO) clinical and service guidelines. We merged the two datasets using geographical coordinates, and aggregated service users into facility catchment area clusters using a 2-km radius for urban and 10-km radius for rural facilities. We computed ANC and FP quality and MPI indices for each facility and assigned these to catchment areas. Using the international cutoff point for deprivation (MPI = 33.3%), we evaluated whether the quality of ANC and FP services varies by poor and non-poor catchment areas. We found that most of catchment areas (75.7%) were deprived. While the overall quality of ANC and FP services are low (33% and 34% respectively), we found little variation in the distribution of the quality of these services between poor and non-poor areas, urban and rural settings, or regionally. The short-term focus needs to be on improving the overall quality of services rather than on its distribution.
Introduction
Ethiopia has made significant progress over the last two decades in improving access to maternal and child health services. As a result, child and maternal mortalities have decreased significantly,Citation1 although Ethiopia still remains one of the places with the highest rate of mortalities in the world.Citation2 While achieving a significant reduction in maternal mortality requires further expansion of health service coverage, it is equally important to improve the quality of care provided, including ensuring consistent availability of essential inputs and adherence to clinical procedures when providing care.
Despite increased efforts to expand health service coverage across the country, the Ethiopian health system continues to face inequitable utilization of healthcare, resulting in disparities in health outcomes among different segments of the population. For example, the recent National Health Accounts survey documented that people in the poorest wealth quintile households were less likely to seek care compared with their counterparts in the richest households, despite the former reporting a higher incidence of illness.Citation3 Large regional and gender disparities in health seeking behavior were also documented.Citation3 Furthermore, disparities have been reported in health outputs and outcomes, including in antenatal care, facility-based deliveries, and child mortalities between different geographic and socioeconomic groups.Citation4
Inequity in healthcare refers to differences in access, utilization, output, or outcome that are not due to clinical needs, preferences of clients or appropriateness of intervention.Citation5 Health-care inequity implies the existence of systematic disparities in health or major determinants of health between different groups, such as regions, urban and rural areas, social, economic, cultural, or religious groups, or by age or gender. As such, equity in health refers to fairness in healthcare provision—mainly an equal chance of treatment for the same condition as well as fairness in the distribution of health benefits among different groups—irrespective of socioeconomic, demographic, cultural, or geographic differences.
Equity was emphasized as one of the key transformational agendas in the Ethiopian Health Sector Transformation Plan (HSTP) to address disparities in access to healthcare, its utilization, and outcome. Ensuring an equitable distribution of good-quality care was one of the key targets of the HSTP where “the quality of care provided does not differ by any personal characteristics including age, gender, socioeconomic status, or place of residence.”Citation6 While the existence of disparities in health utilization, outputs and outcomes in Ethiopia are well known,Citation4 the level of (in)equity in quality of care has not been documented.
This paper seeks to understand the equity of quality of women’s reproductive health-care services—adherence to the clinical standards of antenatal care and family planning services—among poor and non-poor facility catchment areas in Ethiopia. Understanding the equity of quality of care among different geographic and socioeconomic groups will help the health system better target equity improvement initiatives among different socioeconomic groups and geographic areas with will support the effort to achieve the HSTP targets.
Materials and Methods
Data Sources
We used the 2016 nationally representative Ethiopia Demographic and Health Survey (DHS) data for constructing MPI,Citation4 and the 2014 Ethiopia Services Provision Assessment Plus (SPA+) data for computing the ANC and FP quality indices.
The Ethiopia DHS survey is undertaken approximately every five years since 2000, collecting socioeconomic, demographic, and health data from households and individuals for every survey. With a representative sample and response rate of over 95%, DHS has been a reliable source of data for measuring progresses in health development in several developing countries. This study draws data on dwelling conditions, ownership of assets, educational as well as nutritional status of households from the 2016 Ethiopia DHS survey that collected data from over 17,000 HHs.Citation4
The 2014 Ethiopia SPA+ is also a nationally and regionally representative health facility survey covering 1,327 of the 23,123 public and private facilities available in the country.Citation7 This sample included a census of hospitals and a random sample of health centers, health posts, and private clinics representing facilities in all nine regions and two city administrations of Ethiopia. SPA+ survey collected data on availability of services, facility readiness, observation of clinical actions, and exit interviews on client experience with health-care providers.Citation7
A total of 1,640 ANC consultations were observed in 284 facilities and 1,+026 FP consultations were observed in 239 facilities. Over 70% of these observations occurred in urban areas, and 85% of them in public facilities. Hospitals and health centers constituted about 94% of FP and 97% of ANC observations, while health posts and private clinics provided the remaining observed services. shows the distribution of facilities and ANC and FP observations by region.
Measure of Socioeconomic Status
Socioeconomic status, such as the level of poverty, is often represented by one-dimensional measures, such as income or expenditure. However, poverty is manifested by various aspects of economic and social conditions, and no one particular indicator alone can capture the multiple dimensions of one’s socioeconomic status. The multidimensional poverty index (MPI), developed by the Oxford Poverty and Human Development Initiative,Citation8 is considered a better tool to capture multiple aspects of poverty experienced by an individual, household, or community.
The MPI is constructed based on three dimensions: education, health, and living standards. The three dimensions consist of 10 indicators: years of schooling and school attendance, child nutrition and mortality, asset ownership, type of floor, type of cooking fuel, type of sanitation facilities, source of water, and availability of electricity (see Figure A1 list of indicators). Each of the dimensions and each of the indicators within a dimension are given an equal weight, and MPI score is calculated using the weighted indicators. A person or household is considered multi-dimensionally poor, if they are deprived in at least one-third of the weighted indicators, which implies that 33.3% is used as MPI cutoff point to differentiate the poor from non-poor.Citation8 We assessed the level of poverty by measuring MPI for each facility catchment area—167 for ANC and 142 for FP—after dropping catchment areas represented by less than five households.
Measure of Quality of ANC and FP Services
Measuring the quality of ANC and FP services is not straightforward, and not every aspect of quality can be measured.Citation9 Studies often use availability of inputs, such as drugs and health workers, processes by which services are delivered, and availability of infrastructure as proxies for quality of care.Citation10 However, although these inputs are crucial to high-quality health systems, the availability of inputs alone does not guarantee good-quality care.Citation11 For example, it has been shown that structural quality is a poor correlate of care competence.Citation12
We constructed quality indices using data from observations of consultations and adherence to clinical actions recommended by the WHO and Ethiopian national guidelines for ANC and FP services.Citation13–16 ANC and FP quality was determined by measuring the level of adherence by care providers to the standard clinical guidelines for provision of these services (see Figures A2 and A3 for list of services and clinical actions for ANC and FP services used to construct indices).Citation17 It’s known that provision of services with the expected protocols, safety, and ethical standards is expected to enhance quality of services.Citation18
Analysis
We merged the 2016 Ethiopia DHS and 2014 Ethiopia SPA+ datasets using geocodes. In urban areas, households surveyed in the DHS and living within a 2-km radius of a SPA+ facility were considered to be within that facility’s catchment area. In rural areas, households sampled in the DHS and living within a 10-km radius of a SPA+ facility were thought to be within that rural facility’s catchment area (sensitivity tests were also undertaken using 1 km and 5 km as well as 5 km and 15 km for urban and rural areas, respectively, given that DHS location data include random error that potentially displaces points by 2–10 km).
We first computed deprivation indices for each dimension of poverty (education, health, and living standards) using the 10 indicators of poverty as discussed above (see Figure A1). This was followed by computation of a composite index (MPI) for the three dimensions of poverty, after which a poverty head count ratio (proportion of individuals in poverty) was computed within the defined radius catchment areas. The MPI is a product of the number of those impoverished (head count ratio) and the average poverty rate (the intensity of poverty). MPI was computed for each of the catchment areas of the facilities surveyed in SPA+, and was later aggregated by region and place of residence (urban/rural). Following Sharma et al.,Citation19 we then classified catchment areas into quintiles using the % share of the poor in the catchment area using the international poverty (MPI) cutoff point of 33.3%.
We finally computed quality of ANC and FP services (i.e., the percentage of actions taken out of those expected as per the clinical guidelines) using observational data obtained from SPA+ data. Quality indices were generated using the ratio of clinical actions performed and the frequency of expected actions based on the number of clinical observations. We then computed ANC and FP quality by level of poverty in the catchment areas, and we used concentration curves to show the distribution of (in)equity of quality of ANC and FP services between poor and non-poor catchment areas. We also conduct Kruskal-Wallis Test to examine the differences on disparity in quality of ANC by level of poverty at MPI at 33.3% cutoff point. Comparison of ANC and FP quality was then made by region, level of urbanization, and type and ownership of facility where services were provided (i.e., health center, hospital, public, private, etc.).
Results
Multidimensional Poverty
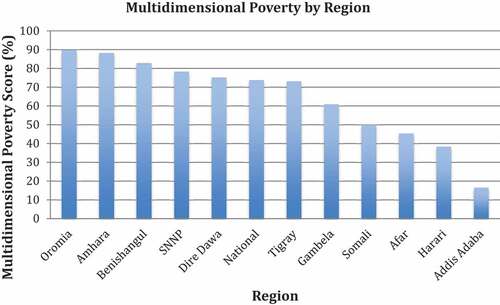
The national level of multidimensional poverty was calculated to be 75.7%, implying the existence of high level of multidimensional poverty in the country. The regional breakdown of MPI shows that Oromia and Amhara regions have the largest share of multidimensionally poor households, while the predominantly urban regions of Addis Ababa and Harari have among the lowest shares of multidimensionally poor households. As expected, MPI results show that Addis Ababa (the capital city) is the least multidimensionally poor region, with an MPI score of 22.6% (see below).
Figure 1. Multidimensional Poverty in Ethiopia by Region
Quality of ANC and FP Services
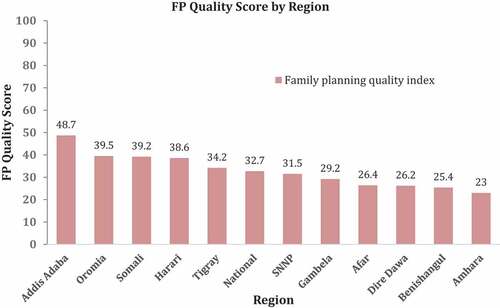
Quality of maternal care computed from SPA+ data showed a generally low level of quality of ANC and FP services (i.e., a low level of adherence to ANC and FP service guidelines). More specifically, women who sought ANC and FP services were provided, respectively, with only 33% and 34% of clinical actions recommended by the WHO or national guideline. Levels of ANC quality were relatively higher in Amhara and Tigray regions (47% and 39%, respectively), while Oromia and Gambella regions scored lowest on ANC quality (24.5% and 30%, respectively). Likewise, Addis Ababa provided the highest quality FP services (49%), while Amhara scored the lowest FP quality (23%). Overall, there was little variation in the quality of ANC and FP services across regions ().
Figure 2. Quality of Antenatal Services by Region
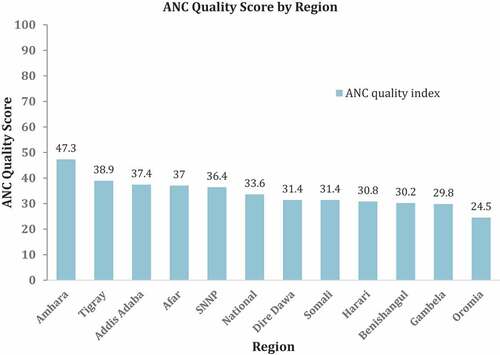
Figure 3. Quality of Family Planning Services by Region
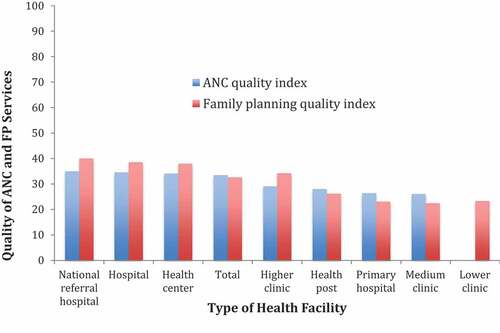
Hospitals tended to provide marginally better-quality services (more complete ANC and FP services), while lower clinics and health posts scored a lower quality score for these services. We found no difference in ANC and FP quality between public facilities and private clinics ().
Figure 4. Quality of Antenatal and Family Planning Services by Facility Type
Quality of Reproductive Health Care and Poverty
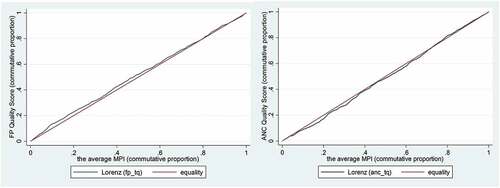
We did not find significant differences in the quality (completeness) of ANC and FP services provided in communities with different levels of multidimensional poverty. Women from both poor and non-poor areas receive about the same quality of reproductive health services. ANC quality in the poorest MPI quintile was 33% compared to only 32% in the richest MPI quintile. FP quality in the poorest MPI quintile was 33% compared with 37% in the richest MPI quintile (). However, none of these differences were statistically significant as observed in where the concentration curves for ANC and FP quality are quite close to the line of perfect equality with concentration index for ANC = 0.02, P-value = 0.07, and concentration index for FP = −0.03, P-value = 0.09. We also conducted Kruskal–Wallis Test to examine the differences on disparity in quality of ANC and FP by level of poverty at MPI at 33.3% cutoff point. We found no significant differences (Chi square = 6.033, p = .1967, df = 4 for ANC and Chi square = 2.761, p = .5985, df = 4 for FP) in quality of care among the five categories of level of poverty shown in .
Figure 5. Quality of ANC and FP Services by Level of Poverty
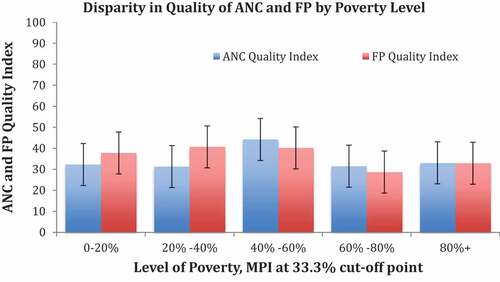
Figure 6. Concentration Curve of the Quality of ANC and FP Services
Discussion
Health equity has been a focus of the international health agenda for some time now, and it is one of the transformational agenda in Ethiopia’s HSTP (2015/16-2019-20). While there is a growing body of literature on the equity of health utilization and outcomes in Ethiopia, there has been very little evidence on (in)equities in health-care quality.
This paper sought to understand whether the quality of reproductive health-care services varies between the poorer and richer communities in Ethiopia. We found that the quality of these services were low despite the fact that the coverage of both ANC and FP increased significantly in recent years.Citation17 We also found that there was little disparity in ANC and FP quality across MPI groups, as the quality of these services is low for everyone. Likewise, we found no significant differences in the quality of these services between urban and rural areas, public and private facilities or across regions.
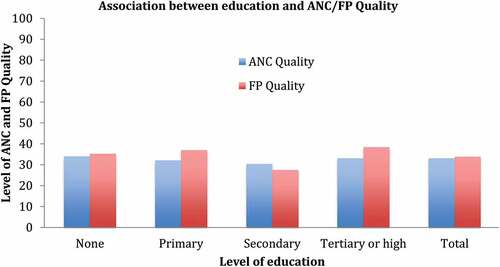
We undertook sensitivity tests using smaller and larger radius catchment areas to observe whether inclusion or exclusion of service users from closer and further locations affect the level of poverty and the inequalities in care quality. We found no significant differences in poverty or in quality of care (Figure A4). We also checked whether our findings were consistent if one uses a different socioeconomic indicator—level of education of the mother rather than community or household-level poverty indicator. This test shows that there is no significant disparity in quality of ANC and FP care with the level of educational status.
Why Low Quality of ANC and FP Services?
There are many possible reasons for lack of adherence to ANC and FP guidelines. Providers may fail to adhere to the service guideline or the actions they know they need to perform (know-do-gap) due to negligence, low level of motivation, lack of sufficient training on the guidelines, or lack of supportive supervision and monitoring or lack of clinical evaluation.Citation20 There are also other elements of quality of care, such as availability of basic infrastructure, supplies and equipment—that were not assessed in this study—that might affect the level of adherence of service provision to clinical guidelines. For example, having a separate room for ensuring client privacy and confidentiality, or uninterrupted access to clean water to wash hands before and after examination affects quality of care. Overall facility readiness—which is 55% in EthiopiaCitation21—is, therefore, another factor that is likely to be associated with the level of quality of care. Finally, the measure of quality in this study captured only the proportion of recommended clinical actions provided to patients; other important components of quality—such as administrative processes and cost of care—were not assessed or included in the quality indices.
Equitably Poor Quality?
One explanation for why there are no socioeconomic inequalities in quality of care is the fact that the overall quality of maternal care is low, possibly for some of the reasons highlighted above, which implies there is no significant difference in the levels of quality between the least and most deprived areas. Secondly, since the federal government has standard allocations for financing and human resource allocation by facility type, public facilities in least and most deprived areas catchment areas may have similar levels of funding and number of health workers and other health inputs irrespective of the volume or quality of health output, which might provide little incentive for providers to invest in quality improvement initiatives. Thirdly, this might reflect similarities in quality of inputs (e.g., number and level of training and qualification of health workers) that the health system uses in service delivery. Nevertheless, further investigation is important to fully understand the drivers of low quality of care in Ethiopia.
Why Disparities in Coverage and Health Outcomes Then?
Despite the apparent uniformity in quality of care—between regions, level of poverty, and urban vs. rural areas—documented in this analysis, the levels of service utilization (such as institutional delivery, and utilization of family planning services) and health outcomes (including fertility rates, maternal and newborn mortality rates) between these groups are significantly different.Citation4 Hence, further investigation is important to understand the root causes of differences in health utilization and outcomes between different groups. It is also important to recognize that some disparities in health outcomes could be caused by factors outside the health systems, for example, because of disparities in level of education. There could still be disparities in health utilization and outcomes among different groups, even when there is equal access to the same quality of healthcare at the same cost and distance, implying the need for multi-sectoral approach in addressing inequity. Finally, it is important to note that this study does not assess the quality of other key indicators of maternal care—such as labor and delivery—which are important determinants of maternal and child outcomes.
Limitations of Study
One limitation of this study is that our MPI—which was constructed using DHS-collected wealth indicators—measures the deprivation rate of facility catchment areas using only the households sampled in the DHS, not necessarily that of individuals who were observed using ANC or FP services in the SPA+ survey. To validate the relationship between quality and MPI, we undertook a sensitivity analysis using educational status of mothers who were observed during the SPA+ while using ANC and FP services as a proxy for MPI, and we found consistent results with the distribution of ANC and FP quality when using MPI of the catchment area (see Figure A5).
The assumption of the 2- and 10-km catchment areas, respectively, for an urban- and rural-based facility may not be the true catchment area of the sampled facilities, since facilities are not always located at the center of their catchment areas (and since DHS location data has a random error that might displace points 2 to 10 km). Additionally, some clients (up to 30% in NHA survey) sometimes opt to travel more distance or bypass the nearest facility to seek care elsewhere.Citation3 These behaviors are not accounted for in this analysis. To test the sensitivity of our assumed catchment population on the results, we changed facility catchment areas to smaller and larger catchment radiuses (1- and 5-km radius in urban and 5- and 15-km radius in rural areas)—which may add/drop poorer or richer communities to the catchment population. The result again is consistent with our initial findings, that is, there is no significant variation in the level of quality of care between poor and non-poor communities.
Finally, our quality indices were based on data from observations, which are prone to measurement errors. Another study that measured inequalities in ANC quality—based on women’s self-report of the content of ANC consultations—showed that the poorest women in Ethiopia were substantially less likely to report having their blood pressure checked and their urine and blood analyzed during ANC consultations compared to the richest women.Citation22 This implies that further work is needed to determine why inequalities based on self-reports and observations of care differ. Furthermore, more studies are needed that account for facility- and community-level characteristics that determine quality and health seeking as well as equity in quality of care.
Conclusion
The overall quality of ANC and FP services in Ethiopia is low, and we did not find significant disparity in the quality of these services across socioeconomic status or geography. This implies that the health system needs to focus on ensuring that providers are aware of and following the appropriate clinical guidelines and standards for women’s reproductive health services in all regions and types of facility. Furthermore, measuring other elements of quality, such as availability, functionality, and utilization of inputs and infrastructure, may uncover different findings on the equity of quality of care, and should be undertaken to supplement our findings.
Disclosure of Potential Conflicts of Interest
No potential conflict of interest was reported by the author(s).
Contributors
GD, TG and MEK designed the study. ED and GD compiled the data and undertook the analyses. ED SH, YA, CA, BY, and PB contributed to the interpretation of results. GD wrote the first draft of the manuscript. All authors reviewed, contributed to, and approved the final manuscript.
Additional information
Funding
References
- Berhan Y, Berhan A. Review of maternal mortality in Ethiopia: a story of the past 30 years. Ethiop J Health Sci. 2014;24(0 Suppl): 3–12.
- Tessema GA, Laurence CO, Melaku YA, Misganaw A, Woldie SA, Hiruye A, Amare AT, Lakew Y, Zeleke BM. Trends and causes of maternal mortality in Ethiopia during 1990-2013: findings from the global burden of diseases study 2013. BMC Public Health. 2017;17(160).
- MOH. Ethiopian health accounts household health service utilization and expenditure survey 2015/16. Addis Ababa (Ethiopia): Federal Ministry of Health; 2017.
- Central Statistical Agency of Ethiopia and ICF International. FEDERAL DEMOCRATIC REPUBLIC OF Ethiopia Ethiopia demographic and health survey 2016 key indicators report. Ethiopians Water Sect Dev Program. 2016.
- Arcaya MC, Arcaya AL, Subramanian SV. Inequalities in health: definitions, concepts, and theories. Glob Health Action. 2015;8:27106. doi:10.3402/gha.v8.27106
- Federal Democratic Republic of Ehiopia Ministry of Health. Health sector transformation plan 2015/16-2019/20. Addis Ababa, Ethiopia: Federal Ministry of Health; 2015.
- Ethiopian Public Health Institute. FMOH I. Ethiopia service provision assessment plus survey. Addis Ababa, Ethiopia: Ethiopian Public Health Institute; 2014.
- Alkire S, Conconi A, Roche JM. Multidimensional poverty index 2013: brief methodological note and results. Oxford Poverty & Human Development Initiative (OPHI), Oxford Department of International Development, Queen Elizabeth House (QEH), University of Oxford; 2013.
- Raleigh VS, Foot C. Getting the measure of quality: opportunities and challenges. London (UK): The King‘s Fund; 2010.
- Hanefeld J, Powell-Jackson T, Balabanova D. Understanding and measuring quality of care: dealing with complexity. Bull World Health Organ. 2017;95(5):368–374.
- Kruk ME, Gage AD, Arsenault C, Jordan K, Leslie HH, Roder-DeWan S, Adeyi O, Barker P, Daelmans B, Doubova SV. High-quality health systems in the sustainable development goals era: time for a revolution. The Lancet Global Health. 2018; e1196–e1252.
- Leslie HH, Sun Z, Kruk ME. Association between infrastructure and observed quality of care in 4 healthcare services: a cross-sectional study of 4,300 facilities in 8 countries. PLoS Med. 2017;14(12): e1002464. doi:10.1371/journal.pmed.1002464
- World Health Organzation. Standards for improving quality of maternal and newborn care in health facilities. Geneva (Switzerland): World Health Organization; 2016.
- World Health Organization. WHO recommendations on antenatal care for a positive pregnancy experience. Geneva (Switzerland): World Health Organization; 2016.
- World Health Organization. WHO recommendations on antenatal care for a positive pregnant experience. Geneva (Switzerland): World Health Organization; 2016.
- Federal Ministry of Health. National guideline for family planning services in Ethiopia. Addis Ababa (Ethiopia): Federal Democratic Republic of Ethiopia; 2011.
- Yakob B, Gage A, Nigatu TG, Hurlburt S, Hagos S, Dinsa G, et al. Low effective coverage of family planning and antenatal care services in Ethiopia. Int J Qual Heal Care. 2019;31(10): 725–732.
- Donabedian A. Evaluating the quality of medical care. 1966. Milbank Q. 2005;83(4): 691–729. doi:10.1111/j.1468-0009.2005.00397.x
- Sharma J, Leslie HH, Kundu F, Kruk ME. Poor quality for poor women? Inequities in the quality of antenatal and delivery care in Kenya. PLoS One. 2017;12(1). doi:10.1371/journal.pone.0171236
- Gage AD, Kruk ME, Girma T, Lemango ET. The know-do gap in sick child care in Ethiopia. PLoS One. 2018;13(12). doi:10.1371/journal.pone.0208898.
- Ethiopian Public Health Institute and the Federal Ministry of Health. Addis Ababa (Ethiopia): Ethiopian Public Health Institute and the Federal Ministry of Health; 2018. Available from: https://www.ephi.gov.et/images/pictures/download_2011/Ethiopia-Service-Availability-and-Rediness-Assessment-SARA-report-2018.pdf
- Arsenault C, Jordan K, Lee D, Dinsa G, Manzi F, Marchant T, Kruk ME. Equity in antenatal care quality: an analysis of 91 national household surveys. Lancet Glob Heal. 2018;6(11):e1186–e1195. doi:10.1016/S2214-109X(18)30389-9
Appendices
Table A1. Weighted family planning and antenatal care visits by location, ownership, facility type, and region in Ethiopia SPA+, 2014
Figure A1. Dimensions and Indicators of Poverty for Multidimensional Poverty Index.
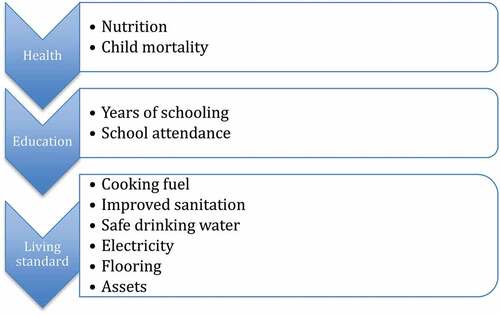
Figure A2. List of FP clinical actions and % performed.
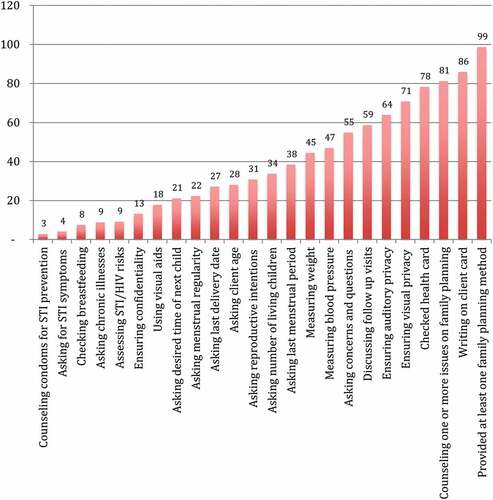
Figure A3. List of ANC clinical actions and % performed.
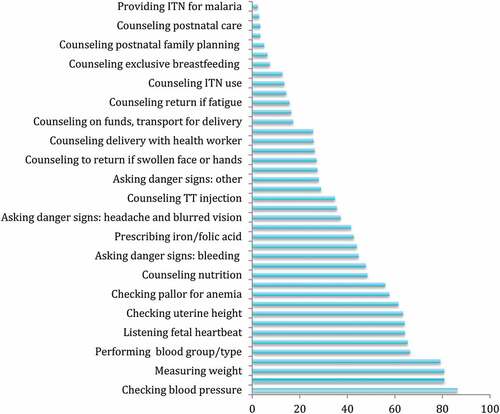
Figure A4. Sensitivity test using larger catchment area (5 and 15 km radius).
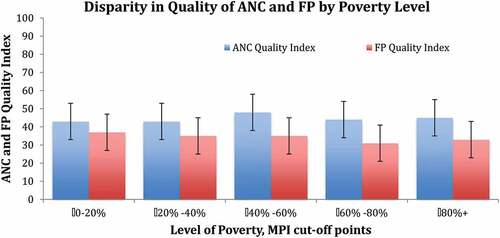
Figure A5. Sensitivity test using educational status of service users.