ABSTRACT
Improving the quality of primary care is essential for achieving universal health coverage in low- and middle-income countries. This study examined the level and variation in primary care provider knowledge and effort in Cambodia, using cross-sectional data collected in 2014–2015 from public sector health centers in nine provinces. The data included clinical vignettes and direct observations of processes of antenatal care, postnatal care, and well-child visits and covered between 290–495 health centers and 370–847 individual providers for each service and type of data. The results indicate that provider knowledge and observed effort were generally low and varied across health centers and across individual providers. In addition, providers’ effort scores were generally lower than their knowledge scores, indicating the presence of a “know-do gap.” Although higher provider knowledge was correlated with higher levels of effort during patient encounters, knowledge only explained a limited fraction of the provider-level variation in effort. Due to low baseline performance and the know-do gap, improving provider adherence to clinical guidelines through training and practice standardization alone may have limited impact. Overall, the findings suggest that raising the low quality of care provided by Cambodia’s public sector will require multidimensional interventions that involve training, strategies that increase provider motivation, and improved health center management. The authors reported there is no funding associated with the work presented in this article.
Introduction
As low- and middle-income countries (LMICs) move toward universal health coverage, substantial efforts have been made to enhance the capacity of public sector primary care facilities and reduce the financial barriers to essential health services.Citation1–3 As a top policy priority, access to maternal, newborn, and child health services, including antenatal care, skilled birth attendance, and postnatal and well-child care, has continued to rise across LMICs and reached near-universal coverage in some countries.Citation4 Despite this significant expansion of coverage, there is still substantial preventable maternal and newborn morbidity and mortality,Citation5,Citation6 which is suggestive of gaps in the quality of care and performance of primary care providers.Citation7–10 While limited clinical knowledge of providers remains a significant constraint,Citation11 there is growing concern over low effort exerted by providers, as evidence from a number of LMICs shows that primary care providers often fail to do what they know are the best practices in actual patient encounters (the know-do gap).Citation12–15
Since the early 1990s, the Cambodian government has undertaken a series of initiatives to expand access to primary care and strengthen the performance of public sector providers, with a specific focus on routine maternal, newborn and child health services.Citation16 A national network of over 1,100 health centers has been established to provide basic health services to 8,000–12,000 people each.Citation17 Health centers, together with referral hospitals and health posts (which serve remote areas), are organized into Operational Districts (OD), which form the lowest level of Cambodia’s public health system. The scope of practice for health centers is set forth in the Guidelines on Minimum Package of Activities, which includes maternal, newborn, child and reproductive services, services for certain communicable and non-communicable diseases, and health education and health promotion.Citation18
Cambodia has also experimented with performance-based financing (PBF) to increase provision of certain health services, particularly maternal and child health care, at public health facilities.Citation19 In 2009, the government started converting some ODs, selected primarily based on their readiness for management autonomy, into Special Operating Agencies (SOA). SOAs use performance-based internal contracting to enhance provider accountability and help their health centers with annual operational planning and performance review.Citation20,Citation21 To reduce the burden of out-of-pocket costs, the country introduced Health Equity Funds (HEF) in the early 2000s that cover user fees for services received by eligible beneficiaries, primarily low-income individuals, at public health facilities.Citation22,Citation23 HEFs were rolled out to health facilities gradually over time but the scale-up was accelerated during 2015. By the end of 2015, HEFs had been rolled out to all public health facilities,Citation24,Citation25 currently covering more than 3 million beneficiaries.Citation26
As a result of these initiatives, access to skilled maternal and newborn care in Cambodia has increased considerably. For example, in 2014, over 90% of women with a pregnancy in the previous 5 years received antenatal care from a trained provider, up from about 38% in 2000, and 83% delivered in a health facility, as compared to 10% in 2000. In addition, public health facilities accounted for over 80% of institutional deliveries in 2014.Citation27,Citation28
As utilization at public sector facilities continues to grow, achieving further improvement in maternal and child health increasingly depends on the quality of care and thus the competence and effort of frontline health care workers. This includes, for example, providing adequate antenatal care to identify and manage existing health conditions of pregnant women and pregnancy complications to prevent maternal deaths, maintaining and increasing coverage for childhood vaccines, and providing growth monitoring and counseling to address malnutrition that afflicts about a third of Cambodian children under the age of five.Citation29
In this study, we assessed the quality of basic maternal, newborn, and young child health care services provided at health centers in Cambodia by examining what providers at these health centers know and what they do. Specifically, we focused on provider knowledge of clinical guidelines of antenatal, postnatal and well-child care and their effort in delivering these services at health centers in nine provinces of Cambodia. Our analysis relied on cross-sectional data from clinical vignettes and direct observations of clinical encounters. We created measures of provider knowledge based on the vignettes, and measures of provider effort in actual practice (in absolute terms and relative to knowledge) using the direct observations. We analyzed factors associated with provider knowledge and effort and decomposed variances in knowledge and effort into operational district, health center, and provider-level components using mixed effects models. This approach can shed light on which levels of the health system should be targeted by future quality improvement strategies. We also simulated the impact of several hypothetical policies to explore the extent to which process quality may be improved through conventional initiatives, such as provider training and quality benchmarking.
Materials and methods
Data and Sample
Our primary data included vignette and direct observation data collected from health centers under the “Level 2” Quality Assessment (L2), a part of the Cambodian government’s recent efforts to strengthen the performance of the public health system. While an earlier “Level 1” assessment focused on structural quality of public health facilities such as facility infrastructure, supplies and staffing, the goal of L2 was to assess baseline process of care quality and provider competency.Citation30 L2 collected data on provider knowledge and practice of guideline-recommended practices for services routinely offered at public health facilities. We obtained L2 data collected from all health centers in nine provinces of Cambodia by the University Research Co., LLC, (URC) for the Cambodian Ministry of Health (MOH).Citation31 The bulk of the data used for this study was collected from 2014 through early 2015, with a small percentage of data collected in late 2012 and 2013. URC developed the assessment instruments based on existing MOH protocols, clinical guidelines, and standard operating procedures.Citation32 The nine provinces covered in our data accounted for nearly 49% of Cambodia’s total population per the latest census (see Appendix for province-level characteristics).Citation33
For health centers, the L2 assessment focused on services in accordance with the Minimum Package of Activities. Each L2 assessment included a knowledge assessment using a clinical vignette and a process-of-care assessment using direct observation of provider effort during actual patient encounters. A provider was scored based on the number of checklist items that they completed during a vignette or patient encounter as observed by the enumerators. Most providers were assessed once for a given vignette, but they could have multiple direct observations for the same service depending on the number of patients they saw during the time when the enumerators were present.
For this analysis, we examined data collected for antenatal care normal visit (ANC), postnatal care normal visit for mothers and newborns between 0 and 6 weeks after birth (PNC), and well-child visit for children under 2 (WCH). The clinical vignettes for these three services were designed to represent normal visits without health concerns presented at the time of the visit or uncovered during the visit. The contents of the vignettes and direct observations are listed in Appendix Tables . We excluded just below 4% of the full sample due to missing values for 30% or more of the checklist items included in a L2 instrument or due to missing provider identifiers. Some assessments may appear to be “incomplete” because of new questions being added later to the L2 instrument; we kept these observations in the analytic sample. Sections concerning documentation, staff attitudes and hygiene in the direct observations were excluded from the analysis, as they were not specific to a particular clinical service and were not part of the vignette assessment. We also dropped checklist items regarding vaccination and prophylaxis from the process-of-care assessments if the patients did not receive vaccine and/or prophylaxis or if we could not tell from the data whether they did.
We supplemented the L2 assessment data with: 1) delivery volume at the health center level from Cambodia’s Health Information System, and information on 2) whether a health center was covered by HEF, 3) whether an operational district was designated as an SOA, and 4) the total population and poverty rate at the administrative district level.Citation34
Outcome Measures
Following existing literature, we considered vignettes as measuring provider clinical knowledge (hereinafter “knowledge score”) and direct observations as measuring provider effort (hereinafter “effort score”).Citation12,Citation35 We constructed summary scores in two ways—a percentage score which equals the percentage of correct responses for each individual vignette or direct observation, and a standardized z-score derived from the sample mean and standard deviation of the percentage score. We relied on the percentage score for summary statistics and used the standardized score as the dependent variable in regression analysis given ease of interpretation. As mentioned above, we retained observations with missing values for less than 30% of checklist items in each L2 assessment. If a checklist item was missing, the score was calculated out of the total number of items observed. Less than 1% of the analytic sample had missing values.
Statistical Analysis
Our main analysis used linear mixed effects models with nested random effects to decompose the variance in knowledge and effort scores into operational district, health center, and provider components. We summarized the contributions to variance in the knowledge and effort scores by fixed and random effects using statistics akin to R-squared, based on Nakagawa et al. (2013).Citation36
We estimated two mixed effects models. The first model examined variations in the knowledge scores and effort scores separately using the full analytic sample. To decompose the variances, we included random intercepts at the operational district and health center levels for knowledge scores, and random intercepts at the operational district, health center and individual provider levels for effort scores. We did not include provider random intercepts in the knowledge score regressions, as most providers completed only one vignette for a given service and few health centers had more than one provider completing a vignette. As a result, in the knowledge score regressions, the health center random effects component would capture some of the provider-level variances, and the residual variances would capture the provider-level variances unaccounted for by the model.
Although random effects models can accommodate small size of clusters (health centers or individual providers) provided that there is a large number of clusters,Citation37,Citation38 including both health center and provider random intercepts in the effort score regressions may not be informative if many health centers had only one or few observed individual providers, which was the case for PNC and WCH. Since there was some overlap in the checklist items between PNC and WCH, primarily regarding physical exam on the child and growth monitoring, we also pooled together data from these assessments and ran an additional set of regressions of knowledge and effort scores based on those common child care items. Doing so increased the number of health centers with more than one observed provider and allowed us to better estimate the relative contribution to variance by health centers and individual providers.
In the second model, we analyzed variations in the effort scores using random intercepts at the operational district and individual provider levels. Moreover, we included the knowledge scores as a predictor to assess the relative importance of provider knowledge in explaining variation in the effort scores. For this model, we restricted the sample to providers with data from both vignette and direct observation for the same assessed service and removed checklist items that were not included in both assessment tools. The restricted sample contained about 45% to 64% of the providers with direction observation data. If a provider completed multiple vignettes for the same assessed service, we kept their highest knowledge score. Because most health centers in the restricted sample had only one provider with direct observations of process of care, we did not include health center random intercepts in this model.
In all regressions, we adjusted for a health center’s HEF status and a series of binary variables for health center delivery volume, an operational district’s SOA status, and total population and poverty rate at the administrative district level. In the first model that analyzed knowledge and effort scores separately based on the full analytic sample, we also adjusted for province indicators. We did not adjust for province in the second model to avoid overfitting, as the restricted sample was much smaller.
Finally, we simulated the impact of several policy scenarios on process of care quality to explore how much improvement may be possible in this context. We began with two scenarios featuring practice standardization and benchmarking, using the full analytic sample:
Scenario 1: Standardize performance such that providers’ effort scores equal the highest knowledge or effort scores observed in their own health center.
Scenario 2: Standardize performance such that providers’ effort scores equal the highest knowledge or effort scores observed in their own operational district.
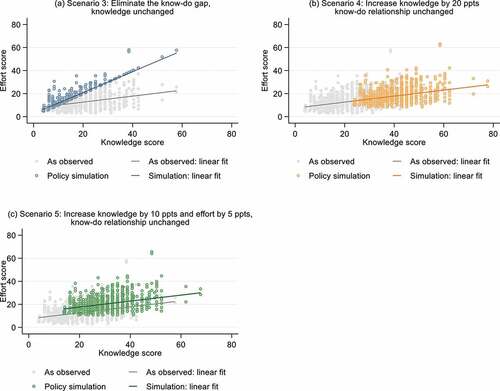
We then simulated three scenarios using the subset of providers with both vignette and direct observation data for the same assessed service. For these scenarios, we built on the work of Ibnat et al. (2019) and considered changes in both the size of the gap between knowledge and effort scores (“know-do gap”) and the slope of the relationship between the two.
Scenario 3: Increase effort of all providers with a positive know-do gap (i.e., knowledge > effort), assuming knowledge remains the same but increasing the slope of the relationship between knowledge and effort.
Scenario 4: Increase knowledge uniformly by 20% points, assuming the slope of the relationship between knowledge and effort remains the same.
Scenario 5. A multidimensional approach that first increases knowledge uniformly by 10% points (which in turn increases effort based on the observed knowledge-effort curve) and then shifts effort uniformly up by 5% points, assuming the slope of the relationship between knowledge and effort remains the same.
Ethical Clearance
The protocol for this study was approved by the Harvard University Institutional Review Board (IRB21–1533) and the National University of Singapore Institutional Review Board (NUS-IRB-2021-976). The analysis of the L2 assessment data for this work was undertaken in consultation with the Cambodian Ministry of Health.
Results
Summary Statistics
reports the summary statistics and the number of observations at each level in the full analytic sample and the restricted sample consisting of providers with both vignette and direct observation data. The sample size varied across assessments, as a provider may not be present or there might not have been any visits for a specific service during the time when the enumerators visited the health center. The full sample and the restricted sample were similar in the available characteristics.
Table 1. Summary statistics of the analytic sample, mean(sd).
Overall, both knowledge and effort scores were low across all three services. Providers scored the highest on ANC assessments, completing an average of 44.8% and 31.6% of the checklist items in vignettes and direct observations, respectively. They scored the lowest on PNC assessments, completing only 13.8% and 7.3% of the checklist items in vignettes and direct observations, respectively. Knowledge scores were in general higher than effort scores in both the full sample and the restricted sample. Based on the restricted sample, the average know-do gap, i.e., the average difference between knowledge score and effort score across observations, ranged from 6.5 (PNC) to 11.1 (ANC) percentage points.
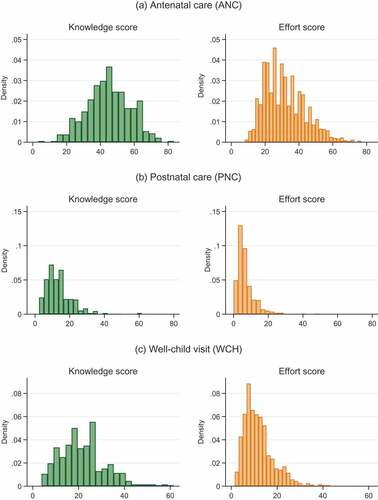
and Appendix Figures A1–A3 show the distributions of knowledge and effort scores overall and by domains of care. Several findings emerge. First, there were substantial variations in both knowledge and effort scores, especially for ANC. Second, for PNC, providers performed poorly across domains of care but particularly so for domains focusing on the mother’s health. Third, while most providers scored low on these assessments, there were a few providers that performed well, but even these high-performing outliers rarely scored over 60% in total on PNC and WCH.
Figure 1. Distributions of knowledge scores from vignettes and effort scores from direct observations.
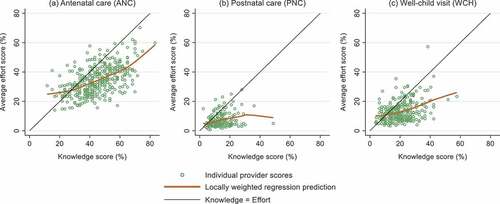
indicates that knowledge scores and effort scores were positively correlated in all three assessed services, but the correlation was weaker for PNC and WCH. Among providers with roughly the same knowledge score, there was considerable variation in their effort scores, suggesting that many factors in addition to provider knowledge likely contributed to observed quality of care. Moreover, most providers’ effort scores fell below their knowledge scores, indicating wide-spread presence of the know-do gap.
Figure 2. Relationship between provider knowledge score and average effort scores.
Regression Results
presents the results from the mixed effects models that analyzed knowledge and effort scores separately based on the full analytic sample. Of the three predictors of interest, an operational district’s SOA status was most consistently associated with higher provider knowledge and effort across all three services. The estimates indicate that providers in districts with SOA designation scored higher on ANC, PNC, and WCH vignettes by 0.51, 0.32 and 0.42 standard deviations, respectively. However, providers at high-volume health centers—a rough proxy for experience—did not perform better than those at low-volume health centers on any assessments except WCH knowledge.
Table 2. Results of linear mixed effects models of knowledge and effort scores (Z-scores) based on full sample.
The conditional random effects estimates show the extent to which an individual unit’s intercept differs from the overall intercept at a certain level. For knowledge scores, the variability in the intercepts was lower at the operational district level and higher at the health center level, suggesting greater variations in knowledge across health centers than operational districts. But, as noted, part of the health center random effects estimates might represent provider-level variations in knowledge, as the samples for knowledge scores were too small to include provider random effects in the regressions. For effort scores, the most variability was observed at the individual provider level, followed by health centers and operational districts.
The pseudo-R-squared indicates that, compared with the random effects, the fixed effects predictors explained only a small share of the total variation in provider performance—ranging from 6.3% for WCH effort to 15.5% for ANC knowledge (). Of the random effects, larger shares of the variances were either at the health center level or at the provider level, whereas the operational district intercepts captured only a small portion of the total variances (). Nonetheless, a substantial portion of the variances in ANC knowledge and ANC effort scores remained unaccounted for. Similar findings were reached when we ran the regressions using the bigger pooled sample of PNC and WCH on shared checklist items ().
Table 3. Results of linear mixed effects models of knowledge and effort scores (Z-scores) based on pooled data from postnatal care (PNC) and well-child visit (WCH) on common checklist items.
reports the mixed model estimates based on the restricted sample of providers with both vignette and direct observation data. As expected, provider knowledge scores were positively correlated with effort scores. An increase in knowledge scores by one standard deviation was associated with an increase in effort scores by 0.44, 0.26 and 0.29 standard deviations for ANC, PNC and WCH, respectively. Including provider knowledge as covariate in the regression increased the share of variances explained by fixed effects considerably; it also reduced the size of the coefficient estimates on SOA status, which is consistent with the fact that SOA status and knowledge scores were positively correlated (as suggested in ). However, the coefficient estimates on SOA status remained relatively large. Lastly, despite the significant association between knowledge and effort scores, much of the variance in effort scores was still captured by the provider random effects instead of the fixed effects ().
Figure 3. Percentage of variance explained by fixed effects and random effects components included in each model.
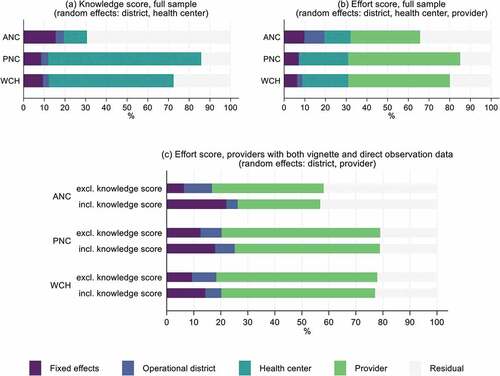
Table 4. Results of linear mixed effects models of effort scores (Z-scores) based on providers with both vignette and direct observation data for the same service.
Policy Simulations
presents the results from our policy simulation exercise, with additional visualizations in Appendix Figures A4–A6. The largest improvements were achieved when provider effort was increased to the same level as the best performing providers in the same operational district (Scenario 2). Scenario 2 might be possible through a combination of training, continuous performance monitoring, and interventions to motivate low-performing providers. Due to low baseline knowledge and the know-do gap (or the weaker relationships between knowledge and effort) for PNC and WCH, none of the other policy scenarios achieved more than a marginal improvement in quality. By contrast, ANC quality improved considerably under the two most realistic scenarios (Scenarios 4, 5) and was only marginally worse than that under the ideal scenario of eliminating the know-do gap (Scenario 3).
Table 5. Effort score in percentage as observed and as simulated under various policy scenarios, mean (sd).
Discussion
Using the L2 quality assessment data, we found that providers working at health centers in nine provinces of Cambodia had low knowledge of and exerted limited effort in delivering antenatal care, postnatal care, and well-child visits. Performance was exceptionally poor for postnatal care, particularly in domains of care related to the mother’s health.
We also observed that knowledge and effort were quite variable. Results from our linear mixed models indicate that much of the variance was at the health center or the individual provider level. An operational district’s SOA designation was an important predictor for knowledge scores and in some cases effort scores, which may explain why the amount of variance at the operational district level was relatively small. Although knowledge was positively associated with effort, a substantial fraction of variance in effort score was still captured by the provider random effect even after we accounted for provider knowledge in the regressions.
Our findings of poor provider knowledge and effort at public health centers are consistent with those documented in LMICs.Citation11,Citation39 In particular, we observed a know-do gap, suggesting that providers failed to adhere to clinical guidelines despite (partially) knowing what to do. However, because the knowledge scores were also low, improving provider effort to close the know-do gap would only generate modest quality improvement, as highlighted in our policy simulation. In addition, our simulation suggested that improving provider knowledge alone would not increase the quality to a satisfactory level for postnatal care and well-child visits because of the dual issues of insufficient knowledge and the know-do gap. The very low baseline performance that we observed would require a considerable change to both provider knowledge and their practice of care.
Moreover, our analysis suggested that providers were inconsistent in the quality of care they delivered across patients. A recent study on the quality of care during labor and delivery in India, Kenya and Malawi found that health facilities contributed to a greater share of the observed variation in quality of care provided during labor and delivery, as compared with individual nurses within those facilities.Citation40 In contrast, we found that individual providers played a relatively more important role in contributing to the variation in quality of care than health centers. It is possible that in situations where care is delivered by teams of providers (which is often the case for labor and delivery), more variation in service quality is at the facility level as norms, peer effects, and productivity spillover may help to reduce variation in practice across providers within a facility. But in cases where care is delivered by a single provider, such as the three services we examined here, individual providers’ own decision-making might have a greater influence on quality.
Our study highlighted the considerable challenge facing Cambodia to improve quality of care at public health centers. In this context, improving provider adherence to guidelines likely requires multidimensional interventions with a particular focus on individual provider behavior and decision making. Since we observed that knowledge was a key constraint especially in postnatal and well-child care, training is an important first step and research suggests that training programs with features such as supervision (e.g., routine supervision, benchmarking, audit and feedback) and group problem solving have the potential to achieve meaningful improvement in provider performance.Citation41 Pre-service training could be important as well, as recent graduates can exhibit substantial gaps in their clinical performance,Citation42 but our data did not allow us to differentiate recent graduates from experienced clinicians. Nonetheless, due to the know-do gap and wide variation in provider practice, increasing knowledge alone is likely insufficient.
Another—possibly concurrent—approach to improving quality could be to strengthen the model of Special Operating Agencies and expand it to more operational districts. The SOA model combines incentives and administrative accountability through performance-based internal contracting and performance monitoring. Within each SOA, health facilities selected for internal contracting have a part of their payments being tied to performance; within facilities, performance-based contracts are established between the head of facility and individual staff members.Citation20,Citation24 The SOA model also intends to give health facilities more managerial authority and flexibility in enforcing performance contracts. Although we cannot establish a causal relationship, our finding that SOA designation was associated with higher provider knowledge and, in some cases, with better provider effort suggests that the SOA mechanism may partly work by selecting and retaining more qualified and higher-performing providers. However, a recent qualitative study found that SOA managers faced capacity and funding constraints in monitoring the performance of SOA and there were concerns over the reliability of the performance monitoring data.Citation21 Moreover, the afforded flexibility and insufficient incentives may have contributed to more dual practice among staff,Citation21 which could have contributed to the variation in provider performance that we observed in this study.
Finally, Cambodia has been piloting and evaluating a new PBF program that rewards provider competence as measured by a quality checklist.Citation24 Unlike the SOA model, this new PBF program will be implemented in all operational districts regardless of their SOA status. Alongside this new PBF program, the government has instituted periodic electronic data collection from health facilities, as part of the National Quality Enhancement Monitoring Program (NQEMP) that commenced in mid-2019. The current evidence on the effectiveness—and cost-effectiveness—of financial incentives to improve quality of care and health outcomes remains mixed,Citation43 and an evaluation of earlier PBF initiatives in Cambodia (prior to the SOA model and the more recent PBF program implemented since 2016) shows that PBF shifted institutional births from private to public facilities but did not measurably improve neonatal mortality or child vaccination rates.Citation19 Yet the lack of conclusive evidence on PBF may in part due to the wide variation in how these programs are designed and implemented.Citation44 The explicit focus of Cambodia’s recent PBF program on provider knowledge and effort is somewhat unusual and may generate better results, compared to programs that target structural quality (e.g., supplies and equipment) and/or the quantity of services. The implementation of NQEMP will also lay the critical foundation for more rigorous future evaluations of health care quality and provider performance.
Our analysis has several limitations. First, our data were cross-sectional and only captured a snapshot of provider clinical knowledge and process quality, but to our knowledge there was no other data collection of this nature undertaken after 2015. Second, our data did not contain any provider or patient characteristics and only a limited set of health center characteristics. The knowledge scores presumably captured critical aspects of provider qualification and experience, but our analysis cannot fully account for the difference in effort scores due to, e.g., differences in provider characteristics not reflected in the vignettes and in the patient case mix. To minimize the impact of unobserved provider qualifications and patient case mix, we focused on normal ANC, PNC, and WCH visits, which have clear, standardized guidelines and are usually delivered by the same type of providers per the Minimum Package of Activities, i.e., secondary or primary midwife licensed by MOH for antenatal and postnatal care.Citation18 While we did not observe health center infrastructure and staffing, health centers were designed to be somewhat homogeneous across these dimensions.Citation18 Our health center-level covariates, such as SOA and HEF status, were related to incentive contracts and reimbursement arrangements, which may be more predictive of performance. Lastly, direct observation data are potentially sensitive to Hawthorne effects, which could result in higher observed performance relative to usual performance when observers are not present.Citation45
Conclusion
After decades of effort to rebuild and strengthen the country’s public health care system and expand financial coverage for health services, Cambodia has achieved considerable progress in increasing coverage of care by trained professionals and in improving population health. As highlighted by our findings, however, more attention needs to be directed toward improving process quality by enhancing public sector provider knowledge and effort. Traditional approaches focusing on provider training, while essential, are insufficient when providers fail to do what they know is the best practice or perform inconsistently from patient to patient in domains of care with well-established guidelines. Narrowing this know-do gap will likely require a multidimensional approach combining incentives, routine performance monitoring and feedback, and strategies leveraging norms and peer effects to increase provider effort. Research on providers’ decision-making process could shed light on additional behavioral drivers of poor adherence to clinical guidelines and inform policy design.
Contributions statement
DH and SB conceived of the research question and methodology. SN and SB supported the data acquisition and oversaw the work. DH conducted analyses and drafted the manuscript. SN and SB reviewed several versions of the manuscript and approved the final manuscript.
Ethical approval
The protocol for this study was approved by the Harvard University Institutional Review Board (IRB21–1533) and the National University of Singapore Institutional Review Board (NUS-IRB-2021-976). The analysis of the L2 assessment data for this work was undertaken in consultation with the Cambodian Ministry of Health.
Acknowledgements
We would like to thank the World Bank team for Health, Nutrition and Population based in Phnom Penh, Cambodia, as well as colleagues at the Cambodian Ministry of Health and University Research Co, LLC in Phnom Penh. This work was supported by the World Bank. The views expressed in the article do not necessarily reflect the views of the World Bank, the Executive Directors of the World Bank or the governments they represent.
Disclosure statement
No potential conflict of interest was reported by the author(s).
Data availability statement
The data underlying the results presented in the study are held by the Cambodian Ministry of Health. Interested researchers may contact the Ministry to obtain more information regarding data availability at www.moh.gov.kh or physically at No: 80, Samdach Penn Nouth Blvd (289), Sankat Beoungkak 2, Tuol Kork District, Phnom Penh, Cambodia.
Correction Statement
This article has been corrected with minor changes. These changes do not impact the academic content of the article.
Additional information
Funding
References
- Shekh Mohamed I, Hepburn JS, Ekman B, Sundewall J. Inclusion of essential universal health coverage services in essential packages of health services: a review of 45 low- and lower- middle income countries. Health Syst Reform. 2022;8:e2006587. doi:10.1080/23288604.2021.2006587.
- Das J, Woskie L, Rajbhandari R, Abbasi K, Jha A. Rethinking assumptions about delivery of healthcare: implications for universal health coverage. Bmj. 2018;361:k1716. doi:10.1136/bmj.k1716.
- Rohde J, Cousens S, Chopra M, Tangcharoensathien V, Black R, Bhutta ZA, Lawn JE. 30 years after Alma-Ata: has primary health care worked in countries? Lancet. 2008;372:950–23. doi:10.1016/S0140-6736(08)61405-1.
- Countdown to 2030. Maternal and newborn health in low- and middle-income countries: a brief assessment of mortality, coverage and policies. In: Prepared for the AlignMNH Opening Forum. 2021 [accessed 2022 Jul 2]. https://www.countdown2030.org/wp-content/uploads/2021/04/Report-AlignMNH-Final.pdf.
- Goldenberg RL, McClure EM, Saleem S. Improving pregnancy outcomes in low- and middle-income countries. Reprod Health. 2018;15:88. doi:10.1186/s12978-018-0524-5.
- Chou D, Daelmans B, Jolivet RR, Kinney M, Say L. Ending preventable maternal and newborn mortality and stillbirths. Bmj. 2015;351:h4255. doi:10.1136/bmj.h4255.
- Chou VB, Walker N, Kanyangarara M. Estimating the global impact of poor quality of care on maternal and neonatal outcomes in 81 low- and middle-income countries: a modeling study. Plos Med. 2019;16:e1002990. doi:10.1371/journal.pmed.1002990.
- Kieny M-P, Evans TG, Scarpetta S, Kelley ET, Klazinga N, Forde I, Veillard JHM, Leatherman S, Syed S, Kim SM, et al. Delivering quality health services: a global imperative for universal health coverage. The World Bank; 2018 [accessed 2020 May 6]. http://documents.worldbank.org/curated/en/482771530290792652/Delivering-quality-health-services-a-global-imperative-for-universal-health-coverage.
- Rowe AK, Labadie G, Jackson D, Vivas-Torrealba C, Simon J. Improving health worker performance: an ongoing challenge for meeting the sustainable development goals. Bmj. 2018;362:k2813. doi:10.1136/bmj.k2813.
- Kruk ME, Leslie HH, Verguet S, Mbaruku GM, Adanu RMK, Langer A. Quality of basic maternal care functions in health facilities of five African countries: an analysis of national health system surveys. Lancet Glob Health. 2016;4:e845–55. doi:10.1016/S2214-109X(16)30180-2.
- Giorgio LD, Evans DK, Lindelow M, Nguyen SN, Svensson J, Wane W, Tärneberg AW. Analysis of clinical knowledge, absenteeism and availability of resources for maternal and child health: a cross-sectional quality of care study in 10 African countries. BMJ Glob Health. 2020;5:e003377. doi:10.1136/bmjgh-2020-003377.
- Mohanan M, Vera-Hernández M, Das V, Giardili S, Goldhaber-Fiebert JD, Rabin TL, Raj SS, Schwartz JI, Seth A. The know-do gap in quality of health care for childhood diarrhea and pneumonia in rural India. JAMA Pediatr. 2015;169:349–57. doi:10.1001/jamapediatrics.2014.3445.
- Rokicki S, Mwesigwa B, Cohen JL. Know-Do gaps in obstetric and newborn care quality in Uganda: a cross-sectional study in rural health facilities. Trop Med Int Health TM IH. 2021;26:535–45. doi:10.1111/tmi.13557.
- Gage AD, Kruk ME, Girma T, Lemango ET. The know-do gap in sick child care in Ethiopia. Plos One. 2018;13:e0208898. doi:10.1371/journal.pone.0208898.
- Leonard KL, Masatu MC. Using the Hawthorne effect to examine the gap between a doctor’s best possible practice and actual performance. J Dev Econ. 2010;93:226–34. doi:10.1016/j.jdeveco.2009.11.001.
- World Health Organization Regional Office for the Western Pacific. The Kingdom of Cambodia health system review. 2015.
- Department of Planning and Health Information, Ministry of Health. Third Health Strategic Plan 2016-2020. Cambodia: Department of Planning and Health Information, Ministry of Health; 2016.
- Ministry of Health, Kingdom of Cambodia. Guidelines on Minimum Package of Activities For Health Center Development 2008-2015. 2007; published online Dec 31.
- Van de Poel E, Flores G, Ir P, O’Donnell O. Impact of performance-based financing in a low-resource setting: a decade of experience in Cambodia. Health Econ. 2016;25:688–705. doi:10.1002/hec.3219.
- Khim K, Annear PL. Strengthening district health service management and delivery through internal contracting: lessons from pilot projects in Cambodia. Soc Sci Med. 2013;96:241–49. doi:10.1016/j.socscimed.2013.02.029.
- Vong S, Raven J, Newlands D. Internal contracting of health services in Cambodia: drivers for change and lessons learned after a decade of external contracting. BMC Health Serv Res. 2018;18. doi:10.1186/s12913-018-3165-z.
- Ensor T, Chhun C, Kimsun T, McPake B, Edoka I. Impact of health financing policies in Cambodia: a 20 year experience. Soc Sci Med. 2017;1982(177):118–26. doi:10.1016/j.socscimed.2017.01.034.
- Bigdeli M, Annear PL. Barriers to access and the purchasing function of health equity funds: lessons from Cambodia. Bull World Health Organ. 2009;87:560–64. doi:10.2471/BLT.08.053058.
- Nagpal S, Bauhoff S, Song K, Jithitikulchai T, Vong S, Kohli M. Impact evaluation of service delivery grants to improve quality of health care delivery in Cambodia: baseline study report. Washington (DC): World Bank Group; 2019. https://documents1.worldbank.org/curated/en/841771557222188507/pdf/Impact-Evaluation-of-Service-Delivery-Grants-to-Improve-Quality-of-Health-Care-Delivery-in-Cambodia-Baseline-Study-Report.pdf.
- Annear PL, Khim K, Ir P, Moscoe E, Jordanwood T, Bossert T, Nachtnebel M, Barnighausen T, Lo V. National coverage and health service utilization by health equity fund members, 2004-2015. 2016. https://mspgh.unimelb.edu.au/__data/assets/pdf_file/0006/2074965/Annear-ADRA-Research-Report.pdf.
- Jacobs B, Bajracharya A, Saha J, Chhea C, Bellows B, Flessa S, Fernandes Antunes A. Making free public healthcare attractive: optimizing health equity funds in Cambodia. Int J Equity Health. 2018;17:88. doi:10.1186/s12939-018-0803-3.
- National Institute of Statistics/Cambodia, Directorate General for Health/Cambodia, ORC Macro. Cambodia Demographic and Health Survey 2000. 2001; published online June 1 [accessed 2020 May 6]. https://dhsprogram.com/publications/publication-fr124-dhs-final-reports.cfm.
- National Institute of Statistics/Cambodia. Directorate General for Health/Cambodia, ICF international. Cambodia Demographic and Health Survey 2015; 2014. http://dhsprogram.com/pubs/pdf/FR312/FR312.pdf.
- World Bank. Cambodia | data. [accessed 2020 May 6]. https://data.worldbank.org/country/cambodia.
- Donabedian A. The quality of care. How can it be assessed? Jama. 1988;260:1743–48. doi:10.1001/jama.1988.03410120089033.
- Chhorvann C, Por I, Darapheak C, Sovatha M, Of Health M. The technical working group for level 2 quality of care assessment. Level 2 Quality of Care Assessment in 2015 Among Public Health Facilities in 15 Provinces and Phnom Penh Municipality. 2016.
- Results and feedback from level 2 assessment process. University Research Co; 2015.
- Ministry of planning, Cambodia. general population census of Cambodia 2019: national report on final census results. 2020.
- Cambodian population and poverty rate 2015 | open development Cambodia. [accessed 2022 Feb 15]. https://data.opendevelopmentcambodia.net/dataset/cambodian-population-and-poverty-rate-2015.
- Das J, Hammer J, Leonard K. The quality of medical advice in low-income countries. J Econ Perspect. 2008;22:93–114. doi:10.1257/jep.22.2.93.
- Nakagawa S, Schielzeth H. A general and simple method for obtaining R2 from generalized linear mixed‐effects models - Nakagawa - 2013 - methods in ecology and evolution - Wiley online library. Methods Ecol Evol. 2013;4:133–42. doi:10.1111/j.2041-210x.2012.00261.x.
- Theall KP, Scribner R, Broyles S, et al. 2011. Impact of small group size on neighborhood influences in multilevel models. J Epidemiol Community Health. 65:688–95. doi:10.1136/jech.2009.097956.
- Bell BA, Morgan GB, Kromrey JD, Ferron JM The impact of small cluster size on multilevel models: a monte carlo examination of two-level models with binary and continuous predictors. In: Section on Survey Research Methods – JSM 2010. 2010. http://ww2.amstat.org/sections/SRMS/Proceedings/y2010/Files/308112_60089.pdf.
- Kruk ME, Chukwuma A, Mbaruku G, Leslie HH. Variation in quality of primary-care services in Kenya, Malawi, Namibia, Rwanda, Senegal, Uganda and the United Republic of Tanzania. Bull World Health Organ. 2017;95:408–18. doi:10.2471/BLT.16.175869.
- Helfinstein S, Jain M, Ramesh BM, Blanchard J, Kemp H, Gothalwal V, Namasivayam V, Kumar P, Sgaier SK. Facilities are substantially more influential than care providers in the quality of delivery care received: a variance decomposition and clustering analysis in Kenya, Malawi and India. BMJ Glob Health. 2020;5:e002437. doi:10.1136/bmjgh-2020-002437.
- Rowe AK, Rowe SY, Peters DH, Holloway KA, Chalker J, Ross-Degnan D. Effectiveness of strategies to improve health-care provider practices in low-income and middle-income countries: a systematic review. Lancet Glob Health. 2018;6:e1163–75. doi:10.1016/S2214-109X(18)30398-X.
- Lewis TP, Roder-DeWan S, Malata A, Ndiaye Y, Kruk ME. Clinical performance among recent graduates in nine low‐ and middle‐income countries. Trop Med Int Health. 2019;24:620–35. doi:10.1111/tmi.13224.
- Diaconu K, Falconer J, Verbel A, Fretheim A, Witter S. Paying for performance to improve the delivery of health interventions in low- and middle-income countries. Cochrane Database Syst Rev. 2021;5: CD007899. doi:10.1002/14651858.CD007899.pub3.
- Gergen J, Josephson E, Coe M, Ski S, Madhavan S, Bauhoff S. Quality of care in performance-based financing: how it is incorporated in 32 programs across 28 countries. Glob Health Sci Pract. 2017;5:90–107. doi:10.9745/GHSP-D-16-00239.
- Leonard K, Masatu MC. Outpatient process quality evaluation and the Hawthorne effect. Soc Sci Med. 2006;1982(63):2330–40. doi:10.1016/j.socscimed.2006.06.003.
Appendix A
Table A1. Population characteristics per the 2014 Cambodia demographic and health surveys.
Table A2. Checklist items included in the antenatal care (ANC) vignette and direction observation data collection tools.
Table A3. Checklist items included in the postnatal care (PNC) vignette and direction observation data collection tools.
Table A4. Checklist items included in the well-child visit (WCH) vignette and direction observation data collection tools.
Figure A1. Distributions of knowledge scores and effort scores: antenatal care (ANC).
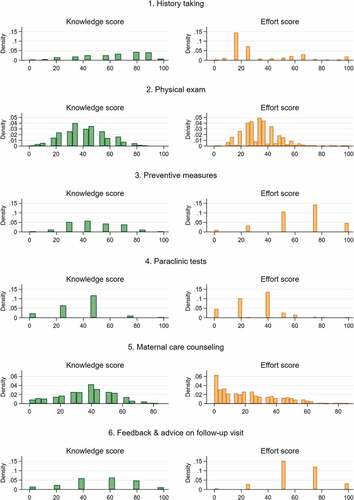
Figure A2. Distributions of knowledge scores and effort scores: postnatal care (PNC).
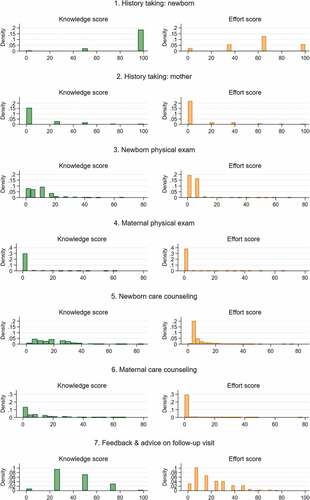
Figure A3. Distributions of knowledge scores and effort scores: well-child visit (Wch).
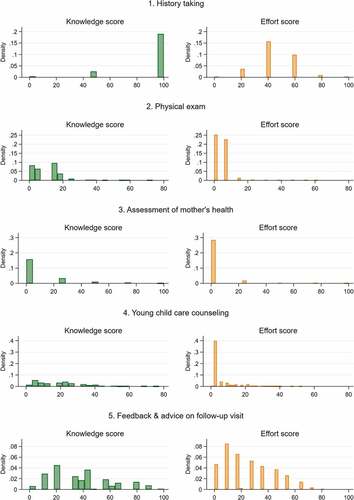
Figure A4. Policy simulation results: antenatal care (ANC).
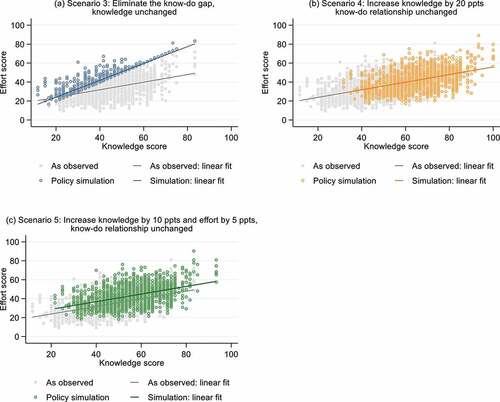
Figure A5. Policy simulation results: postnatal care (PNC).
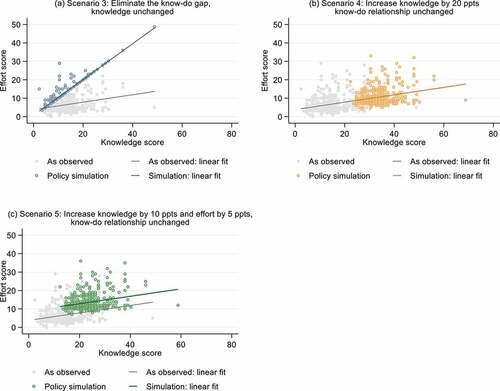
Figure A6. P, Massachusetts