
Abstract
Monitoring maternal mortality is challenging due to fragmented data of varying quality. The maternal mortality estimates published by the WHO in Citation2012 included data adjustment parameters to account for these data quality issues, but there was a discrepancy between the WHO assumption about, and the observed variability in, misclassification errors in vital registration (VR) observations. We developed a Bayesian hierarchical time series model to estimate the extent of VR misclassification errors and to provide a plausible assessment of the uncertainty associated with VR observations for countries with and without external information on VR adjustment parameters. The resulting Bayesian distribution for VR adjustments was more comparable to the observed biases than the WHO expert distribution and the model allows for estimation of VR adjustment values for any period of interest for countries with partial information on such adjustments. We also illustrated that a fully Bayesian modeling approach for estimating maternal mortality can provide more data-driven insights into maternal mortality estimates and data adjustment parameters. However, given the paucity of, and the issues with, maternal mortality data, validation of modeling assumptions and findings is challenging; more data collection and research on measuring maternal mortality and assessing data quality issues are needed.
INTRODUCTION
Maternal mortality is widely considered as a sentinel indicator of the quality of a health care delivery system and as a key indicator of population health and social and economic development (Wilmoth et al. Citation2012). Millennium Development Goal 5 (MDG 5) calls for a reduction in the maternal mortality ratio by three quarters between 1990 and 2015. To measure progress, the World Health Organization (WHO), the United Nations Children’s Fund (UNICEF), the United Nations Population Fund (UNFPA), and the World Bank published estimates of maternal mortality in 2012, referred to hereafter as the WHO estimates (WHO et al. Citation2012).
It is challenging to estimate maternal mortality due to the paucity of accurate data, especially in developing countries where maternal mortality is high and such estimates are most needed. The WHO estimates were based on limited data on the proportion of maternal deaths among all deaths of women of reproductive age, adjusted to account for data issues such as under-reporting, misclassification, and inconsistent definitions. The adjustments and the uncertainty associated with the adjustment were based on external data and/or expert opinion.
In this article, we assess the accuracy of the estimates and probability distributions used for the vital registration (VR) misclassification parameters used in the WHO modeling approach. We identify two issues: (1) it is not clear how information on varying periods for countries with information should be summarized into the periods needed for the maternal mortality estimation, and (2) for countries without additional information on the extent of misclassification of maternal deaths in the VR, the WHO expert distribution may understate uncertainty therein. To improve upon the current WHO modeling approach, we develop a Bayesian estimation approach for the VR misclassification adjustments for countries with or without additional information on the quality of the VR data. The resulting probability distribution for VR adjustments is compared to those from the WHO and to adjustments published by Naghavi et al. (Citation2010), used by the Institute for Health Metrics and Evaluation for constructing global estimates of maternal mortality (Lozano et al. Citation2013). We also incorporate the Bayesian VR adjustment into the current WHO estimation approach and implement a fully Bayesian maternal mortality estimation model to examine the effect of the differences in VR adjustment parameters on the maternal mortality estimates for selected countries.
The article is organized as follows. We first briefly summarize the WHO estimation method and introduce our alternative estimation approach in Section 2. We then present results in Section 3 and end with a discussion of findings.
2. METHODS
2.1 Summary of WHO Estimation Method
The WHO maternal mortality estimation methods used here are described in detail elsewhere (Wilmoth et al. Citation2012; WHO et al. Citation2012). We summarize the method here.
The key indicator in the WHO estimation approach is the proportion of maternal deaths (PM) among all deaths of women of reproductive ages. Estimation of PM is complicated in countries with HIV/AIDS epidemics because of the difficulties in determining whether a death of a woman who was HIV-positive and died during the maternal risk period should be counted as a maternal death. In the WHO method, the “total” PM is estimated as PM = (1 − a)PMna + aPMa, where a refers to the proportion of AIDS deaths among all deaths to women of reproductive ages. PMna is the non-AIDS PM (the proportion of non-AIDS maternal deaths among the total number of non-AIDS deaths of women of reproductive ages), and PMa is the AIDS PM (the proportion of AIDS maternal deaths among the total number of AIDS deaths to women of reproductive ages). This article focuses on the estimation of PMna, whereas PMa and a are estimated from other sources and not the subject of this article.
Let zi denote the observed total PM for observation i. Data are available from VR systems and other sources such as household surveys (described in detail in the 2012 WHO report; WHO et al. Citation2012). The WHO analysis started by carrying out an adjustment procedure resulting in an adjusted PM, denoted by yi, which represents the proportion of non-AIDS maternal deaths among all deaths of women of reproductive ages, given by
(1) where si refers to an adjustment related to AIDS deaths and qi refers to an adjustment for observations that reported pregnancy-related deaths (as opposed to maternal deaths). Parameter γi is an under-reporting or misclassification parameter and is determined by the data source of observation i. For VR observations, γi quantifies the extent to which maternal deaths have been misclassified. For example, if the observed proportion of maternal deaths among all deaths to women of reproductive ages is underestimated by 50%, γi = 1.5. Adjustment parameters were informed by external studies.
In the WHO approach, for countries with sufficient information from VR systems from 1990 to 2012, PMna estimates were based on adjusted PM data. For the countries without sufficient VR information, estimates were obtained from a multilevel model which was fitted to the adjusted data from all countries combined. The multilevel model was given by
(2) where log (1 − ai) is an offset to remove the AIDS deaths from the denominator of the adjusted PM, x1, x2, and x3 are predictors for the PM (referring to the log of the general fertility rate, the log of GDP per capita and the proportion of births with a skilled birth attendant), and αCc[i] and αRr[i] refer to the country and region-specific intercepts, respectively. The uncertainty assessment of the resulting non-AIDS PM estimates was based on repeated draws from probability distributions on the adjustment parameters and repeated fitting of the multilevel model to the resulting sets of adjusted PM values.
The probability distribution for the VR adjustment parameters is given by
(3) where the mean value Vi is a country-specific value for a subset of countries where country-specific studies were available, while for the remaining 63 countries with VR data but without external information on the VR adjustment, Vi = 1.5, based on the median of reported VR adjustments. The standard deviation in Equation (Equation3
(3) ) was based on expert opinion.
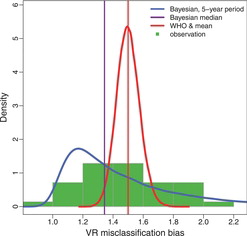
illustrates the distribution of 35 reported VR misclassification errors, or in other words, reported VR adjustment parameters, obtained from various studies in 19 countries. The dataset, based on Appendix 1 from the WHO 2012 report and additional information provided by WHO analysts, is given in . The observed adjustments range from 0.95 (from New Zealand with observation period 2006–2008) to 2.03 (from Australia with observation period 2003–2006). The VR adjustment data are from 19 countries and 9.7 country-years of data are available for each country on average. illustrates the observed VR adjustments for all 19 countries.
2.1.1 Limitations of the Current WHO Adjustment Method
Country-specific observation periods for VR adjustments vary and generally do not coincide with the observation periods that are used to calculate the observed PM in the WHO multilevel model (which are generally five-year periods). Additionally, the adjustments are often not available for the entire VR observation period. As a consequence, the WHO VR adjustments for countries with external information (the Vi's in Equation (Equation3(3) )) are often based on partial information. The procedure to impute adjustments for missing observation years has not been formalized.
The WHO expert distribution for countries without external information on VR adjustment parameters (Equation (Equation3(3) ) with Vi = 1.5) is added to . A comparison of observed adjustments and the WHO expert distribution reveals that the expert distribution understates the variability of observed adjustment factors: if this expert distribution were used for countries where information is available, the variability in adjustments would be underestimated.
2.2 A Bayesian Model for VR Misclassification Parameters
To overcome the limitations of the current WHO adjustment procedure, we developed an alternative model for VR misclassification parameters that provides annual estimates of the VR adjustment parameter for all countries, based on the available data on such adjustments, to (1) impute VR adjustments for countries with external information for a subset of observation years, and (2) provide a more plausible representation of the extent of VR misclassification bias for countries without external information.
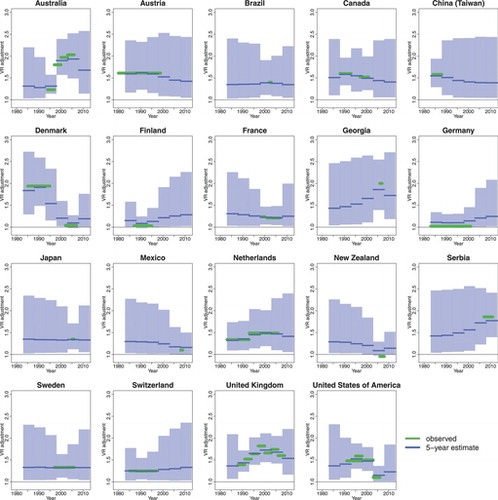
A Bayesian hierarchical time series model is used to model the underlying true (but most often unknown) VR misclassification parameters. This type of model setup was motivated by the need (1) to deal with observation periods of varying lengths, (2) to allow for variation in misclassification errors between countries and within countries over time (e.g., the observations in suggest that the average adjustment in the United Kingdom may be higher than in Finland or Germany, and that the adjustment has changed over time in several countries), (3) to minimize the number of model parameters given the limited number of observed misclassification outcomes. Technical details of the model specification are discussed in the remainder of this section.
Let Pc, t be the proportion of maternal deaths that are correctly reported as maternal deaths in country during year t, that is,
, where Rc, t is the reported number of maternal deaths for the country-year, while Mc, t is the true number of maternal deaths. The Pc, t’s were modeled with an autoregressive time series model of order one (AR(1)) with truncation:
where TN[A, B](a, b2) denotes a truncated normal distribution with mean a and variance b2, truncated to lie between A and B, such that the proportion of correctly reported deaths is assumed to be at least 1/3. The global time series parameters are given by the autoregressive parameter 0 ⩽ ρ < 1 and variance σ2AR with priors ρ ∼ U(0, 1) and σAR ∼ U(0, 0.5).
The proportion of correctly reported maternal deaths fluctuates around the country-specific mean parameter pc. This parameter is assumed to be drawn from a common truncated normal distribution,
where w refers to the global mean, and σ2p to the variance, with priors
The truncation on the country-level under-reporting means pc’s and their global mean w are based on the prior assumption that the average proportion of maternal deaths that are correctly reported in a given year is between 1/2 and 1. Similarly, the upper bound for the prior on σp is given by the standard deviation of a U(1/2, 1) distribution, based on the assumption that the country-specific pc’s are at most as spread out as this distribution.
The model has only four “global” parameters (the autoregressive parameters and the hierarchical mean and variance of the country means) but allows for differences within countries over time through the time series setup and for differences between countries through the hierarchical model for mean reporting levels.
2.2.1 Inference
The AR(1) model parameters were estimated using the 35 observed VR adjustments for various country-periods from . Let Wc[i], k[i] = Vi, the observed VR adjustment for country c[i] and period (tc[i], k[i], tc[i], k[i] + Tc[i], k[i] − 1), where Tc, k refers to the number of observation years for the kth observation in country c. The observed VR adjustment relates to the true number of maternal and reported maternal deaths as follows:
where M*c, t and R*c, t denote reporting errors, which are assumed to be small as compared to Mc, t and Rc, t (i.e., the errors represent an increase or decrease in the number of (reported) maternal deaths because of misreporting of the calendar year of death). If the number of maternal deaths does not vary greatly during a VR observation period,
.
Without additional information on the extent of the difference between and
, we assumed
(4) where σW ∼ U(0, 0.05), that is, we assume that the standard deviation of the differences is at most 5%.
The effect of the VR adjustment modeling procedure on the WHO maternal mortality estimates from the multilevel model was assessed by replacing the WHO point estimates for the adjustment parameters by the posterior medians from the Bayesian VR adjustment model (obtained via Equation (Equation4(4) ) for the relevant country-periods), and similarly, by replacing the draws of the adjustment parameters from the WHO probability distributions by the posterior samples from the Bayesian VR adjustment model when carrying out the uncertainty assessment.
2.2.2 Validation
Validation of the proposed model is challenging because of the paucity of data on VR adjustments. We compared the resulting posterior distribution for five-year adjustments to the prior distribution to check whether unexpected findings were driven by the prior assumptions and model structure or informed by the data.
We also compared the observed adjustments for the countries with external information to the adjustments that would have been obtained if the Bayesian and WHO approaches for countries without external information would have been used.
2.3 A Bayesian Estimation Model for Maternal Mortality
In the previous section, we proposed a Bayesian model for the VR adjustment parameters, that was fitted to observed VR adjustments and used to replace the current WHO point estimates and probability distributions to assess the effect of the VR adjustment model on the maternal mortality estimates.
Instead of “plugging in” the Bayesian estimates of the VR adjustments into the WHO maternal mortality model, alternatively, VR adjustments and maternal mortality can be estimated simultaneously. Such a combined Bayesian estimation model could provide more accurate estimates and uncertainty assessments of both VR adjustments as well as maternal mortality because all relevant information is taken into account simultaneously. For example, suppose that in a country without external information on the extent of misclassification in the VR, the VR data as adjusted by the “default” Bayesian point estimates (the estimates that would result from the model as discussed in the previous section) are far below adjusted data from alternative sources and/or the expected level based on the region and the country’s predictors for PM. Such findings indicate that the extent of under-reporting in the VR may be greater than the default adjustment. When estimating the VR adjustment and PM simultaneously, the posterior distribution of the VR adjustment parameters would reflect this possibility, and higher PM point estimates and associated uncertainty bounds may be obtained.
To illustrate this approach and incorporate the estimation of adjustment parameters in the PM estimation procedure, we fitted a Bayesian model that combined the WHO multilevel model from Section 2.1 with the Bayesian VR adjustment model from Section 2.2. We focused our PM analysis on countries for which the maximum proportion of AIDS deaths among all deaths of women aged 15–49 in the population is smaller than 0.05 (102 countries, here referred to as the non-AIDS countries) and did not carry out any AIDS-related adjustments in the estimation procedure. The main reason for focusing on the non-AIDS countries was to avoid the difficulties associated with the AIDS adjustments and to discuss only one type of adjustment. Leaving out si from Equation (Equation1(1) ), the data model for observed PM for the non-AIDS countries is simplified as yi = zi · γi · qi such that
where ηi = φi − log (γi) − log (qi), and φi is given by Equation (Equation2
(2) ) where ai = 0.
Prior distributions for the multilevel model parameters were chosen to be spread out, with the exception of the non-VR adjustment parameters that determine γi and qi for non-VR observations. For these parameters, priors were based on the WHO expert distributions. More details and the full model are provided in the Appendix in Section 4. The results from the Bayesian model were compared to the results from a modified WHO model. The modified WHO model is based on the original WHO model, but modified to leave out all AIDS adjustments (as explained for the Bayesian model) and fitted to non-AIDS countries only, such that its results were directly comparable to the results from the Bayesian model. Given that the models were fit to non-AIDS countries only, the results are for illustrative purposes only (to illustrate the insights that can be obtained from this approach w.r.t. VR adjustments).
2.4 Computation
A Markov chain Monte Carlo (MCMC) algorithm was used to obtain samples from the posterior distributions of the model parameters for the VR adjustment model in Section 2.2 and for the fully Bayesian maternal mortality estimation model in Section 2.3.
In the VR adjustment model and in the Bayesian maternal mortality estimation model, 75,000 iterations were used for each of the three MCMC chains. We thinned for every 10 iterations and discarded the first 20,000 iterations. Convergence was checked through visual inspection of trace plots and convergence diagnostics of Gelman and Rubin (Citation1992).
Models were implemented in R 2.15 (R Development Core Team Citation2011) and JAGS 3.3.0 (Plummer Citation2003). The WHO model used R package lme4 (Bates and Maechler Citation2011) and the Bayesian model used packages rjags (Plummer Citation2011) and coda (Plummer et al. Citation2006).
Table 1. Prior distributions and posterior estimates for the Bayesian VR adjustment model
3. RESULTS
3.1 Bayesian VR Adjustment Estimates
The results in this section are based on the Bayesian VR adjustment model from Section 2.2. Prior and posteriors for selected model parameters are shown in and summarizes the posterior medians and 95% credible intervals (CIs) for the five model parameters in the AR(1) model. The posterior distribution of w, the global mean of the pc’s (the country-specific mean parameters for the proportion of accurately reported maternal deaths), suggests that values below 0.6 are unlikely (the posterior probability that w < 0.6 is 1.5%). The posterior and prior for σp (the standard deviation of the pc’s) are very similar, suggesting that there is little information in the data to estimate this parameter. The posterior for time series parameter ρ indicates high autocorrelation in the time series. The posterior distribution of σW suggests that the standard deviation is close to its upper bound of 5%.
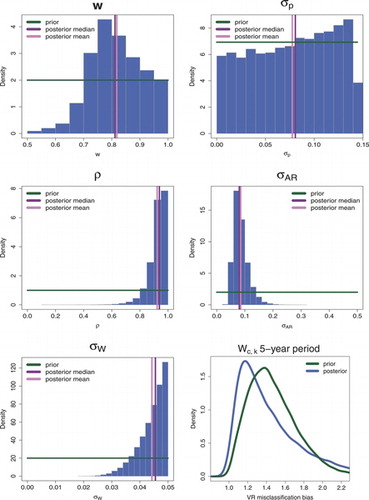
The bottom-right graph of shows the prior (induced by the hierarchical time series model and the prior on the time series model parameters) and posterior distribution for VR adjustment Wc, k for a country without external information, for an observation period of five years. The posterior VR adjustment is also added to . While the Bayesian posterior distribution is more weighted toward lower levels of under-reporting than the observed distribution of VR adjustments suggests (see ), its posterior median is smaller than the prior median (1.34 as compared to 1.43), suggesting that the estimated lower levels of under-reporting are data-driven as opposed to driven by prior model settings. The mismatch between the posterior distribution for the VR adjustment and the observations is explained by the fact that the posterior distribution is not directly comparable to the observed distribution because the observed distribution includes observations for time periods of various durations and some countries contributed multiple observations. In comparison to the WHO expert distribution, the Bayesian median of 1.34 is lower than the WHO point estimate of 1.50. The Bayesian distribution suggests that there is considerable uncertainty in VR adjustment parameters; the 95% credible interval (CI) for the VR adjustment value is given by (1.03, 2.40), as compared to (1.36, 1.65) for the WHO distribution.
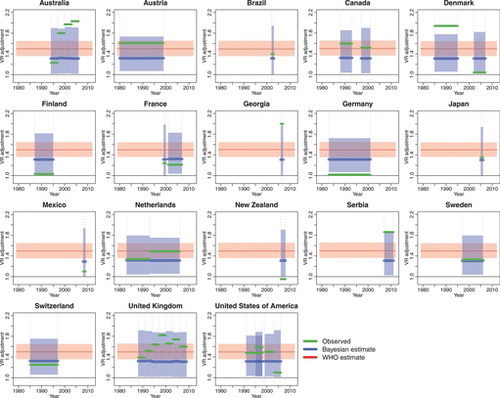
shows the observed VR adjustments and five-year estimates for countries with external information on the VR adjustment. The five-year estimates refer to Wc, k from Equation (Equation4(4) ), obtained from the country-specific proportions Pc, t for the standard 5-year periods that are used in the WHO estimation approach. For the majority of countries with partial information, the VR adjustment remains quite uncertain for many country-periods. compares the observed adjustments for the same set of countries (with external VR adjustment information) to the adjustments that would have been obtained if the Bayesian and WHO approaches for countries without external information would have been used. While the observed adjustments are inside the WHO uncertainty bounds only for approximately one out of three observation periods (35% of the observations), the Bayesian uncertainty bounds contain the observed values for approximately four out five observation periods (79%).
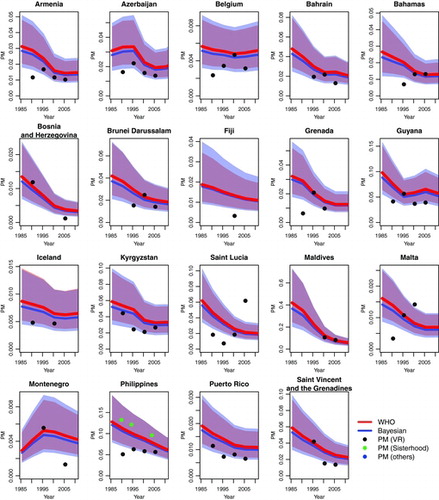
Two sets of maternal mortality estimates are shown in for the countries with VR data, where the multilevel model was used to construct the WHO PM estimates. The estimates were obtained from the original WHO modeling approach, and from the WHO approach with VR adjustments imputed from the Bayesian VR adjustment model. Differences between the WHO and (partially) Bayesian estimates are small, but as expected, the Bayesian estimates are slightly lower and their uncertainty bounds are slightly wider than those from the WHO model.
3.1.1 Comparison to Alternative Estimates
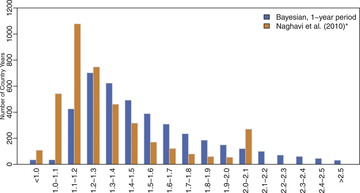
Alternative global estimates of maternal mortality were published in 2011 (Lozano et al. Citation2011) and in 2012 (Lozano et al. Citation2013). In these studies, VR misclassification errors were obtained through a cause-of-death reclassification algorithm (Naghavi et al. Citation2010). The adjustment factors for maternal mortality that were displayed in in Naghavi et al. (Citation2010) are illustrated in . The corresponding Bayesian estimates (Wc, k) for a one-year period are added for comparison. The two distributions differ slightly: while VR adjustments of around 1.1 are most likely in the Naghavi et al. distribution, the Bayesian mode is slightly higher and larger VR adjustments are more likely. The VR adjustment values from Naghavi et al. are not publicly available so we were not able to verify how the adjustments compare for the country-years that were included in our study.
3.2 Bayesian Maternal Mortality Estimates
The posteriors for the VR adjustment parameters resulting from the Bayesian maternal mortality model are similar to those resulting from fitting the VR adjustment model to the VR adjustment data only (see ), except that the posterior for w, the global mean of the pc’s (the country-specific mean parameters for the proportion of accurately reported maternal deaths), assigns greater probability mass to lower values of under-reporting, and the resulting distribution of Wc, k for a five-year period in a country without information suggests greater VR adjustments as compared to the estimates obtained from the VR adjustment model fitted to the VR adjustment data only. The finding that posteriors for the VR adjustment parameters resulting from the Bayesian maternal mortality model suggest more uncertainty toward greater VR adjustments may be caused by a selection bias of countries that provide information about VR adjustments; the VR adjustment may be lower in countries that have the resources to provide follow-up studies to investigate the accuracy of VR reporting as compared to countries without additional information.
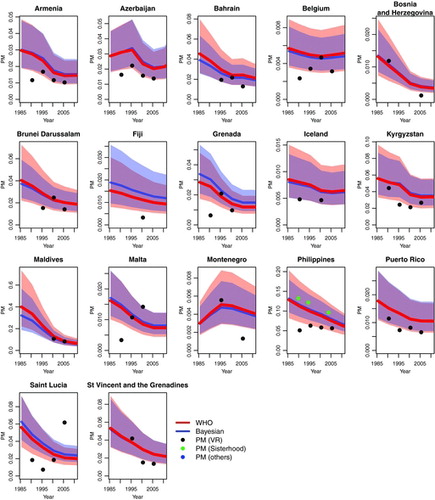
illustrates the differences in estimated PM between the modified WHO and the fully Bayesian model for selected countries. The comparison shows that for the great majority of countries, the Bayesian estimates are comparable to, or slightly lower than the modified WHO estimates. The two exceptions are Fiji and Grenada, where the Bayesian PM estimates are higher than the modified WHO estimates. For example for Fiji, the Bayesian point estimate for the adjustment (for under-reporting of maternal deaths) in the most recent observation period is 2.31 (95% CI given by 1.41 to 3.46), and the resulting PM estimate for the year 2000 is 14 per 1,000 (95% CI given by 7 to 26 per 1,000) as compared to 11 per 1,000 (95% CI given by 6 to 21 per 1,000) as given by the modified WHO model. Given that no VR adjustment data are available in Fiji, the Bayesian VR adjustment value is driven by the expected PM from the covariates in the multilevel model, the regional intercept and the estimated variability in country intercepts. External information is necessary to verify the accuracy of this VR adjustment.
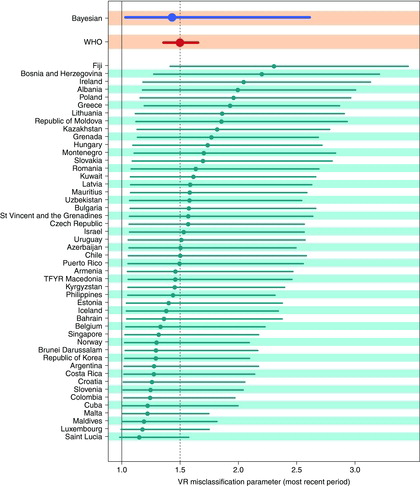
shows the point estimates and 95% CIs for the VR adjustment parameters in the most recent observation period for all non-AIDS countries with VR data but without external information on VR adjustments, estimated in the fully Bayesian model. The Bayesian posterior estimates for VR adjustment parameters vary from 1.15 (for Saint Lucia) to 2.31 (for Fiji) and have much wider credible bounds as compared to the WHO expert distribution. The comparison in allows for identification of countries where recent VR adjustments are higher or lower than expected, as compared to the WHO adjustment of 1.5, which may warrant further investigation, as discussed for Fiji. For Saint Lucia, an increasing trend in VR data on PM is observed (see ), which contradicts the decrease in PM that would be expected based on changes in the predictors of PM. This results in a downward adjustment of recent VR data in the Bayesian model. Again, country information is required to understand the specific situation in Saint Lucia and the accuracy of VR data.
4. DISCUSSION
In this article, we aimed to provide a plausible assessment of the extent of misclassification of maternal deaths in VR data and the uncertainty therein for countries where no external quantification of misreporting is available, and to capture time trends within countries with partial external information. We used a Bayesian hierarchical time series model to assess the extent of VR misclassification errors, which resulted in a distribution that is more comparable to the observed biases and increases the uncertainty that is associated with maternal mortality rates. A comparison of the Bayesian estimates, the WHO estimates and alternative estimates published by Naghavi et al. (Citation2010) suggested that the Bayesian estimates are in between the two sets of estimates.
The inclusion of the Bayesian VR adjustment model in the WHO model for the proportion of maternal deaths illustrated in which country-periods greater or smaller misclassification errors are expected based on additional information on PM and model assumptions. It also showed that posteriors for the VR adjustment parameters resulting from the Bayesian maternal mortality model suggested slightly larger VR adjustments. This is possibly explained by a selection bias of countries that provide information about VR adjustments; the VR adjustment may be lower in countries that have the resources to provide follow-up studies to investigate the accuracy of VR reporting as compared to countries without additional information. These findings warrant further investigation to avoid underestimation of maternal deaths.
With the analysis, we illustrated that Bayesian modeling approaches can be used to provide more objective and data-driven insights into maternal mortality estimates and data adjustment parameters. We verified that the Bayesian VR adjustment model would provide more plausible adjustment estimates for countries with external information on VR quality than the WHO model, if the information available in those countries would not be used to construct the estimates. Also, prior and posterior distributions in the Bayesian model were compared to communicate which parameters were most influenced by prior assumptions. Unfortunately, given the limited number of data points, formal cross-validation exercises could not be carried out. More data collection to assess VR data quality is needed to truly validate any VR adjustment modeling approach.
In this article, we focused on the challenges in using VR data for estimating maternal mortality. Similar, or potentially greater, challenges exist for using data from other sources. Instead of focusing more attention on statistical models for estimating maternal mortality, we call for more data collection and research to measure maternal mortality and assess data quality.
Table 2. VR adjustment dataset
Table 3. Posterior estimates for the Bayesian mortality estimation model parameters
References
- Bates, D., and Maechler, M. (2011), lme4: Linear Mixed-Effects Models Using S4 Classes, R package version 0.999375-42.
- Gelman, A., and Rubin, D. (1992), “Inference From Iterative Simulation Using Multiple Sequences,” Statistical Science, 7, 457–511.
- Lozano, R., Naghavi, M., Foreman, K., Lim, S., Shibuya, K., Aboyans, V., Abraham, J., et al. (2013), “Global and Regional Mortality From 235 Causes of Death for 20 Age Groups in 1990 and 2010: A Systematic Analysis for the Global Burden of Disease Study 2010,” The Lancet, 380, 2095–2128.
- Lozano, R., Wang, H., Foreman, K.J., Rajaratnam, J.K., Naghavi, M., Marcus, J.R., Dwyer-Lindgren, L., Lofgren, K.T., Phillips, D., Atkinson, C., Lopez, A.D., and Murray, C. J.L. (2011), “Progress To Millennium Development Goals 4 and 5 on Maternal and Child Mortality: An Updated Systematic Analysis,” Lancet, 378, 1139–1165.
- Naghavi, M., Makela, S., Foreman, K., O’Brien, J., Pourmalek, F., and Lozano, R. (2010), “Algorithms for Enhancing Public Health Utility of National Causes-of-Death Data,” Population Health Metrics, 8.
- Plummer, M. (2003), “JAGS: A Program for Analysis of Bayesian Graphical Models Using Gibbs Sampling,” in Proceedings of the 3rd International Workshop on Distributed Statistical Computing (DSC 2003), March 20-22, Vienna, Austria. ISSN: 1609-395X. . Available at http://mcmc-jags.sourceforge.net/.
- ——— (2011), rjags: Bayesian Graphical Models Using MCMC, . R package version 3-5.
- Plummer, M., Best, N., Cowles, K., and Vines, K. (2006), “Coda: Convergence Diagnosis and Output Analysis for MCMC,” R News, 6, 7–11.
- R Development Core Team (2011), R: A Language and Environment for Statistical Computing, . Vienna, Austria: R Foundation for Statistical Computing.
- WHO, UNICEF, UNFPA, and The World Bank. (2012), “Trends in Maternal Mortality 1990-2010: WHO, UNICEF, UNFPA and The World Bank estimates,” . available at http://www.unfpa.org/webdav/site/global/shared/documents/publications/2012/Trends_in_maternal_mortality_A4-1.pdf.
- Wilmoth, J.R., Mizoguchi, N., Oestergaard, M.Z., Say, L., Mathers, C.D., Zureick-Brown, S., Inoue, M., and Chou, D. (2012), “A New Method for Deriving Global Estimates of Maternal Mortality,” Statistics, Politics, and Policy, 3.
APPENDIX A
Bayesian VR Adjustment Model
The Bayesian VR adjustment model is specified as follows:
Bayesian Maternal Mortality Estimation Model
For the non-AIDS countries, we assume that the adjustment for AIDS deaths, si is negligible such that Equation (Equation1(1) ) simplified to yi = zi · γi · qi with
VR adjustment parameters γi are modeled with the Bayesian VR adjustment model. Adjustment parameter γi = θs for observations obtained from information on sisterhood survival, and γi = θo for observation from other (non-VR and non-sisterhood) sources. The WHO distributions for these parameters are identical:
In the Bayesian model, the WHO distributions are used as priors, but truncated at 1 to avoid high posterior probabilities of values less than 1, given that those values are deemed extremely unlikely. For parameters relating to qi, the WHO expert distributions are used as priors. All prior distributions used in the fully Bayesian model are listed in , together with their posterior median estimate and 95% CI.
The input data are observed PM (the zi’s) for the non-AIDS countries and the observed VR adjustments for all countries (to estimate the global model parameters in the VR adjustment model).