
 ?Mathematical formulae have been encoded as MathML and are displayed in this HTML version using MathJax in order to improve their display. Uncheck the box to turn MathJax off. This feature requires Javascript. Click on a formula to zoom.
Abstract
The study of atmospheric aerosols remains a very strong factor in the understanding of the Earth’s climate and predicting the air quality within any given environment. In view of this, analysis of aerosol characteristics measured using AERONET sun photometer, MODIS, Cloud-Aerosol Lidar with Orthogonal Polarization, AIRS and TOMS/OMI sensors, over six distinctly different environments in Nigeria for a period of 10 years was carried out. The results revealed significant regional and temporal variation. It showed that different aerosol types impact differently on atmospheric extinction properties. The result further revealed that aerosol loading peaks in the south and middle belt regions during the dry season (November–March), while the reverse was the case in the north during the rainy season (April–October). It was found out that coarse aerosols prevail all year round within these regions, with the rate of occurrence varying with season. The range of the ratio of coarse-to-fine aerosol was found to be as high as 19:1 during the rainy season in Sokoto and Maiduguri, and 3:1 during the dry season. In Abuja and Ilorin, it ranged from 13:1 to 2:1 in both seasons. The atmospheric extinction values plotted against relative humidity (RH) showed that extinction grows at very low RH of about 45% in a less anthropogenic polluted environment (north), while a RH of 60% and above is required for growth to take place in a more polluted environment in the south. This implies that the use of rain water for drinking and other domestic purposes should be done with caution.
PUBLIC INTEREST STATEMENT
This research article is on aerosols and how it affects the atmospheric environment. We discovered that the urban settlements of Ikeja and Port Harcourt (PH) are more polluted than the other locations studied. We also realized that in Ikeja and PH, extinction requires a lot of water vapour to grow significantly in the atmosphere, while in the other places, it requires less water vapour. This research also shows that in spite of the aerosols in the atmosphere, rainfall is increasing over the years studied.
Also, air quality in Nigeria is on the decrease in the south as a result of industrialization and fossil-fuel combustion, while in the north, desert dust and biomass burning is responsible for the phenomena. Therefore, the rate of acid rain, pollution-related ailment and contamination of soil is expected to be on the increase in the south.
1. Introduction
Aerosols in the atmosphere comprising smoke from biomass burning (BB), sea salts and dust particles originating from deserts and bare surfaces are among the atmospheric particles that affect air quality and the Earth’s meteorological cycle. The understanding of their meteorology, source and effects on the environment needs to be properly studied. This calls for continuous and consistent study aimed at understanding aerosols through measurements from ground, space and air-bound platforms. But ground-based measurements cannot comprehensively monitor aerosols because these particles can be transported and deposited over long distances remote from their source and monitoring stations. Meanwhile, air-bound platforms are very expensive and therefore not available to the larger research community especially in developing countries such as Nigeria. The shortcomings of the ground and air-bound platforms underscore the choice of satellite as the platform of interest for data acquisition in this study. Winker et al. (Citation2010) reported that satellite aerosol remote sensing has been applied widely in recent researches in atmospheric studies; this was exploited in order to arrive at a holistic overview of the aerosol situation in the country. Before now, most aerosol researches in Nigeria had applied various techniques to study aerosol dynamism but most studies made use of data from synoptic stations and aerosol measuring platforms. Anuforom (Citation2007) for example applied data from synoptic stations observed in Nigeria to determine that aerosol particle size decreases from north to south during Harmattan, while Nwofor (Citation2010) observed that extinction growth is enhanced by increased relative humidity (RH) in Ilorin. Elsewhere, Skupin, Ansmann, Engelmann, Baars and Müller (Citation2014) observed that Aerosol Optical Depth (AOD) also increases with RH as a result of particle size (growth) enhancement and chemical composition (Winkler, Citation1988; Okuda et al., Citation2004; Sun et al., Citation2013). The increase in RH results in increased aerosol particle extinction (Cheng et al., Citation2015; Liu et al., Citation2012; Malm & Day, Citation2001; Sun et al., Citation2013), which implies that soluble particles take up water vapour, increasing the particle size in the atmosphere and inhibiting visibility (Liu et al., Citation2012; Malm & Day, Citation2001) causing air pollution (Goyal and Sidhartha, 2003; Tsai, Citation2005). The increase in particle growth is mostly as a result of increased urbanization due to vehicular emission, fossil-fuel combustion and industrialization (see Chen et al., Citation2012; Goyal and Sidhartha, 2003; Tsai, Citation2005; Zhang, Wang, Sheng, Kanai, & Ohta, Citation2004), depending on the meteorological condition (Zujev & Krekov, Citation1986). Zhou et al. (Citation2014) and Qu, Wang, Zhang, Wang and Sheng (Citation2015) further reported that increased atmospheric extinction as a result of RH also depends on different particle sizes, while Zhang and Mcmurry (Citation1992), Tang (Citation1996), Mcmurry (Citation2000), Tang (Citation1996) and Zhang, Shen, Li, Zhu and Yu (Citation2017) opined that extinction can increase by more than 100% when RH exceeds 70–80%. Despite all these studies, the comprehensive knowledge about aerosols in Nigeria are limited to where NASA AERONET station is located and some academic environments where in-situ measurements are carried out as the need arises. Therefore, this research paper is the first comprehensive study of aerosols in Nigeria using satellite remote sensing, AERONET and meteorological data to create models which can be replicated in other parts of the country to segregate between coarse and fine aerosols. Hence, in this work, aerosol optical of the entire country was mapped and its relationship with atmospheric extinction and RH was also examined.
2. Materials and methods
2.1. Study location
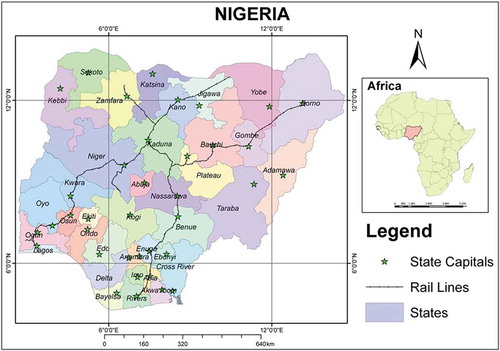
Nigeria is located in West Africa on the Gulf of Guinea and has a total area of 923,768 km2 (356,669 sq. mi). It lies between latitudes 4° and 14°N, and longitudes 2° and 15°E. The far south is defined by its tropical rainforest climate, where annual rainfall is 60–80 in (1,524–2,032 mm) a year. In the southeast stands the Obudu Plateau. Coastal plains are found in both the southwest and the southeast. This forest zone’s most southerly portion is defined as salt water swamp, also known as a mangrove swamp because of the large amount of mangroves in the area. Everything in between the far south and the far north is savannah and rainfall is between 20 and 60 in (508 and 1,524 mm) per year. Also, the amount of rainfall decreases as one moves northwards. It is also made up saline water towards the coastal region and fresh water at the hinterlands. The southern region of Nigeria experiences a double rainfall maxima characterized by two high rainfall peaks, with a short dry season and a longer dry season falling between and after each peaks. The first rainy season begins around March and lasts to the end of July with a peak in June. This rainy season is followed by a short dry break in August known as the August break which is a short dry season lasting for 2–3 weeks in August. This break is broken by the short rainy season starting around early September and lasting to mid-October with a peak period at the end of September. The ending of the short rainy season in October is followed by Long Dry Season. This period starts from late October and lasts till early March with peak dry conditions between early December and late February. Nigeria has a population of 160 million people according to the 2006 census (NPC, Citation2009).
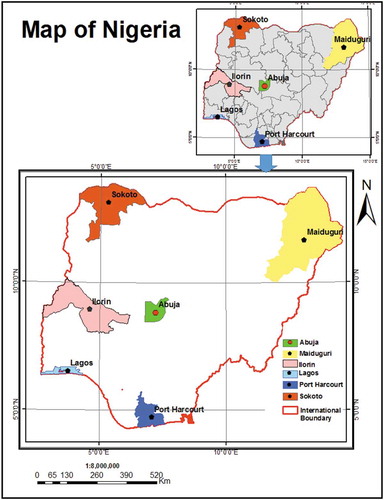
The study sample locations are Sokoto, Maiduguri, Abuja, Ilorin, Ikeja and Port Harcourt (PH) (see Figure ). These locations were selected based on their characteristic economic and geographical vantage locations. Sokoto and Maiduguri are located within the Sahel, but locations are less industrialized and mostly agrarian. Abuja and Ilorin are located within the middle belt of Nigeria which is the transition belt between the savannah and rain forest. The vegetation is characterized mainly by scanty forest and tall grasses known as guinea savannah. PH and Ikeja are located within the fringes of the Atlantic Ocean and are characterized by huge industries (such as oil companies, fertilizer, paint manufacturing, food process, pesticides, wood processing, petrochemicals plants etc.), which are sources of anthropogenic aerosols. Generally, meteorological seasons in Nigeria are categorized into dry and rainy season. The dry season begins in November and lasts till March each year, while the raining season starts in April and lasts till October in most part of the country. The rainy season starts earlier in the middle belt and south than in the Sahel. RH in the south and middle belt is large in both seasons compared to the upper moist and dry Sahel areas. Low humidity of <60% is experienced during the Harmattan, when dust is transported southwards from the Sahara and Bodele depression (Nwofor, Citation2010).
Figure 1. Study area map.
2.2. Data set and instruments
Version 2 aerosol optical depth retrievals from AERONET Ilorin measured with CIMEL sun photometer (quality assured Level 2 monthly averaged data) (Holben et al., Citation1998) were used for this study, which was also correlated with MODIS Level 2 data over the same area at NASA AEROSTAT web page. Also, the AERONET fine AOD data were used together with AIRS carbon monoxide (CO) to ascertain the ratio of coarse-to-fine aerosol loading.
MODIS Terra monthly mean AOD at a spatial resolution of 1°× 1 was obtained for the period 2003–2012 from NASA at http://disc.sci.gsfc.nasa.gov/giovanni/. These data were used to study the annual, seasonal and cumulative aerosol loading over the entire country.
This study also used observations from Cloud-Aerosol Lidar with Orthogonal Polarization, Level 2 versions 3.01 and 3.02 profile product consisting of aerosol subtype and vertical mask feature. These data were used to identify the various aerosol subtypes of dust, polluted dust (PD), polluted continental (PC) and smoke. Further literature on CALIPSO instrument configuration and sensor characteristics can be found in Winker, Hunt and McGill (Citation2007) and Winker, Pelon and McCormick (Citation2003).
The data used in this study are monthly values of meteorological visibility (at 9 km altitude) for 10 years (2003–2012) and RH (%) measured at the PH, Ikeja, Abuja, Ilorin, Maiduguri and Sokoto NIMET stations. The following mathematical expressions were used to computing the statistics in Section 3.
Trf is the total loading for reference location and Tn is the total loading for other location n. Equation (2) was replicated in order to calculate the results in Tables .
Furthermore, Figure shows the schema of how the various data were integrated to arrive at the results. Finally, all the data sets used in this study are monthly averages which took care of several gaps inherent in daily data acquisitions.
Figure 2. Work flowchart for data integration.
3. Results and discussions
3.1. Cumulative aerosol loading
The result shows that the central locations of Abuja and Ilorin had CO values of 24.8 × 10¹⁸ and 24.35 × 10¹⁸ molecules/cm2, respectively, which implies that these locations had the highest volume of cumulative carbonaceous aerosols for the entire study period when compared with the other locations sampled, followed by PH and Maiduguri at 23.48 × 10¹⁸ and 23.23 × 10¹⁸ molecules/cm2, respectively, then 22.1 × 10¹⁸ molecules/cm2 for Ikeja and 22.33 × 10¹⁸ molecules/cm2 for Sokoto, respectively. It was observed that locations with the highest CO values recorded lower aerosol absorption index (AI) and AOD values; these high values are attributable to the type of anthropogenic activities within those locations. The carbonaceous aerosol in Abuja can be attributed to atmospheric transport of particulates (see Abiye et al., Citation2014) from BB and industrial activities from the surrounding localities, which were higher than the value obtained for Lagos by Eze et al. (Citation2012). Ikeja which had the least CO value was observed to have recorded the highest total value of 5.2 for the AOD followed by PH at 4.91, while Ilorin and Abuja recorded 4.4 and 4.25, respectively. Subsequently, Sokoto and Maiduguri had AOD values of 3.47 and 3.99, respectively.
3.2. Aerosol loading trend
The results from scatter plots show that the aerosol loading in all the study sites for the period under review was on the decrease (table not shown). This is indicated by the negative values of the slopes of the individual parameters. The result obtained from the calculated annual mean shows a decreasing trend in AOD, absorbing and carbonaceous aerosols in all the study locations except for PH where the AOD showed a positive trend. This indicates that absorbing aerosols are not the only contributor to the aerosols loading in PH. By implication, non-absorbing aerosols contribute substantially to the aerosol loading in PH, as a result of the various industrial activities in PH such as shipping (which crates bubbles that bust and emit sea salt particles into the atmosphere) and gas flaring. For instance, Nigeria flared a total of 575 billion cubic feet (BCF) of gas in 2007 which was reduced to 515 BCF in 2011 (EIA, Citation2015), which makes Nigeria the second largest gas flaring nation in the world after Russia. This was a supporting factor for decreasing aerosol trend in Nigeria. This is in line with the trend (extract from slope = S) obtained from AERONET observation at Ilorin (for AOD [AERONET −0.002, satellite −0.010] and fine AOD [AERONET −0.0016, satellite (CO) −0.011]). Therefore, we considered the use of CO to infer the presence of fine mode aerosols which have sources from biomass, fossil combustion and other industrial activities. Furthermore, the aerosol loading in the various locations during the dry season for the period under study was compared using Ikeja as the reference location. The results obtained showed that the aerosol loading in Ikeja was greater than those in other locations by varying degrees with the exception of CO values in Ilorin and Abuja which were higher by 1.31% and 3.57%, respectively, despite that the AOD and AI in Ikeja still remain higher by13.37% (AOD) and 2.57% (AI) in Ilorin and 15.77% (AOD) and 3.22% (AI) in Abuja. A breakdown of loading shows that in PH, it varied by 2.68% for AOD, 1.58% for AI and 2.13% for CO. In Sokoto and Maiduguri, the aerosol loading variations were very obvious, 42.05% (AOD), 11.09% (AI) and 6.75% (CO) in Sokoto and 33.63% (AOD), 9.09% (AI) and 6.75% (CO) in Maiduguri (see Table for % variations with respect to the other locations).
Table 1. Percentage difference of aerosol loading in the various locations during the dry season
The reasons for the spatial variation of aerosol can be attributed to the prevailing wind regime (see Figures and ), in which during the dry season, fine dust aerosols are transported from Sahara Desert and Bodele depression down to the Gulf of Guinea. The coarse particles are therefore deposited mainly in the north (Sokoto and Maiduguri). It should be noted that the dry season is the period when dust and smoke from BB from parts of Sahara and West African Sahel are transported downwind by the north-east trade wind (NETW) over Nigeria to the Gulf of Guinea.
Figure 3. HYSPLIT 7 days back trajectory for the dry season (a) Abuja, Maiduguri, Sokoto (b) Ikeja, Port Harcourt, Ilorin.
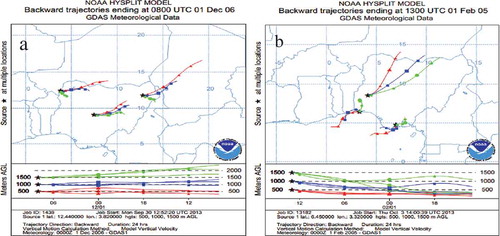
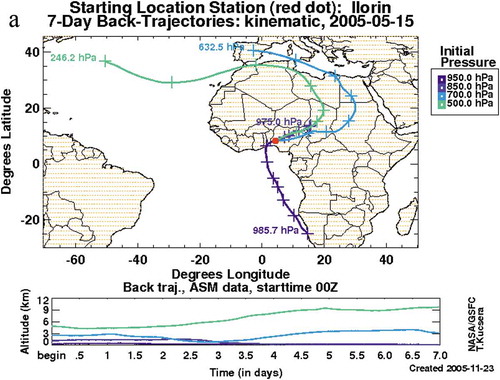
Figure 4. Seven-day back trajectory correlated with the AERONET station at Ilorin (red dot) showing the sources of the different air masses arriving at the station at different isobars in May 2005.
During the rainy season, it was observed that the pattern of aerosol distribution between the northern and southern parts of the country was reversed (see Table ). The result indicates that Sokoto and Maiduguri had more cumulative aerosol (AOT) and absorbing aerosol (AI) than any other location studied but less carbonaceous aerosols. The reason for the high AI and AOT, in the north compared to the south, was a result of non-intrusion of dusts from the deserts by the counteraction of the NETW by the south-west trade wind (SWTW) as was observed in Figure . (It should be noted that the SWTW brings in moisture from the Atlantic Ocean which wets the soil and at the same time reduces the rate at which dusts are buoyance in the south.) The constant carbonaceous aerosols loading in the south indicate continue industrial activity all year round.
Table 2. Percentage difference of rainy season aerosol loading for the different locations
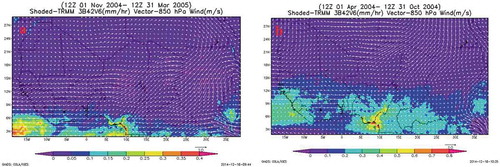
Figure 5. Wind speed and direction generated from NASA Hurricane Analysis Tool, the vectors shows the wind direction while the length of the arrow stands for the magnitude of the wind speed during the (a) dry season (b) rainy season.
3.3. Seasonal variation of aerosol loading
The result on seasonal analysis of aerosol loading analysis is (see table not shown) that it displays the cumulative seasonal aerosol loading difference between the dry and rainy seasons for each location. The results imply that aerosol loading increases from south to north during the dry season, while the loading decreases from south to north during the rainy season. The magnitude of the seasonal variations indicates that PH, Ikeja, Ilorin and Abuja had decreased AOD by 26.55%, 25.52%, 12.39% and 10.16%, respectively, while it increased by 20.75% in Maiduguri and 24.29% in Sokoto. Subsequently, the values for AI reduced significantly, for PH by 24.12%, Ikeja 20.73%, Ilorin 9.39% and 12.44% for Abuja, while it increased in Maiduguri and Sokoto by 11.88% and 12.46%, respectively. Meanwhile, CO values did not show any significant decrease, this was either as a result of long residence time of CO compared to aerosols or the continuous emissions of CO from the sources such as factories, automobile combustion, generating sets and gas flaring. This implies that these figures may not necessarily mean increased CO emission but do not rule out CO contributions from the continuous emission source irrespective of the season. In Maiduguri and Sokoto, where CO increased by 2.60% and 3.64% respectively could be as a result of biomass emission between May and July hence the northern part of the country experience late onset of rain. Furthermore, this could also be as a result of aerosol transport from Egypt, Libya, Chad, Europe and the Atlantic (see Figure ).
Subsequently, the restriction of dust particles to Maiduguri and Sokoto was result of the influence of the tropical maritime air mass (TMAM) which counteracts the tropical continental air mass (TCAM) around latitude 11°N as shown in Figure , thereby creating a wind flow in perpendicular direction. This gave rise to the concentration of both coarse and fine dust particles to Maiduguri and Sokoto, which conversely increased the aerosol loading and decreased the moisture-laden TMAM for a longer period. In the south and the central parts of Nigeria, this interaction between the TMAM and the TCAM ensures that dust particles from the active dust sources in the Sahel are restricted to northern fringes of the country. The trend of aerosol loading extracted from the scatter plot for this season also showed that AOD increased in PH, Ikeja and Ilorin. Generally, this result implies that there is an enormous difference in the aerosol loading between the northern and the southern parts of Nigeria, contrary to expectation that there would more aerosols in the locations closer to the major dust source in on earth. The prevailing wind regime, during the dry season, ensures that fine dust aerosols are transported from Sahara Desert and Bodele depression down south in Nigeria (see Figures and ), in which the fine dust particles remain afloat in the air due to its small fall speed while the coarse particles are deposited close to locations in the north. Anuforom, Akeh, Okeke and Opara (Citation2007) further noted that the dry season is the period when dust and smoke from BB from parts of Sahara and West African Sahel are transported downwind of the NETW over Nigeria to the Gulf of Guinea. Furthermore, it is pertinent to note that AOD loading in Nigeria has been reported to be the highest compared to the other adjoining locations within the Sahel such as Cape Verde, Banizoumbou and Agoufou. Oluleye, Ogunjobi, Bernard, Ajayi and Akinsanola (Citation2012) reported aerosol loading from different platforms for various locations in Africa for a period ranging from 2005 to 2009, Mail (Agoufou) (AERONET: 0.52, TOMS: 0.58, MODIS Terra: 0.47), Niger (Banizoumbou) (AERONET: 0.57, TOMS: 0.85, MODIS Terra: 0.69), Cape Verde (AERONET: 0.37, TOMS: 0.84, MODIS Terra: 0.37), Nigeria (Ilorin) (AERONET: 0.75, TOMS: 1.07, MODIS Terra: 0.88). The high AOD loading in Nigeria is attributable to the following reasons.
Large quantities of dust and plant debris are easily lifted locally from the surface in the dry season; this could also account for the differential aerosol loading within Nigeria compared with the neighbouring countries.
The high CO despite less BB implies that the influence of accumulation mode aerosols in the seasonal flux patterns is supported by the high industrialization and traffic density of Ikeja and PH.
The prevailing wind pattern in West Africa as shown in Figure shows that the wind speed reduced drastically when in Nigeria, giving rise to a unique wind pattern in Nigeria different from the neighbouring countries. D’Almeida (Citation1986) observed that about 60% by mass of the dust produced in the Sahara and the surrounding region is transported southward to the Gulf of Guinea, 28% westward to the equatorial North Atlantic Ocean and 12% northward to Europe. This implies that dust particles lifted from the Bodele depression that passes through Nigeria are more or less deposited in the country. This phenomenon could probably be responsible for the continuous high AOD loading in Nigeria reported by Oluleye et al. (Citation2012).
Increase population and land-use intensification in the zone due to oil and gas exploration. It is also possible that anthropogenic activities which affect land surface conditions may also contribute to high aerosol loading in Nigeria. Onyeuwaoma et al. (Citation2015) further showed that high population density results in increased aerosol emission in southern Nigeria.
3.4. Relationship between CO, fine aerosol and coarse aerosol
The fine AOD from AERONET and CO from AIRS for Ilorin were used to create a relationship between CO and fine aerosols (AODf), at a correlation of 0.67. A linear regression analysis was performed to determine how CO levels may predict fine aerosol concentrations. Once this relationship was established, the prediction function was applied to the original (aerosol data) data set to transform the CO readings into fine aerosol readings. Furthermore, two models (see Equations 4 and 5) were created, one to assess the relationship between CO and fine aerosols and the other predict fine aerosol levels for Ilorin.
The model equations are
The predicted fine aerosol was compared with the AERONET fine aerosol and the result is shown in Figure . The black line is the raw CO data, the red line is the raw fine aerosol data and the blue line represents the prediction. The closer the red to the blue lines, the better the prediction.
Figure 6. The results from two different models used in converting CO to fine aerosols. The models were run from data acquired from AERONET Ilorin and CO from AIRS for the same location.
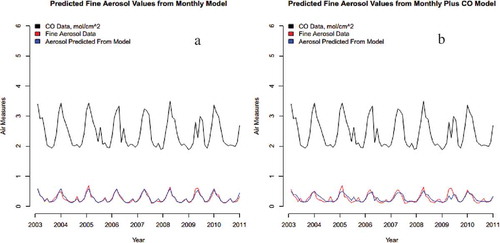
Furthermore, Equation (4) was used to generate the ratio of fine-to-coarse aerosol for all the locations as shown in Figure . The ratio of the coarse-to-fine aerosols shows that coarse aerosols prevail more in the north (Maiduguri and Sokoto) ranging from 7:1 to 14:1 during the rainy seasons and reducing to 3:1 during the dry season. In Abuja and Ilorin, the ratio of coarse-to-fine aerosols ranged from 11:1 to 2:1. Meanwhile, the situation in PH and Ikeja shows that the coarse-to-fine aerosol ranged from 11:1 to 1.5:1. This result indicates that coarse aerosols dominate the air space in Nigeria, but the magnitude of the dominance decreases from north to south.
Figure 7. Curve showing the ratio of coarse-to-fine aerosol in Ilorin, which indicates the volume of the prevailing aerosol.
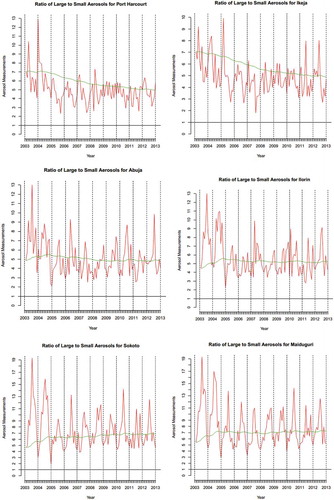
The trend line for Ikeja shows an ever-increasing fine aerosol loading which was a result of increased industrialization, fossil energy consumption from generators, vehicles and domestic cooking. This is because Ikeja has the highest volume of industries in Nigeria, population density and vehicular activities. The curve for Abuja maintains a relative constant ratio between the coarse and fine aerosol loading indicated by the steady trend. The trend line also shows that coarse aerosols increased from 2003 to 2004 and then drop in 2005 while it maintained a steady flow thereafter, from 2005 to 2012. The fine aerosols are aerosol originate majorly from local construction, vehicular emission and biomass from burning from neighbouring locations during the dry season (see Abiye et al., Citation2014). The curve for Ilorin maintained the same pattern with Abuja, but with BB as the major source of the fine aerosol; hence, Ilorin is not industrialized but mostly agrarian. The curves for Sokoto and Maiduguri show that the volume of coarse aerosol increased between 2003 and 2004 and maintains a steady level thereafter.
Subsequently, the CALIPSO image (figure not shown) shows that in all the locations sampled, the characteristic aerosols are basically dust, PD and smoke (BB aerosol), while the PC occurred in PH and Ikeja. Ezeh et al. (Citation2014) and Nie et al. (Citation2014) reported that PDs occur as a result of anthropogenic activities which may have resulted from industrial or vehicular emissions. Meanwhile, Abuja and Maiduguri recorded the absence of smoke during the rainy season. Generally, the vertical height of the aerosols drastically decreases during the rainy seasons as a result of wetness of the soil, vegetation (which are not easily ignited during the rainy season) and reduced influence of NETW in the country during the rainy season. Interestingly, there is no diurnal variation in the aerosols captured during the day and night overpass by the CALIPSO. This implies that the night and day overpass captures the same aerosol types for the same location at the same period.
3.5. Implications of findings on atmospheric extinction and RH
The analytical relation between humidity and light extinction was evaluated to make more deductions on the evaluated seasonal visibility averages. In order to improve the correlation, the visibility data were first converted to atmospheric extinction values using the equation by Middleton (Citation1952) (see Equation (6)).
where Rv is the visibility averages and is the atmospheric extinction.
These extinction values were then correlated with RH data for the same period as shown in the correlation between the extinction parameter (σ) and the RH was made more sensitive by weighting the extinction () values with the RH according to the expression in Nwofor (Citation2010) (see Equation (7)).
values were then plotted against the aerosol modal fraction (figure not shown). The deductions made from the atmospheric extinction are as follows:
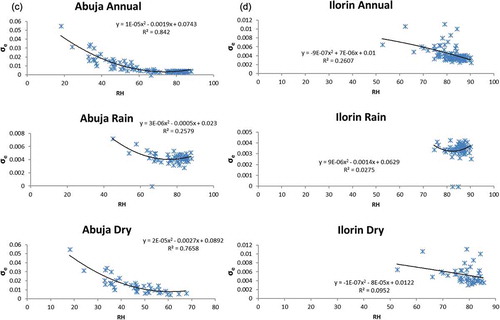
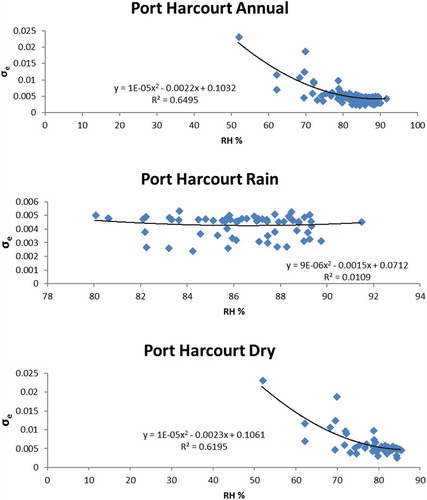
In the Sahel area, σ grows at low RH (Maiduguri RH <45%, Abuja RH >70%), Sokoto (RH >50%), compared with the southern and middle belt areas, (PH RH >88%, Ikeja >80%, Ilorin RH >80%). This shows that particles become hygroscopic based on their meteorology, location and back ground economic activity. The back trajectory in Figure shows that SWTW and local sources prevail over PHC and Ikeja during both season, which suggests that there is the likelihood of sea salt influx from the Atlantic Ocean and local pollution. For the Sahel and middle belt, the NETW from the Sahara plays more critical role in bring in aerosol than the weak SWTW. This suggests that Sahara dust prevails over the north with little influence in the south.
In Maiduguri, it was observed that σ increases during the dry season at 24% RH, when dust particles dominate in the atmosphere.
The plots in Figure also show a rapid decay of σ for every part of the country except for Sokoto, because particles in Sokoto tend to be more hygroscopic than in other parts of the country. Generally, σ grows more in the wet season presumably due to the influence of RH on particles in the atmosphere.
Figure 8. A cross-section of some of the CALIPSO aerosol subtype images used in confirming the various aerosol types occurring in the different parts of the country during the various seasons. (a) Graph of the atmospheric extinction parameter versus the relative humidity (%) for Sokoto. (b) Graph of the atmospheric extinction parameter versus the relative humidity (%) for Maiduguri. (c) Graph of the atmospheric extinction parameter versus the relative humidity (%) for Abuja. (d) Graph of the atmospheric extinction parameter versus the relative humidity (%) for Ilorin. (e) Graph of the atmospheric extinction parameter versus the relative humidity (%) for Port Harcourt (PHC). (f) Graph of the atmospheric extinction parameter versus the relative humidity (%) for Ikeja.
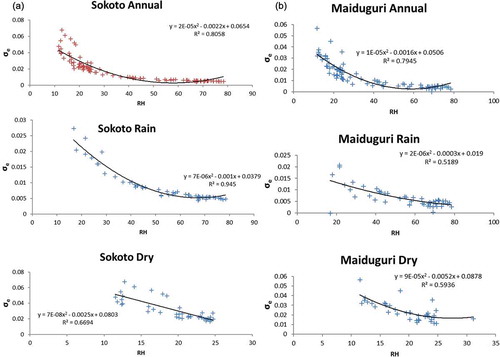
Figure 8. Continued
Areas where σ grows at very high RH are the most polluted due to industrial emission as was observed (table not shown). It suggests that dust particles increased in Maiduguri and Sokoto during the rainy season by 20% and 24%, respectively, while carbonaceous aerosols increased by 2% and 3% as well. Meanwhile, dust reduced in PHC and Ikeja by 26% and 25% and carbonaceous by 0.97% and 1.44%, respectively. Furthermore, Ilorin and Abuja recorded reduced dust by 12% and 10% and reduced carbonaceous aerosol by 3% and 6%, respectively. When these results are integrated with the deductions from Figure , it implies that areas with more dusts and less carbonaceous aerosols do not require a lot of RH for extinction to take place.
Also, σ grows at very low RH when pure dusts are in the atmosphere during the rainy season especially within the Sahel. This can be confirmed with Figure , which shows that the wind-laden dust from the Sahara does not penetrate beyond latitude 9.5°N.
3.6. Extractions from the relationship between coarse aerosol, fine aerosol and atmospheric weighted extinction
Figure shows the graphs of the relationship between σe and fine aerosols, and σe and coarse aerosols. The results from the analysis as shown in Figure and b indicate that during the rainy season, when the coarse aerosols optical depth is high, it corresponds to very low extinction between 0.005 and 0.025 at 0.1–0.9 coarse optical depth while the same σe value is elicited by low fine aerosols optical value of 0.12–0.18 for the same season. During the dry season, both the coarse and fine aerosols had the same effect on particle extinction (0.02–0.056) but at different optical ranges (0.1–0.74 for coarse and 0.25–0.55 for fine aerosols). Furthermore, the annual plots for both the coarse and fine aerosols show that fine particles impact more on σe than coarse aerosols at a lower optical depth.
Figure 9. (a) Coarse aerosol versus atmospheric weighted extinction for Sokoto. (b) Fine aerosol versus atmospheric weighted extinction for Sokoto. (c) Coarse aerosol versus atmospheric weighted extinction for Maiduguri. (d) Fine aerosol versus atmospheric weighted extinction for Maiduguri. (e) Coarse aerosol versus atmospheric weighted extinction for Port Harcourt. (f) Fine aerosol versus atmospheric weighted extinction for Port Harcourt. (g) Coarse aerosol versus atmospheric weighted extinction for Ikeja. (h) Fine aerosol versus atmospheric weighted extinction for Ikeja. (i) Coarse aerosol versus atmospheric weighted extinction for Ilorin. (j) Fine aerosol versus atmospheric weighted extinction for Ilorin. (k) Coarse aerosol versus atmospheric weighted extinction for Abuja. (l) Fine aerosol versus atmospheric weighted extinction for Abuja.
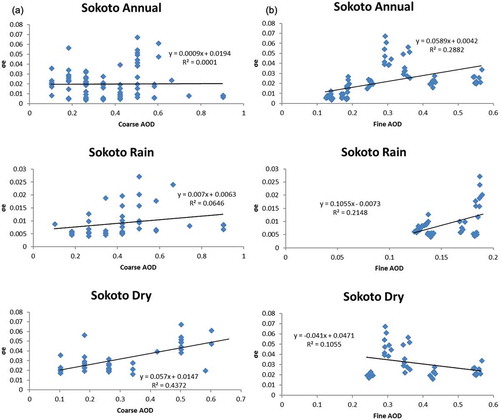
Figure 9. Continued
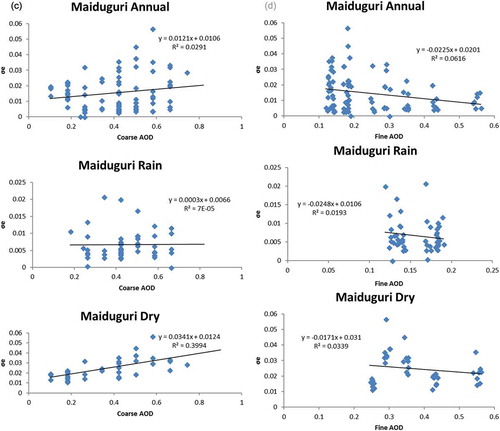
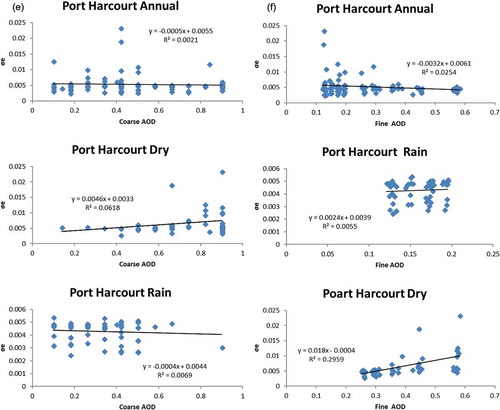
Figure 9. Continued
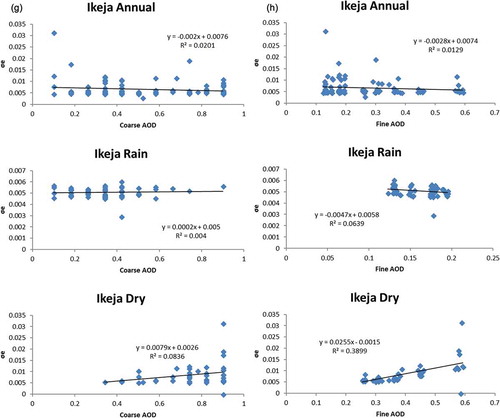
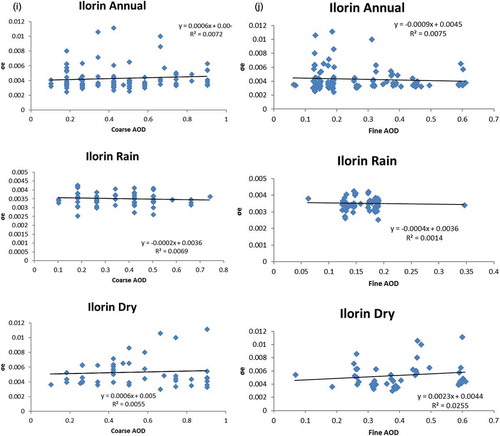
Figure 9. Continued
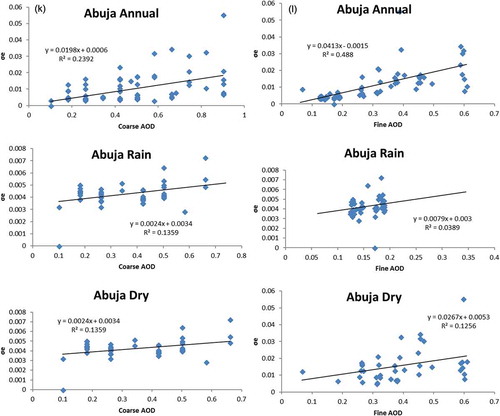
Figure and shows that annually both aerosol species had the same effect on σe, which grows with decreasing optical depth though this is more pronounced with the fine aerosols. During both the seasons, increased coarse AOD results in increased σe while decreased fine AOD results in increased σe.
In PH, the annual plots (see Figure and ) for both the fine and coarse aerosols show that both particles impact σe equally (0.002–0.023) but at different optical depths (coarse [0.1–0.9] and fine [0.13–0.57]). This implies that at low optical depth, fine aerosols have more impact on atmospheric extinction than coarse aerosols even when the optical depth of the later is higher. Seasonally, coarse aerosols have significant impacts on σe from an optical depth >0.4 at a σe ranging from 0.004 to 0.023. The difference between the extinction by fine and coarse aerosols during both seasons is that it takes a smaller volume of fine aerosols to scatter equal amount of radiation by coarse aerosols. A comparison of the results from both seasons shows that aerosols scatter more radiation during the rainy season than during the dry season, as shown by the low σe values recorded during the rainy season for both the coarse and fine aerosols.
In Ikeja, the annual coarse and fine aerosol plots (see Figure and h) are such that at an optical range (0.1–0.9), a σe ranging from 0.004 to 0.031 was elicited. (Coarse aerosol grew exponentially, from an optical depth >0.6.) Meanwhile at lower fine optical depth, σe growth was pronounced. Furthermore, the role of coarse aerosol on σe growth is such that at low optical depth >0.4, a σe of 0.005–0.031 was observed. During the dry season, the coarse optical range was between 0.34 and 0.9 with the major AOD impact on σe at an optical depth ranging from 0.7 to 0.9, resulting in a σe of 0.005–0.031. The fine aerosols on the other hand increase with a decreasing σe during the rainy season and increase with AOD during the dry season.
The situation in Ilorin shows that σe grows with increasing AOD, except that during the rainy season, increased AOD (coarse and fine) results in decreased σe. Subsequently, in Abuja (Figure and l), increased optical depth corresponds to increase in σe. The difference between the σe as a result of fine and coarse aerosols is that coarse aerosols require large optical depth to achieve the same σe effect at low fine optical depth.
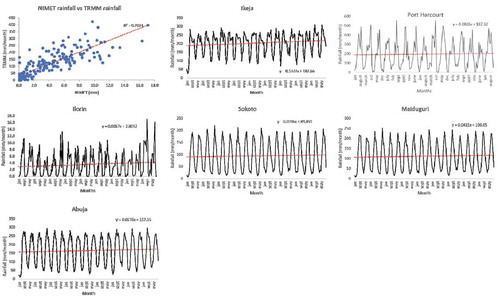
Furthermore, the rainfall trend was plotted as shown in Figure . The analysis shows that over the entire study period, rainfall has been on the increase, which implies that particle growth enhances rainfall. This implies that the particles prevalent in Nigeria are good cloud condensation nuclei, which enhances rain formation at varying rates depending on their chemical composition as indicated (see also Figure .
Figure 10. Correlation of ground-based data from Nigerian Meteorological Agency (NIMET) and satellite rainfall data from Tropical Rain Measuring Mission (TRMM), and rainfall trend over the entire study period. The top left graph in Figure 10 shows that ground data (NIMET) correlate well with the rainfall data acquired from TRMM at a correlation of 0.702.
4. Conclusion
This study has shown that the air quality in Nigeria is on the decrease; in the south, this is a result of industrialization and fossil-fuel combustion, while in the north, desert dust and BB is responsible for the phenomena. Therefore, it is expected that the rate of acid rain, pollution-related ailment and contamination of soil is expected to be on the increase in the south. Furthermore, this phenomenon has the likelihood to threaten food security in Nigeria; hence, increased aerosol loading affects the photosynthetically available radiation by reducing the ability of plants to engage in photosynthesis because the particles settle on the leaves and shade them from receiving enough energy from sun.
Competing interests
The authors declare no competing interests.
Cover image
Source: Author.
Acknowledgements
We wish to express our thanks to NASA for the provision of the various data used for this research on their various platforms; GIOVANNI, AERONET and CALIPSO. Also, we want to thank the Laboratory for Interdisciplinary Statistical Analysis and Collaboration (LISAC), O.A.U, Ile-Ife for data analysis and interpretation.
Additional information
Funding
Notes on contributors

Nnaemeka Dom Onyeuwaoma
Onyeuwaoma Nnaemeka holds a PhD in atmospheric physics from Imo State University, Owerri. His research interest is in aerosols with specific interest in air quality and aerosol direct radiative forcing. Neaemeka is also interested in topics on climate change and cloud seeding.
This present study is on the role aerosols play in atmospheric extinction growth. The authors found out that there are no uniform values of relative humidity for extinction growth in Nigeria. This implies that atmospheric extinction is dependent on the prevailing aerosol specie within an environment. Subsequently, it was discovered from this research that the air quality in Port Harcourt and Ikeja is reducing as the year goes by and needs concerted efforts from the government to alleviate in other to forestall an outbreak of air-quality related epidemic.
References
- Abiye, O. E., Obioh, I. B., Ezeh, G. C., Alfa, A., Ojo, E. O., & Ganiyu, A. K. (2014). Receptor modeling of atmospheric aerosols in Federal Capital Territory (FCT), Nigeria. Ife Journal of Sciences, 16(1), 107–118.
- Anuforom, A. C. (2007). Spatial distribution and temporal variability of Harmattan dust haze in sub-Sahel West Africa. Atmospheric Environment, 41, 9079–9090. doi:10.1016/j.atmosenv.2007.08.003
- Anuforom, A. C., Akeh, L. E., Okeke, P. N., & Opara, F. E. (2007). Inter-annual variability and long-term trend of UV-absorbing aerosols during Harmattan season in sub-Saharan West Africa. Atmospheric Environment, 41, 1550–1559. doi:10.1016/j.atmosenv.2006.08.024
- Chen, J., Zhao, C. S., Ma, N., Liu, P. F., Göbel, T., Hallbauer, E., … Wiedensohler, A. (2012). A parameterization of low visibilities for hazy days in the North China Plain. Atmos Chemical Physical, 12, 4935–4950. doi:10.5194/acp-12-4935-2012
- Cheng, Y. C., Liang, C. S., Syu, J. Y., Chang, Y. Y., Yan, Y. L., Chen, S. J., … Lin, W. Y. (2015). Characteristics of aerosol extinction coefficient in Taipei Metropolitan Atmosphere. Aerosol Air Qualitative Researcher, 15, 1823–1835.
- D`Almeida, G. A. (1986). A model for Saharan dust transport. Journal of Applied Meteorology, 25, 903–916.
- EIA (U.S Energy Information Administration). (2015) Country analysis brief: Nigeria. Retrieved March 10, 2015 from http://www.eia.gov/countries/analysisbriefs/Nigeria/nigeria.pdf
- Ezeh, G. C., Obioh, I. B., Asubiojo, O. I., & Abiye, O. E. (2012). PIXE characterization of PM10 and PM2.5 particulates sizes collected in Ikoyi Lagos, Nigeria. Toxicologyand Environmental Chemistry, 94, 884–894. doi:10.1080/02772248.2012.674133
- Ezeh, G. C., Obioh, I. B., Asubiojo, O. I., Chiari, M., Nava, S., Calzolai, G., … Nuviadenu, C. K. (2014). Elemental compositions of PM10–2.5 and PM2.5 aerosols of a Nigerian urban city using ion beam analytical techniques. Nuclear Instruments and Methods in Physics Research, 334, 28–33. doi:10.1016/j.nimb.2014.04.022
- Goyal, P., & Sidhartha. (2003). Present scenario of air quality in Delhi: A case study of CNG implementation. Atmospheric Environment, 37, 5423–5431. doi:10.1016/j.atmosenv.2003.09.005
- Holben, B. N., Eck, T. F., Slutsker, I., Tanré, D., Buis, J. P., Setzer, A., … Smirnov, A. (1998). AERONET - A federated instrument network and data archive for aerosol characterization. Remote Sensing of Environment, 66, 1–16. doi:10.1016/S0034-4257(98)00031-5
- Malm, W. C., & Day, D. E. (2001). Estimates of aerosol species scattering characteristics as a function of relative humidity. Atmospheric Environment, 35, 2845–2860. doi:10.1016/S1352-2310(01)00077-2
- Mcmurry, P. H. (2000). A review of atmospheric aerosol measurements. Atmospheric Environment, 34, 1959–1999. doi:10.1016/S1352-2310(99)00455-0
- Middleton, W. E. (1952). Vision through the atmosphere. Toronto: University of Toronto Press.
- National Population Commission (NPC) (2009). 2006 Population and Housing Census of the Federal Republic of Nigeria, Priority Tables, Abuja, 347 pages.
- Nie, W., Ding, A., Wang, T., Kerminen, V.-M., George, C., Xue, L., … Kulmala, M. (2014). Polluted dust promotes new particle formation and growth. Scientific Reports, 4, 6634. doi:10.1038/srep06634
- Nwofor, O. K. (2010). Seasonal levels of meteorological visibility at Port Harcourt Nigeria and possible links to aerosol loading and humidification. Pacific Journal of Sciences and Technical, 11(2), 544–551.
- Okuda, T., Kato, J., Mori, J., TENMOKU, M., SUDA, Y., TANAKA, S., … YU, X. (2004). Daily concentrations of trace metals in aerosols in Beijing, China, determined by using inductively coupled plasma mass spectrometry equipped with laser ablation analysis, and source identification of aerosols. Science of the Total Environment, 330, 145–158. doi:10.1016/j.scitotenv.2004.04.010
- Oluleye, A., Ogunjobi, K. O., Bernard, A., Ajayi, V. O., & Akinsanola, A. A. (2012). Multiyear analysis of ground-based sunphotometer (AERONET) aerosol optical properties and its comparison with satellite observations over west. Africa Global Journal of Human Social Sciences Geology & Environment Geological Science, 12, 31–48.
- Onyeuwaoma, N. D., Nwofor, O. K., Chineke, T. C., Eguaroje, E. O., & Dike, V. N. (2015). Implications of MODIS impression of aerosol loading over urban and rural settlements in Nigeria: Possible links to energy consumption patterns in the country. Atmospheric Pollution Research, 6, 484–494. doi:10.5094/APR.2015.054
- Qu, W. J., Wang, J., Zhang, X. Y., Wang, D., & Sheng, L. F. (2015). Influence of relative humidity on aerosol composition: Impacts on light extinction and visibility impairment at two sites in Coastal Area of China. Atmospheric Research, 153, 500–511. doi:10.1016/j.atmosres.2014.10.009
- Skupin, A., Ansmann, A., Engelmann, R., Baars, H., & Müller, T. (2014). The Spectral Aerosol Extinction Monitoring System (SÆMS): Setup, observational products, and comparisons. Atmos Measurement Technical, 7, 701–712. doi:10.5194/amt-7-701-2014
- Sun, Y. L., Wang, Z. F., Fu, P. Q., Jiang, Q., Yang, T., Li, J., & Ge, X. L. (2013). The impact of relative humidity on aerosol composition and evolution processes during wintertime in Beijing, China. Atmospheric Environment, 77, 927–934. doi:10.1016/j.atmosenv.2013.06.019
- Tang, I. N. (1996). Chemical and size effects of hygroscopic aerosols on light scattering coefficients. Journal of Geophysical Research, 101, 19245–19250. doi:10.1029/96JD03003
- Tsai, Y. I. (2005). Atmospheric visibility trends in an urban area in Taiwan 1961-2003. Atmospheric Environment, 39, 5555–5567. doi:10.1016/j.atmosenv.2005.06.012
- Winker, D., Pelon, M. J., & McCormick, M. P. (2003). The CALIPSO mission: Spaceborne lidar for observation of aerosols and clouds. Proceedings SPIE, 4893, 1–11.
- Winker, D. M., Hunt, W. H., & McGill, M. J. (2007). Initial performance assessment of CALIOP. Geophysical Research Letters, 34, L19803. doi:10.1029/2007GL030135
- Winker, D. M., Pelon, J., Coakley Jr, J. A., Ackerman, S. A., Charlson, R. J., Colarco, P. R., ... Wielicki, B. A. (2010). The CALIPSO mission: A global 3D view of aerosols and clouds. Bulletin of the American Meteorological Society, 91, 1211–1229.
- Winkler, P. (1988). The growth of atmospheric aerosol particles with relative humidity. Physical SCR, 37(2), 223–230. doi:10.1088/0031-8949/37/2/008
- X G, L., Zhang, Y. H., Cheng, Y. F., Hu, M., & Han, T. (2012). Aerosol hygroscopicity and its impact on atmospheric visibility and radiative forcing in Guangzhou during the 2006 PRIDE-PRD campaign. Atmospheric Environment, 60, 59–67. doi:10.1016/j.atmosenv.2012.06.016
- Zhang, R., Wang, M., Sheng, L., Kanai, Y., & Ohta, A. (2004). Seasonal characterization of dust days, mass concentration and dry deposition of atmospheric aerosols over Qingdao, China. China Particuology, 2, 196–199. doi:10.1016/S1672-2515(07)60058-X
- Zhang, X., & Mcmurry, P. H. (1992). Evaporative losses of fine particulate nitrates during sampling. Atmos Environment, 26, 3305–3312. doi:10.1016/0960-1686(92)90347-N
- Zhang, Z., Shen, Y., Li, Y., Zhu, B., & Yu, X. (2017). Analysis of extinction properties as a function of relative humidity using a k-EC-Mie model in Nanjing. Atmos Chemical Physical, 17, 4147–4157. doi:10.5194/acp-17-4147-2017
- Zhou, Y., Cheng, S., Chen, D., Lang, J., Wang, G., Xu, T., … Yao, S. (2014). Temporal and spatial characteristics of ambient air quality in Beijing, China. Aerosol Air Qualitative Researcher, 14, 1–12.
- Zujev, V. E., & Krekov, G. M. (1986). Optical models for the atmosphere. Hidrometeoizdat, Leningrad (in Russian).