
 ?Mathematical formulae have been encoded as MathML and are displayed in this HTML version using MathJax in order to improve their display. Uncheck the box to turn MathJax off. This feature requires Javascript. Click on a formula to zoom.
Abstract
A field experiment was conducted to evaluate the effect of type and rate of urea fertilizers on nitrogen use efficiency and yield of wheat (Triticum aestivum) in northern Ethiopia. The field experiment comprised five treatments, i.e. three treatments with the application of super granular urea (SGU) (application rates of 23, 46 and 69 kg N ha−1), one treatment with the application of conventional urea (CU) fertilizer (46 kg N ha−1) and one control (without any N fertilizer application) laid down in a randomized complete block design. All experimental units were supplied with a uniform rate of 46 kg phosphorus (P) ha−1in the form of triple superphosphate (TSP) at planting time. At harvest, the crop was partitioned into straw and grain for the determination of N concentration, uptake of N fertilizer recovery and use efficiency. Application of SGU fertilizer has affected the grain and straw N content and uptake of the crop. These showed an increasing trend with increasing N rate where the maximum was obtained at the highest rate of SGU (69 kg N ha−1) application. The application of 46 kg N ha−1 via SGU fertilizer revealed a yield advantage of 497.67 kg ha−1 compared to the application of 46 kg N ha−1 with conventional urea (CU) fertilizer. As a general conclusive remark, the results of the current study show that the application of SGU fertilizer can increase yield and nitrogen use efficiency of wheat crop compared with CU fertilizer. Moreover, the application with 46 kg N ha−1 with SGU fertilizer was the optimum rate.
PUBLIC INTEREST STATEMENT
Soil degradation and depletion of soil nutrients are among the major factors threatening sustainable cereal production. Among the major plant nutrients, N is the most limiting element. However, conventional N fertilizers are highly soluble and may be lost easily from the soil-plant system. The N recovery by crops from the soluble N fertilizers such as urea is often as low as 30–40%. In order to improve urea-N recovery and reduce its loss, many forms of slow-release urea fertilizers have been developed and such slow-release urea fertilizers can increase the efficiency of urea-N and are environmentally friendly because their N release is in synchrony with plant N uptake, and can provide sufficient N to satisfy plant N requirements while maintaining very low concentrations of mineral N in soil throughout the growing season. Generally, the results of the current study show that the application of SGU can influence yield to a higher extent as compared to the application of CU fertilizer.
Competing Interests
The author declares no competing interests.
1. Introduction
The low soil fertility often prevailing in the tropics has been attributed to the low inherent soil fertility, loss of nutrients through erosion and crop harvests and little or no addition of external inputs in the form of organic or inorganic fertilizers (Mureithi, Mwaura, & Nekesa, Citation2000). This is particularly evident in the intensively cultivated areas, traditionally called high potential areas that are mainly concentrated in the highlands of Ethiopia. These imply that the outflow of nutrients in most smallholder farms far exceeds inflows. To address the problems of soil fertility, several technological interventions, especially those geared towards nutrient management and soil moisture conservation, have been suggested (Mureithi et al., Citation2000). Besides, the productivity of some soils is constrained by other limiting factors even though these soils have high potential productivity or are naturally fertile, as described in the following. Many soils of Ethiopia are inherently poor in available plant nutrients and organic matter (OM) content (Tekalign et al., Citation1988; Asnakew et al., Citation1991). Mamo et al. (Citation1988) also reported that the Ethiopian highland Vertisols tend to exhibit low total nitrogen (N) and OM contents, and application of N fertilizer is considered essential to improve cereal crops production on these soils.
The crops that are commonly grown on vertisols in Ethiopia are teff, barley, bread wheat, chickpea, lentil and noug (Desta, Citation1986). Wheat is one of the major cereal crops in the Ethiopian highlands, located between the latitude of 6° and 16° north and longitude of 35° and 42° east, and is widely grown from 1500 to 3000-m mean above sea level (masl). The most suitable areas for wheat production, however, fall between 1900 and 2700 masl (Hailu, Citation1991). According to CSA (Citation2011), the total wheat-cultivated area in Ethiopia in the Meher (main rainy) season of the 2010/2011 was 1,553,240 ha. The total production for the same season was 2,855,686 tons, with a national mean wheat yield of 1.84 tons ha−1 which is still considerably below the yield level obtained from experimental fields. Therefore, the yield gap suggests that there is a potential for increasing its total production and productivity per unit area through improved crop management practices, particularly by means of increased use of mineral and/or organic fertilizers.
Soil degradation and depletion of soil nutrients are among the major elements threatening sustainable cereal production in the Ethiopian highlands. Among the major plant nutrients, N is the most limiting factor calling for external inputs in the form of fertilizer for profitable cereal crop production in most agro-ecological zones. However, conventional N fertilizers are highly soluble and, once applied to the soil, may be lost from the soil-plant system or made unavailable to the plants through the processes of leaching, NH3 volatilization, denitrification, immobilization and fixation in the soil solids as NH4-N form (Bock, 1984). The N recovery by crops from soluble N fertilizers such as urea is often as low as 30–40%, with a potentially high environmental cost associated with N losses via NH3 volatilization, NO3− leaching and N2O emission to the atmosphere (Zhou, Chen, Li, & Wu, Citation2003).
In order to improve urea-N recovery and reduce its loss, many forms of slow-release urea fertilizers have been developed and applied to different plant species under a range of environmental conditions. The products may be coated, chemically and biochemically modified, or are granular (Jiao et al., Citation2004). Such slow-release urea fertilizers can increase the efficiency of applied urea-N and can avoid negative environmental effects because their N release is in synchrony with plant N uptake, and in a single application, can provide sufficient N to satisfy plant N requirements while maintaining very low concentrations of mineral N in soil throughout the growing season (Bacon, Citation1995).
The use of slow-release urea fertilizers such as super granular urea fertilizer is a common strategy to reduce N losses in horticultural crops, but its agronomic performance for field crops has not been well established particularly in Ethiopia. Therefore, this study was conducted with the following specific objectives:
To evaluate the effect of different rates of super granular and conventional urea fertilizers on apparent recovery, agronomic and physiological efficiencies of wheat
To estimate the performance of applying super granular urea (SGU) fertilizer over conventional urea fertilizer on yield of wheat crop
To determine optimum rates of super granular urea fertilizer
2. Materials and methods
2.1. General description of the experimental area
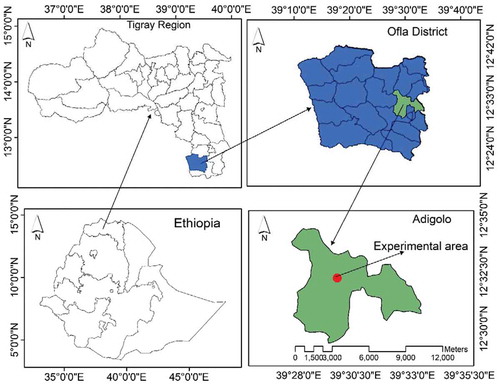
The field experiment was conducted during 2011 under rain-fed conditions in the Adi-gollo kebelle, Southern Zone of Tigray Regional State (Figure ). A total of 15 experimental plots were prepared for the experiment. The plot size was 4 m x 3 m (12 m2) each containing 15 planting rows of 4 m length at a spacing between rows of 20 cm. The study area is located 620 km north of Addis Ababa and 150 km south of Mekelle city. The altitude of the experimental area varies between 1700 and 2800 m.a.s.l, whilst the slope ranges from 2% to 35% (ODOARD, Citation2011). The experimental area is characterized by a bimodal rainfall pattern with the main wet season (kiremt) extending from July to September and the small wet season (Belg) extending from March to May. The area is characterized by heavy and erratic rainfall distribution. The 10 years (2002–2011) mean annual rainfall is 980.5 mm while the annual rainfall in 2011 was 1050 mm. Similarly, the mean maximum and minimum monthly temperatures were 22.28°C and 7.69°C, respectively. Vertisols are the dominant soil types in the area and it is characterized by a crop-dominated mixed crop-livestock farming system. The dominant crops growing in the area are wheat (Triticum aestivum L.), maize (Zea mays L.), barley (Hordeum vulgare), teff (Eragrostis tef) and some species of legume crops (ODOARD, Citation2011).
Figure 1. Location of the experimental area within Ethiopia.
2.2. Experimental materials, treatments and design
An improved wheat crop variety known as HAR-1685 was sown by hand drilling at a rate of 150 kg seed ha−1 and used as test crop. For the purpose of fertilizer use efficiency and crop yield maximization, the Ethiopian government under the ministry of agriculture has been introduced a different type of urea fertilizers from Bangladesh to Ethiopia. SGU is one of these newly introduced urea fertilizers to be verified for its performance on cereal crop production in comparison to the conventional urea fertilizer. The name of the company producing Super Granular Urea (SGU) is Desh. SGU Fertilizer which is colloquially known as Guti Urea is an American technology. This technology was first brought by US-AID in Bangladesh. SGU is produced from Briquette Machine, this machine was invented in the USA and can produce approximately 4.5 metric tons of Granules per day. The field experiment comprised five treatments, i.e. three treatments with the application of SGU (application rates of 23, 46 and 69 kg N ha−1), one treatment with the application of conventional urea (CU) fertilizer (46 kg N ha−1), and one control (without any N fertilizer application). The field experiments were laid down in a randomized complete block design with three replications. All experimental units were treated with a uniform rate of 46 kg P2O5 ha−1 in the form of triple superphosphate (TSP) at planting time.
2.3. Experimental procedures and field management
A total of 15 experimental plots were prepared for the experiment using local plows (maresha) pulled by oxen according to the conventional practice of the farmers. Accordingly, the field was plowed three times before sowing. Sowing was done in July 7/2011 while harvesting and plant sampling was done in November 3/2011. The plot size was 4 m x 3 m (12 m2) each containing 15 planting rows of 4 m length at a spacing between rows of 20 cm. The plots within a block were separated by 0.5 m whereas the blocks were separated by 1 m wide open space area. The net plot size area covered by crops was 3 m x 2.6 m (7.8 m2) leaving one outer row on both sides of each plot and 0.5 m row length at both ends of the rows to avoid possible border effects. The SGU fertilizer was incorporated 3–4 cm deep into the soil with 5 cm distance from the planting row at the time of sowing while the conventional urea fertilizer was applied in two equal splits, the first half at the time of sowing and the second half were top-dressed at the mid tillering stage of the crops. Furthermore, during the different growth stages of the crop, all necessary agronomic practices were carried out according to common practices.
2.4. Plant sampling, sample preparation and analysis
Ten plant samples were collected randomly from each plot (which was replicated three times) at harvest and partitioned into straw and grain for the determination of N concentration as well as for the calculation of N fertilizer recoveries and use efficiencies. The samples collected from each replication of a treatment were bulked to give one composite plant tissue sample per treatment for straw and grain, respectively. The samples were washed with distilled water to clean the samples from contaminants such as dust. Then, the samples were oven-dried at 70°C for 24 h or to constant weight and ground and sieved through 0.1 mm and saved for laboratory analysis.
The N contents of the grain and straw samples were determined following the wet digestion method, which involves the decomposition of the plant tissues and grain using various combinations of HNO3, H2SO4 and HClO4. From the digest, N was measured using the Kjeldahl procedure (Jackson, Citation1958). Uptake of N into wheat was calculated by multiplying the N content with the yield (plant mass per hectare). This was done for wheat straw and grains, respectively, and summed up to obtain the uptake for the whole (above-ground) plant.
2.5. Straw, grain plant mass and harvest index
Straw yield (kg ha−1): straw yield was obtained for each plot in terms of harvested straw mass per hectare. A digital grain moisture meter was used to measure the moisture content of the grain. Digital Grain Moisture Meter is a Poland technology and the name of the company producing digital grain moisture meter is Draminski.
Grain yield (kg ha−1): grain yield was obtained for each plot as harvested grain mass per hectare. The grain yield was adjusted to 12.5% moisture content and weighed. Then, the grain yield of each treatment was adjusted to the standard moisture level by computing the conversion factor for each treatment to get the adjusted yield using the following formula (Biru, Citation1979):
where Y is actual moisture content and X is the standard moisture content to which the yield is to be adjusted (for cereals the standard moisture content is 12.5%).
Finally, the total above-ground biomass was determined by summing up the straw mass and grain mass for each plot.
Harvest index: the harvest index was calculated as the ratio of grain plant mass to the total above ground biomass (Singa, Citation1977).
2.6. Calculation of nitrogen plant uptake, apparent recovery and use efficiencies
Uptake of N into wheat was calculated by multiplying the N content with the yield (plant mass per hectare). This was done for wheat straw and grains, respectively, and summed up to obtain the uptake for the whole (above-ground) plant.
Apparent fertilizer N recovery (AR) (%) was calculated by the procedure described by Pal (Citation1991) as:
where Un stands for nutrient uptake at the n-th level of fertilizer nutrient application (kg); and Uo stands for nutrient uptake of the unfertilized plot (kg). In this case, 4 levels N of fertilizer nutrient application were used. These are 3 levels of fertilizer nutrient application for SGU treatment corresponding to the three applied SGU rates and 1 level for CU treatment. Similarly, agronomic use efficiency (AE) (kg grain kg−1 plant N) and physiological use efficiency (PE) (kg grain kg−1 plant N) of N fertilizer were calculated according to Mengel and Kirkby (Citation1996) and Woldeyesus et al. (Citation2004) as follows:
where Gn is the grain yield of the plot fertilized at the n-th level of fertilizer nutrient application (kg); and Go is the grain yield of the unfertilized plot (kg); while n is the level of fertilizer nutrient applied (kg).
2.7. Statistical analysis
The collected crop yield data were subjected to analysis of variance (ANOVA) using SAS software program version 8.2 (SAS, Citation2000). Significant difference among treatment means was assessed using the least significant difference (LSD) at 0.05 level of probability (Gomez & Gomez, Citation1984). Pearson’s linear correlation coefficient (r) values were computed to examine the magnitude and direction of relationships between the different crop parameters.
3. Results and discussion
3.1. Wheat straw and grain yield
The application of different sources and rates of N fertilizer led to significantly different straw yields at P ≤ 0.01. The highest mean straw yield of wheat (7529.67 kg ha−1) was obtained from the application of 69 kg N ha−1 with SGU. This lead to a straw yield increase of 1372.34 and 2883.67 kg ha−1 compared to the application of 23 kg N ha−1 with SGU and the control plots, respectively (Table ). The next highest mean straw yield (6861.33 kg ha−1) was obtained from 46 kg N ha−1 with SGU application and the least yield (4646.00 kg ha−1) was obtained from the control plot. The response of the test crop’s straw yield for the application of 23 kg N ha−1 with SGU fertilizer application was not significantly different (P > 0.05) from the application of 46 kg N ha−1 with CU fertilizer whereas the application of 46 kg N ha−1 with SGU fertilizer was significantly different from 46 kg N ha−1 with CU fertilizer with a straw yield advantage of 615 kg ha−1. Generally, straw yield showed a sharp increase with increasing the rates with SGU fertilizer application (Table ).
Table 1. Effect of N fertilization on wheat straw, grain and total yield
The response of wheat grain yield was significant (P ≤ 0.01) to the application of different sources (SGU and CU) and rates of N fertilizer. The highest mean grain yield of wheat (4720 kg ha−1) was obtained from the application of 69 kg N ha−1 with SGU fertilizer with 2336.33 kg ha−1 grain yield advantage over the grain yield obtained from the control plot (Table ). The next highest mean grain yield (4685 kg ha−1) was obtained from 46 kg N ha−1 SGU fertilizer application with no significant difference (P > 0.05) compared to the application of 69 kg N ha−1 with SGU and the least grain yield (2383.67 kg ha−1) was obtained from the control plot.
Total yield was also significantly (P ≤ 0.01) affected by the application of different sources and rates of N fertilizer (Table ). The highest total biomass yield (12,214.67 kg ha−1) was obtained from the application of the highest rate with SGU (69 kg N ha−1), with 1991.67 kg ha−1 total yield advantage over the lowest N rate (23 kg N ha−1) (Table ). The application of 46 kg N ha−1 with SGU had 1117.66 kg ha−1 total yield advantage over 46 kg N ha−1 with CU fertilizer application.
3.2. Nitrogen uptake and utilization
The uptake of N into wheat plant and subsequent contents in grain and straw were affected by the application of different sources (fertilizers) and application rates. Both the grain and straw N contents increased with each successive addition of N fertilizer. Accordingly, the highest grain N (2.69%) and straw N (1.28%) contents were obtained at the application rate of 69 kg N ha−1 with SGU, while the least were obtained from the control plot (Table ). Furthermore, the uptake of N into wheat plants increased approximately linearly with increased fertilizer application, where the maximum uptake was calculated at the highest SGU application rate (69 kg N ha−1) while the minimum was obtained at the control plot (Table ). The application of 46 kg N ha−1 with SGU application has improved the grain, straw and total N uptake by 20.6%, 28.1%, 23.5%, respectively, compared to the application of 46 kg N ha−1 with CU (Table ). These results clearly show the positive effects of SGU fertilizer application on wheat grain and straw yield and the improvement of grain and straw N contents. For all treatments, higher amounts of N were taken up into grains than into straw. The total N uptake recorded in the current study is much higher compared with results of other studies carried out in Ethiopia (Tilahun et al., Citation1996b; Selamyihun et al., Citation1999; Tarekegn, Tanner, & Mandefro, Citation2000), which showed total uptake of N into wheat plants ranging from 23.3 to 83.4 kg N ha−1 for Vertisols. The results are in line with the findings of Tekalign et al. (Citation2000) that grain N content increased with an increase in the rate of N fertilization for the cultivation of teff. Similarly, Genene (Citation2003) reported a positive correlation between the N fertilization rate and N content in grains and straw of wheat.
Table 2. Effect of N fertilization on wheat grain and straw N content and uptake for the five treatments (n = 5)
3.3. Apparent fertilizer n recovery, agronomic and physiological efficiencies of n
The maximum (346%) and the minimum (225%) apparent fertilizer recoveries (AR, Equation (1)) of N fertilizer were obtained at 69 and 23 kg N ha−1 with SGU fertilizer, respectively (Table ). Accordingly, the mean apparent fertilizer N recovery with SGU application obtained was 281%. Apparent recoveries of N decreased with the increasing rate with SGU fertilizer application. The application of 23 kg N ha−1 of SGU fertilizer has improved the apparent recovery of the fertilizer N by 80.20% compared to AR of N with CU fertilizer application at 46 kg N ha−1. The lower AR of N with CU might be attributed to a higher susceptibility of N to different losses through leaching or denitrification, and, hence, exhibits low recovery under conditions of high rainfall or impeded drainage. In contrast to the current result, Wuest and Cassman (Citation1992) found different N recovery with conventional urea applications for an irrigated wheat cultivation, ranging from 30% to 55% during the planting phase and from 55% to 80% during anthesis.
In the present study, the maximum agronomic N use efficiency (AE, Equation (2)) 73.13 (kg grain kg−1 N) was obtained for 23 kg N ha−1 with SGU fertilizer while the minimum AE of 33.86 (kg grain kg−1 N) was obtained for 69 kg N ha−1 with SGU fertilizer application (Table ). The application of 23 kg N ha−1 with SGU has improved the agronomic use efficiency (AE) of the fertilizer N by 80.21% compared to 46 kg N ha−1 provided with CU. The AE values were higher compared with the results of previous studies carried out for wheat cultivation in central Ethiopia i.e. 22.48 and 20.68 kg grain per kg applied N for Vertisol and Nitisol, respectively (Tarekegn et al., Citation2000), and 9.5 to 18.3 kg grain per kg N on waterlogged Vertisols (Tilahun et al., Citation1996b).
The physiological use efficiency (PE, Equation (3)) of wheat for N provided by SGU application shows an apparent decreasing trend i.e. the efficiency declined with increasing SGU fertilizer application rates (Table ). The maximum and minimum PE were calculated as 21.12 and 16.86 kg grain per kg total N uptake, respectively, corresponding to the lowest and highest SGU fertilizer application rates. Genene (Citation2003), in a study conducted on bread wheat in southeastern Ethiopia, reported mean PE as low as 2.74 kg grain per kg total N. On the other hand, Tarekegn et al. (Citation2000) reported a PE of 47.33 kg grain per kg total plant N for bread wheat grown on Vertisols in central Ethiopia.
Table 3. Effects of N fertilizer application on apparent fertilizer N recovery (AR), agronomic use efficiency (AE) and physiological use efficiency (PE) of wheat
4. Summary and conclusions
The application of different sources of N fertilizer did significantly change the straw and grain yield of wheat (at P < 0.01). The maximum straw and grain yields were obtained from the application of 69 kg N ha−1 with SGU. However, there was no statically significant difference between the application of 46 and 69 kg N ha−1 with SGU on grain and straw yield of wheat.
The plant total N content and uptake were linearly increased in response to the application of different rates of SGU fertilizer where the maximum for grain and straw N contents and uptake were obtained at the highest SGU rate. It was also apparent that much of the nutrients applied were assimilated by the grain than that achieved by the straw. Apparent recovery and Physiological use efficiency were decreased in response to applied SGU fertilizer rates where the maximum records were observed at the lowest rate of SGU fertilizer application. Generally, the results indicated that apparent recovery agronomic and physiological efficiencies were significantly enhanced by the application with SGU fertilizer compared to the application of CU fertilizer. Moreover, the application of 23 kg N ha−1 with SGU improved the agronomic and physiological use efficiency comparted to higher application rates of 46 and 69 kg N ha−1. However, the effectiveness of fertilizers in increasing crop yields and optimizing farmer profitability should not be sacrificed for the sake of efficiency alone. There must be a balance between optimal nutrient-use efficiency and optimal crop productivity.
Generally, inefficient fertilizer use may contribute to environmental degradation, particularly in intensive agricultural systems where much fertilizer applied and the recovery or use efficiency of nutrients by crops are relatively low. A portion of the N not used by the crop is presumed to be lost to the environment through denitrification, runoff, volatilization, leaching, and gaseous plant emissions. Such losses raise concerns about surface and groundwater contamination, and greenhouse gas emissions. Therefore, slow-release fertilizers are fertilizers designed to slowly release nutrients. Such products can be used to maximize fertilizer use efficiency and minimize potential losses to the environment. Increased nutrient-use efficiency may also increase the yield and quality of crops, thus providing an economic benefit for growers.
As a general conclusive remark, the results of the current study show that the application with SGU fertilizer can increase yield and nitrogen-use efficiency of the wheat crop compared with CU fertilizer while the application with 46 kg N ha−1 SGU fertilizer was the optimum rate. Moreover, the method has revealed that the use of SGU fertilizer than CU fertilizer remains beneficial for the study site; however, verification (other locations and soil types) is needed before given recommendations for other sites.
Acknowledgements
I need to convey my heartfelt thanks to Addis Abeba Soil Testing Center (Laboratory) staffs for their cooperation during the analysis of the soil and plant samples. I am also thankful to Ethiopian Agricultural Transformation Agency for their financial support, without which the work would have not been realized.
Additional information
Funding
Notes on contributors
Okubay Giday
Okubay Giday Adhanom holds bachelor’s degree in Natural Resource Management from Hawassa University, Ethiopia in July 2008. Then, he was employed by the South Wollo Bureau of Agriculture and served as a watershed team leader in the program of Natural Resource Management for two years. Meanwhile, he served as a focal person of the World Food Program, Agri-service Ethiopia and Carbon Credit projects for two years. In September 2010, he got in country scholarship in Haramaya University to pursue his MSc study in Soil Science. Since November 2012 up to February 2018 he has been worked as Lecturer in Wollo University, collage of Agriculture, Department of Soil and Water Resource Management. Since February 2018 up to now he has been working as a Lecturer in the Department of Land Resources Management and Environmental Protection of Mekelle University. His area of interest is in Soil fertility, Soil Chemistry, Soil Survey and Characterization, Land Use/Land Cover Dynamics and the like.
References
- Abebe, B. (1979). Agronomy research manual. Part III. formula and tables. Addis Ababa: Institute of Agricultural Research.
- Bacon, P. E. (Ed.). (1995). Nitrogen fertilization in the environment (pp. 608). New York: Marcel Dekker, Inc.
- Beyene, D. (1986, February 11–14). The response of pulse crops to nitrogen and phosphorus fertilizers. Paper Presented at the Workshop on Review of Soil Science Research in Ethiopia, Addis Ababa, Ethiopia.
- CSA (Central Statistical Authority). 2011. Agricultural Sample Survey 2010/2011. Reports on area under cultivation, yield and production of major crops for 2009/10-2010/11 main (Meher) season, Ethiopia.
- Gebremariam, H. (1991). Wheat production and research in Ethiopia. In D. G. T. Hailu Gebremariam & M. Hulluka (Eds.), Wheat research in Ethiopia: A historical perspective (pp.1–5). Addis Ababa: IAR/CIMMYT.
- Geleto, T., Tanner, D. G., Mamo, T., & Gebeyehu, G. (1996b). Response of rainfed bread and durum wheat to source, level and timing of nitrogen fertilizer on two Ethiopian Vertisols. II. N uptake, recovery and efficiency. Fertilizer Research, 44, 195–10. doi:10.1007/BF00750926
- Gezu, G. (2003). Yield and quality response of bread wheat (Triticum Aestivum L.) varieties to rate and time of nitrogen fertilizer application in Kulumsa, southern eastern Ethiopia (An M.Sc.Thesis). Alemaya University.pp 80–83.
- Gomez, K. A., & Gomez, H. (1984). Statistical analysis for agricultural research (pp. 120–155). John Willy and Sons Inc.
- Jackson, M. L. (1958). Soil chemical analysis. New Jersey: Prentice Hall, Inc., Engle Wood Cliffs.
- Jiao, X. G., Liang, W., Chen, L., Zhang, H. J., Wang, P., & Wen, D. (2004). Effect of slow-release urea fertilizers on urease activity, microbial biomass, and nematode communities in an aquic brown soil. Science in China. Series B, Chemistry, Life Sciences & Earth Sciences, 47, 777–780.
- Kidanu, S., Tanner, D. G., & Mamo, T. (1999). Effect of nitrogen fertilizer applied to teff on the yield and N response of succeeding teff and durum wheat on a highland Vertisol. African Crop Science Journal, 7(1), 35–46. doi:10.4314/acsj.v7i1.27776
- Mamo, T., & Erkossa, T., (2000). Review of soil fertility and plant nutrition research on Conducted on tef. Proceeding of the International work shop tef genetic and improvement. Addis Ababa, Ethiopia.pp.37–38.
- Mamo, T., Haque, I., & Kamara, C. S., 1988. Phosphorus status of Ethiopian vertisols: management of vertisols in Sub-Saharan Africa. Proceeding of the conference held at International Livestock Centre for Africa (ILCA), 31 August - 4 September 1987. pp. 232–252.
- Mengel, K., & Kirkby, E. A. (1996). Principles of plant nutrition (pp. 314). New Delhi, India: Panima Publishing Corporation.
- Mureithi, J. G., Mwaura, P. M., & Nekesa, C. O. (2000). Introduction of legume cover crops to smallholder farms in Gatanga, Central Kenya. Proceedings of the Second Scientific Conference of the Soil Management and Legume Research Network Projects, Kenya. pp. 98– 102.
- Ofla District office of agriculture and rural development, (2011).
- Pal, U. R. (1991). Effect of source and rate of nitrogen and phosphorus, on yield and nutrient uptake and apparent fertilizer recovery by maize in southern Guinea Sananna of Nigeria. Journal of Agricultural Science and Technology, 1, 21–24.
- SAS Institute. (2000). SAS user’s guide, statistics version 8.2 (Ed.). Cary, NC, USA: SAS Institute.
- Sinabo, W., Gretzmacher, R., & Edelbauer, A. (2004). Genotypic variation for nitrogen Use efficiency in Ethiopian barley. Field Crop Research, 85, 43–60. doi:10.1016/S0378-4290(03)00135-7
- Singa, S. K. (1977). Food legume distribution, adaptability and biology of yield. FAO Plant Production and Plant Protection Paper, 3, 124.
- Tarekegn, A., Tanner, D. G., & Mandefro, C. (2000). Agronomic and economic evaluation of the farm N and P response of bread wheat grown on two contrasting soil types in central Ethiopia. The Eleventh Regional Wheat Workshop for Eastern, Central and Southern Africa. (pp. 239–252). Addis Ababa, Ethiopia: CIMMYT.
- Woldeab, A., Mamo, T., Bekele, M., & Ajema, T. (1991). Soil fertility management studies on wheat in Ethiopia. Eleventh regional wheat workshop for Eastern, Central and Southern Africa. Addis Ababa, Ethiopia: CIMMYT.
- Wuest, S. B., & Cassman, K. G. (1992). Fertilizer nitrogen use efficiency of irrigated wheat: Uptake efficiency of pre plant versus late-season application. Agronomy Journal, 84, 682–688. doi:10.2134/agronj1992.00021962008400040028x
- Zhou, L., Chen, L., Li, R., & Wu, Z. (2003). Behavior of soil urea N and its regulation through incorporating with inhibitors hydroquinone and dicyandiamide. In L. Ji, G. X. Chen, E. Schnug, C. Hera, & S. Hanklaus Eds., Fertilization in the third millenium fertilizer, food security and environmental protection, proceedings, Vol. II. (pp. 1175–1192). pp. Jiao, X.G., Liang, W., Chen, L., Zhang, H.J., Li, Q. China: Liaoning Science and Technology Publishing House.