
Abstract
The purpose of this research is to investigate the effect of innovation management on recycling products and to use a new method based on artificial intelligence and a machine learning for innovative product recycled management. To this end, 170 employees of fruit and berry fields were selected among the municipality of Tehran in 2015 by proportional sampling method. A researcher-made questionnaire was used to measure the attitude towards waste recycling and recycling behavior. To calculate the correlation assumptions from SPSS software, the results of the first and second group questionnaires are compared with SPSS software. To analyze the data and the results of the questionnaire in each step, based on the support machine, the Matlab software is used. The results of the research showed that: (1) a new method based on artificial intelligence and machine learning can be used for innovative product recycling. (2) Innovation management affects the recycling of products. (3) There is a significant relationship between innovation management indicators and product recycling plans. (4) Investigating the Support Vector Machine (SVM) in measuring the standardized researcher-made questionnaire on waste recycling and recycling behavior.
PUBLIC INTEREST STATEMENT
Wet wastes are one of the most common wastes, especially in urban life. Most of the waste, especially fruits and vegetables, exists in fruit and vegetable fields. With the abandonment of these wastes over the years through burial, and the expansion of the recycling culture of these wastes in recent years, there seems to be a need for renewables in waste management. In this paper, by reviewing the new methods of recycling, using the grid search method and manual search method, we chose the best of them. As a result of the research, the use of support machine is one of the management solutions to compare the advantages and disadvantages of using mechanical, energy and chemical recycling methods. Also, the use of this new diagnostic method as an innovation in waste management among staff was also acceptable.
Competing Interests
The authors declare no competing interests.
1. Introduction
Around the world, waste generation rates are rising. In 2016, the worlds’ cities generated 2.01 billion tons of solid waste, amounting to a footprint of 0.74 kg per person per day. With rapid population growth and urbanization, annual waste generation is expected to increase by 70% from 2016 levels to 3.40 billion tons in 2050(Kaza, Yao, Bhada-Tata, & Van Woerden, Citation2018). The sustainability in the earth without pollution has become part of the technical-economic, strategic, and managerial decision-making of producers only in recent decades. In the past, issues related to the choice of resources and energy, reduction of waste, and emissions were usually introduced by sector, following regulatory actions laid down by various national and international public bodies. The current perspective, instead, considers the reduction of the extra pollution impacts of production activities a positive factor, transforming it from a ―obligation‖ (and an additional cost) into a market opportunity and a source of efficiency. In the most recent years, special interest in environmental issues and socio-ethical values has gradually promoted the transition towards the so-called low-impact economies (Simboli, Taddeo, & Morgante, Citation2014). Deputy Head of Municipal Affairs of the Municipal Organization report (2018) was cited that a total of 58,000 tons of waste are produced daily in Iran’s cities and villages, with 75% being buried. Of this amount, only 5% are hygienically buried. Also, the typical burial of garbage in terms of leachate produces enormous damage to the environment, especially groundwater, causing damage to the environment of about 50 trillion. The latest figures on the amount of waste produced in Iran show that Iranians produce around 20 million tons of waste annually (Health News, Citation2017).
According to the World Health Organization (Citation2011), the average amount of waste produced per day in the world is 300 g, and according to statistics provided by the Ministry of the Interior, Iranians produce 700 g of waste per day. These statistics point to the fact that the high percentage of waste statistics in Iran is food. According to the FAO report (Citation2013), each day 134 kg of food is consumed per person, and 35% of agricultural production is converted into rubbish. When we waste or spill food, it’s not just the food that is being thrown away, but the hundreds of liters of water used to cultivate it, the energy that is consumed until it reaches our dish, and We also count the damages that landfill this food into our environment. The issue of fading and landfill has long been over in the world for many years, and developed countries are turning part of this waste into consumption cycles for years. World Health Organization statistics say the Germans recover 80% of their daily waste production, while in Iran more than a decade after the adoption of the waste management plan and about 60 years since the founding of the country’s first recycling plant, there is no logical statistics. According to the latest statistics, only 7% of the country’s waste is recycled. A total of 49,000 tons of household waste are produced daily in the country, many of which can be recycled. One of the problems in this direction is the lack of a proper system of primary waste separation. Separation from the source is the best way to reduce the time and cost of recycling waste; a missing issue in our country. Although there is some training for familiarizing citizens with waste separation techniques, many people are not only familiar with the right ways of separating, which sometimes do not even know what waste is or what waste can be separated and again Cycle to restore?
In addition, industries around the world are required to make their own waste, but in Iran, despite the specific rules in this area, there is no binding requirement. This has led to impose additional burdens on urban waste and environmental problems. In accordance with the law of separation of origin from the origin, it is the responsibility of urban management, but there is no successful comprehensive solution in order to be able to deal with this waste separately. This is while, the percentage of the municipal budget in some countries allocated for waste management (Japan 5%, Malaysia 70%, India 86% and Indonesia 90%). Studies show that unproductive disposal and the unhealthy waste of waste have caused only 10% of Iran’s waste to be separated from the source (Municipal Organization and Dehyaries, Citation2018). According to available scientific sources, the recycling process has been at the top of waste management plans since the waste reduction program (Lund, Citation2000). Regarding recycling, unfortunately, in developing countries, due to the lack of a comprehensive plan, lack of infrastructure, and lack of education and non-cultural, is still neglected. One of the places that have the most waste due to the high volume of fruit and vegetables and requires recyclable solutions is the fruit and berry fields. The management strategies currently being implemented in fruit and vegetable fields, based on studies, do not have the required effect and require innovative management strategies (Gheisari et al., Citation2008) .Food providers have recently come under increasing checking over their food management practices, and specifically food waste, with evidence that considerable amounts of food and fruits are thrown away during preparation, or because they cannot be stored and reused (Betz, Buchli, Göbel, & Müller, Citation2015; Hall & Gössling, Citation2013; Silvennoinen, Heikkilä, Katajajuuri, & Reinikainen, Citation2015). Waste management has thus become a key priority, referring to all the activities related to avoiding, reducing or recycling waste, throughout the production and consumption chain (Papargyropoulou et al., Citation2016). Recycling reduces pollution from waste incinerators, garbage dumps, and mines. In addition, less waste is buried and burned, and less raw material is extracted from the soil (Asadi, Citation2008).
In this paper, the importance of recycling is taken into account with regard to a large amount of waste in the fruit and berry fields, as well as management problems. Because of the reduction of the costly cost of testing the entire product for recycling, as well as the time spent on this. It is not economical to work and to evaluate the effectiveness of methods and tests. The need for innovative strategies can fill the vacuum in waste recycling in fruit and berry fields. An innovative management researcher proposes a support vector machine (SVM) in order to estimate the recycle of fields and fields in different ways using available data and select the best recycling method.
In the present study, we investigate the management of innovation in the recycling of products of staff in fruit and vegetable fields of Tehran Municipality in 2015.
The structure of this article is as follows. In the second section, the concepts of Innovation Management, Recycling, and Support Vector Machines (SVM) are presented. The measurement tool is described in the third section. Part IV describes the method of work, the problem of simulation and its results. Finally, a general conclusion is given in Section V.
2. Concepts
2.1. Innovation in recycling
Innovation is the development and successful implementation of new or improved products or quality of products, markets, services, operation procedures, production or distribution processes, which can lead to a sustainable industrial economy (Crossan & Apaydin, Citation2010). For the first time, Schumpeter, in 1934, defined the concept of innovation. He identified innovation with economic development and introduced it as a new combination of wealth-generating resources (Hadavi, Citation2009). Innovation management is an interdisciplinary science discipline, and one of the main trends of innovation science creativity is the creativity of organizational management innovation. Innovation management involves the use of knowledge when working in a limited and specific range of scholars (Hadavi, Citation2009). It is further assumed that if innovation is used to make processes smarter, a circular approach results in higher efficiency, more procurement independence and clear cost reduction for corporations (Scott, Lundgren, & Thompson, Citation2011). Recycling refers to techniques and methods in which recyclable waste materials are collected and isolated and used as raw materials for the production of new products. This option is one of the best options for dealing with solid waste, which alone cannot solve the problems of municipal solid waste management, but can prevent the entry of a major part of the materials that are being used to land the landfills (Tchobanoglous, Citation2003). According to the research, the use of innovation management techniques results in massive recycling of products. Also according to researches cited above, one of the major environmental problems is the mass production of wastes. One of the places that have the most waste due to the high volume of fruit and vegetables and requires recyclable solutions is the fruit and vegetable fields. The management strategies currently implemented in fruit and vegetable fields, based on studies, do not have the necessary effect and require innovative management solutions. One of the types of innovations in the field of waste recycling is the intelligence of this process, which can be achieved by using the capabilities of the new software. Accepting the use of intelligent tools for effective statistics and targeting can help individuals innovate creatively to educate and create an environment conducive to learning waste recycling.
2.2. Support vector machine (SVM)
A way of acquiring and representing knowledge in the field of artificial intelligence is the use of machine learning for innovative management. One of the most effective human abilities is the ability to learn. When a problem is introduced to humans in a new domain, the ability to solve the problem by this person is very small in comparison to the person in whose domain it is expert. But over time, the novice acquires an understanding of the problem with the use of the test and error and the inference power and raises his ability to solve the problem.
The proper idea is that there is a general algorithm similar to that of man, and a mechanism for learning is used along with it. In this way, the planner will be able, in dealing with any problem, to change his behavior appropriately to that problem. To do this, it is necessary to extract knowledge from the domain and, with this knowledge, part of the algorithm to be changed.
SVM is the most famous classifier method. Due to the simple idea that has been stated and its proper performance has been considered, SVM was first introduced by Vladimir Vapnik in the late 1970s and early 1980s, based on the principle of structural risk minimization (Vapnik, Citation2000). Furthermore, this method is also used in environmental classifications and in particular in wet waste (Abbasi, Abduli, Omidvar, & Baghvand, Citation2013; Babapour Mofrad, Aghaeizadeh Zoroofi, Abbaspour Tehrani Fard, Akhlaghpoor, & Sato, Citation2014; El-Bendary, El-Hariri, Hassanien, & Badr, Citation2015; Lai, Leung, & Leung, Citation2018; Noori, Abdoli, Ameri Ghasrodashti, & Jalili Ghazizade, Citation2009). This paper attempts to use it to manage fruit and vegetable waste and classify methods.
The VC dimension is a property of a set of functions {f (α)}. Since in most cases, for each input data, its classification is considered to be one of the two classes. Each input x can take a + 1 or −1 tag as a function of one of the classes.
For L, the input vector of the possible state sets of the L2 tagging mode will be (in double-mode mode). Now, if for all such a possible tagging of the samples and for each tagging, one can find a member of the set {f (α)} to correctly categorize, we say that the set of points was split by this set of functions. The maximum number of training points that can be split by the set {f (α)}, then VC is the set of functions.
One of the most common methods for separation points in n-dimensional space is the drawing of a directed hyperplane in Rn. Such that the points on the side of the hyperplane with the +1 tag and the points on the other side have a − 1 tag (Figure ).
Figure 1. Example of linear classification
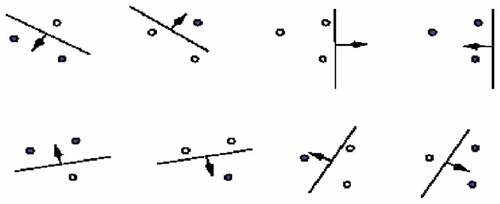
The VC dimension then gives a good idea of the capacity of a given function set. In some cases, it is impossible to do isolation work with a super-page, that is, at least h points, and not necessarily any h-point sets that can be considered for the following example (Figure ):
Figure 2. Example of multi-hyperplane classification
As can be seen, the three points above cannot be disassembled by the selected set, that is, the lines of the direction (Figure ).
Figure 3. Example of marginal hyperplane classification
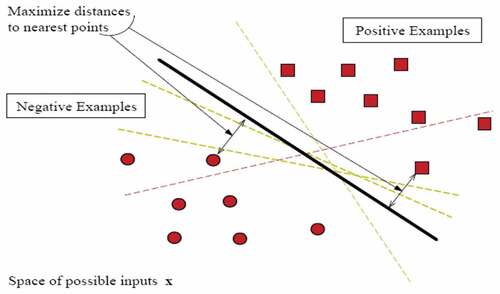
Vepnick et al. provided an algorithm for constructing splitters of empirical data. This algorithm is proposed for separation problems, and it is based on the fact that, among all the separating super-page, there is a unique super-page that provides the largest margin of separation from the classes (decreases with increasing capacity margin).
3. Method and material
The research, in terms of purpose, is applied research which means that the results of this research are used to grow and improve the practice of fruit and vegetable waste recycling. Variables are semi-experimental semi-empirical. The method of this research is quantitative and descriptive correlational.
3.1. Community, sample and sampling method
The statistical population of the study consisted of the total staff of fruit and vegetable squads in Tehran’s municipality in 2015 that is 294 persons.
Because the community size and community variance are not available, the following formula was used to estimate the sample size.
The questionnaire with a 5-point Likert scale is used, the largest value is 5 and the smallest value is 1, so the standard deviation is equal to 0.65. This maximum value is the standard deviation (Momeni, Citation2008). The confidence level is 95% and the accuracy of the estimate is 0.01. Therefore, the sample size is equal to:
Zα/2 = 1.96, ε = 0.01, σ = 0.66 => n = 170
In this research, a proportional stratified sampling method was used. The percentage of fruit and berry squares in the 22 areas of Tehran was obtained. Then, areas 1 to 11 and 12 to 22 were grouped into one class. We select the required number and proportion to the population of each class of sample people.
170 × 0. 57 = 97 Number of specimens from among the staff of fruit and berry squares in zone 1 to 11 of Tehran
170 × 0. 43 = 73 Number of sample people from among the staff of fruit and berry squares in Tehran’s 11th to 22nd areas.
3.2. Variables and implementation method
Control variable (manipulative): Innovation management.
Measurable variable (observable): Recycling of products.
In this paper, a questionnaire has been used to collect information. The selected staff were asked to respond to the honest questionnaire for research (Group 1). Considering the title of article and the importance of recycling category, the application of artificial intelligence method to determine the results instead of paper consumption and cutting of trees as a new method in the questionnaire section has also been used.
A researcher-made standard questionnaire is the attitude toward waste recycling and recycling behavior. In this research, a scale of 15 researcher-made scales was used to measure these variables. Attitudes toward recycling are defined as positive or negative feelings about a person, object, or issue. Attitudes towards recycling are closely related to beliefs, which refer to the individual’s information about recycle.
The behavior of environmental behaviors is a set of actions of the community of people towards the environment that embraces a wide range of emotions, tendencies and specific readiness for behavior towards the environment (Salehi, KHoshfar, & Hemmati, Citation2013). Tow variables “Attitudes towards waste recycling” and “Recycling Behavior” were asked in questionnaire, respectively, by 10 and 5 number of indicator in 5 score (complete disagree = 1, disagree = 2, no response = 3, agreed = 4 and completely agreed = 5). Analysis and interpretation of results are based on the score of the questionnaire.
3.3. Validity of questionnaire
Validity relates to the question of how much measuring instrument measures what we think (Sarmad, Baazargan, & Hejaazi., Citation2012). In Akbari et al ’s research (Citation2013), a number of professors and experts on the content of the questionnaire were asked to assess the validity (content) of the questionnaire and, by applying his proposed changes, confirmed his opinion that the instrument was valid.
3.4. Reliability of questionnaire
The reliability of a tool is its degree of stability in measuring what is measured, which is, the measure of the same conditions in the same conditions yields the same results (Sarmad et al., Citation2012). In order to measure the reliability of each dimension of this questionnaire, Cronbach’s alpha method has been used. Each dimension of the questionnaire has a high reliability. Alpha coefficient of Attitudes towards recycling = 0.671 and Alpha coefficient of Recycling behavior = 0.470.
4. Data analysis method
After completing the questionnaires by the employees of the fruit and vegetable fields, the questionnaires were scored. To describe the statistical data from the frequency charting, plotting and calculating the mid-and mid-range statistical indicators and calculating the scattering indices, for data analysis, regression and correlation were used in SPSS software environment is used. Then, these results are presented in the MATLAB software environment using the Libsvm toolkit of trained support engineers and the final results of the research (Babapour Mofrad, Citation2014).
In the first step, using the data taken, the support machine is taught using LIBSVM software in MATLAB (R2018) environment with part of the questionnaires (pairwise questionnaires). Based on this training, the data for other questionnaires (individual questionnaires) are taken separately using different kernels and adjusting the corresponding core parameters based on the grid search method and manual search method. Then, the results of the support machine are compared with the results of the questionnaires.
In the second step, using a recyclable article, an optimal table based on the type of fruit, the method of recycling is provided. The best method is chosen using a support vector machine (SVM). The best method was selected, and then the selected staffs were again asked to respond to the honest questionnaire for research (Group 2). These questionnaires are estimated to be the same as in the first group using a support vector machine. The results of group 1 and 2 questionnaire were compared by SPSS software version 20.
4.1. Descriptive findings of the first stage
Table . The central indices (mean, mean, fashion, sum) and dispersion indices (standard error, variance, range, minimum, maximum, mean standard error) and distribution indices (tilt and stretch) data the first stage shows the participants in the present study.
Table 1. Descriptive data (central, dispersal, distribution indices)
In Figure , the bar graph of the distribution of the frequency of the first-stage scores is shown. The frequency, percentage, and percentage of dispersion of participants’ scores in the first stage are presented in Table .
Figure 4. The bar graph of distribution frequency of first stage scores
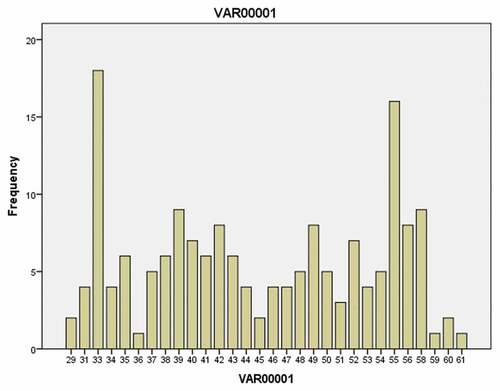
Table 2. The first-stage scores statistic sample characteristics
Then, using the data collected from the completed questionnaires, the support machine is taught using the LIBSVM toolkit in the MATLAB software environment (Wen et al., Citation2018). Accordingly, the data for individual questionnaire results (from 1 to 170 with 2 steps) are taught separately using different kernels. Finally, for coupled questionnaires (from 2 Up to 170 with 2 steps) are estimated. Finally, the results of estimating the support machine questionnaire with the results of completed questionnaires are compared to determine the accuracy of the support vector machine estimator.
For kernels, there are parameters that are not directly learned by estimates and can be adjusted by search for parameter space to find the best cross-reference. In order to find such parameters, you can use manual search, grid search, and other commonly used methods.
In fact, the method of standard optimization of super parameters, which is simply a comprehensive search through a specific subset of the supersymmetric space of the learning algorithm, is the grid search method. The grid search algorithm should be taught by some standard functions, usually by cross-checking the value of the data set or evaluating the extended validation set. Since the machine learning parameter space may be for certain parameters including real-value spaces and unlimited spaces, the setting of the limits and the discrepancy may be required before the grid search is performed.
For example, a typical soft-edge SVM classifier that is equipped with an RBF core has at least two super parameters, which is required to function properly on unseen data (fixed regulator C and core super parameter). Then, he traverses the SVM grid search for each pair (C, γ) at the point multiplication of these two sets and evaluates its function on the extended validation set (or by cross-validation on the trained set). Finally, the grid search algorithm reflects the outputs of the settings for the highest rating of the validation method.
In grid search method in parallel and high performance is problematic due to the fact that the parameters of the evaluated super parameters are independent of each other (Hsu et al., Citation2016). Since this method is a comprehensive and cost-effective method, the random search method that is more effective for high-dimensional spaces replaces it.
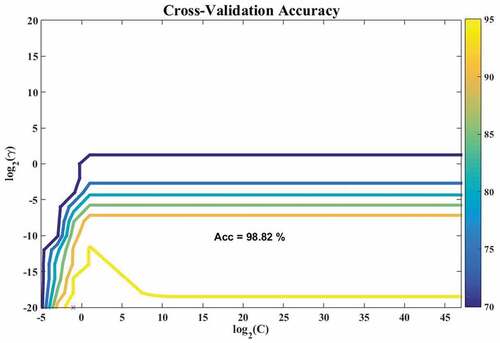
The grid search method was used to determine the parameters (C, γ) of the RBF core and random search method for other kernels. Figure shows the accuracy of the parameters (C, γ) of the RBF core by the grid search method.
Figure 5. The precision of determination parameters (C, γ) the RBF kernel by grid search method
In order to evaluate the accuracy of the simulation support simulation results, the questionnaire that has not been evaluated before has been evaluated. The results of the estimation of support vector machine based on the training for each questionnaire are taken separately using different kernels and adjusting the corresponding core parameters based on the grid search method and manual search method. Then, according to Table , the results of the support machine are compared with the results of the completed questionnaires.
Table 3. Comparison of kernel’s SVM accuracy based on the education delivered with the real results extracted from questionnaires
According to the data taken for the couple (C, γ), the grid search method, as shown in Tables and , shows the accuracy of the support vector machine for the Gaussian core (RBF) 98.8325% and for linear and polynomials, it is 100%. This indicates that with this tutorial, the support machine, without completing the time-consuming questionnaires, was able to accurately determine the results of the questionnaire under study. This means that, regardless of the results of the questionnaires completed by the employees (coupled), and only considering the results of the staff questionnaire (Fred), the support machine has been able to achieve the same results with the same coupled questionnaires. if the accuracy of the estimation is high, then this method can be considered as a very suitable alternative for completing the questionnaires of time.
Table 4. Exhibition of proposed method in improved recycling according to base estimate for SVM for crops
This speeds up the evaluation of questionnaires and, as a result, analysts can be informed in the least time and with high precision of the results of the recycling questionnaire and take the necessary measures.
Based on different kernels, a support car vector has been able to estimate a limited statistical society with a high degree of categorization of the recycling questionnaire. Therefore, this method can work efficiently in the shortest time and with high precision of classification for similar activities and high statistical society.
4.2. The best method is using a support vector machine(SVM)
At this stage, the supporting vector machine is trained based on the type of product and the provided recycling methods for that product. Finally, the results of retrieval based on the reviewed literature estimated the best recycling method for each product based on the training mentioned (Table ).
Several innovative methods have been proposed for the recycling of products, but the correct management that can provide the best approach with regard to the type of initial investment, the duration of the project, the return on the method of recycling, and so on. In fact, companies and institutions are only seeking to provide a new way of recycling products regardless of its optimal nature.
Recycling methods generally fall into three categories: energy recovery, mechanical recycling and chemical recovery. In the recycling of energy, waste is burned as a fuel. Mechanical recycling means crushing and using a product to make a new piece. In chemical recycling, the waste is converted by chemical methods into other materials (mostly raw or intermediate materials). This method is not economically viable in two other ways (Table ).
Table 5. Recycling methods
By using books, articles and works that have already been done in Iran and other countries in the field of recycling, different methods of product recycling with regard to the initial investment indices of the project, the duration of the project implementation, the type of product. The volume of the product required for recycling, the future horizons of the design, the final returns of the design, and … were used to support the support of the carriers. At this stage, the supporting machine was presented with a view to evaluation and training indicators, a method for recycling energy and turning waste into electricity as a renewable energy.
In most countries, waste is a source of energy, and garbage collected in specially designed ovens to move the turbine gas to generate electricity.
In Iran, due to the huge amount of waste as well as the ending of the sources of underground energy production (fossil fuels, oil, etc.), the move towards renewable energy and the production of electricity from recyclable materials has pushed. The Ministry of Energy also has incentives for renewable electricity generation. Therefore, with the proposed recycling method, the recycling machine, and the conversion of energy into the production of electricity, can illuminate the lights of some homes. Thus, the use of waste as a dirty gold is one of the most important development indicators.
Finally, the result of this work and the goals of recycling (such as improved storage, collection and recovery of waste, purification of dry waste (Synthetic materials) to optimally recycle and recycle such materials into the production cycle, prevent national capital loss and help the country's macroeconomic environment, minimize waste disposal and disposal in the future, improve the quality of urban services, protect the environment and prevent From the production and dissemination of contaminants and the promotion of the level of general culture in dealing with waste) was explained to the Fruit and Vegetable Field Organization employees who completed the questionnaires in the first step. The same questionnaires were again completed with a new view of staff. .
4.3. Second-stage descriptive findings
In Table , the central indices (mean, mean, fashion, sum) and dispersion indices (standard error, variance, range, minimum, maximum, mean standard error) and distribution indices (tilt and stretch) data, the second phase (after implementation of the technology management) is based on the respondents’ response to the questionnaire.
Table 6. Descriptive data of second step (central, dispersion, distribution)
In Figure , the bar graph of the frequency distribution of the second-stage scores is shown. The frequency, percentage, and percentage of dispersion of the participants’ scores in the second phase are presented in Table .
Figure 6. Bar graph of abundance distribution in the second step
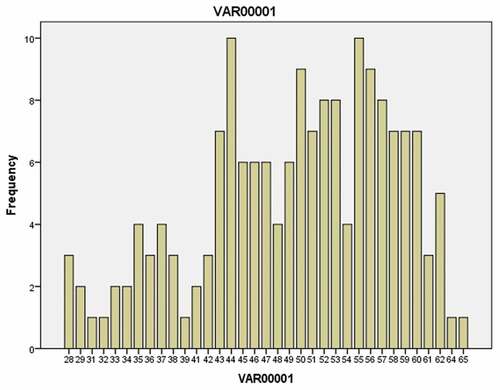
Table 7. Frequency, percentage, and percentage of dispersion of the participants’ scores in the second phase
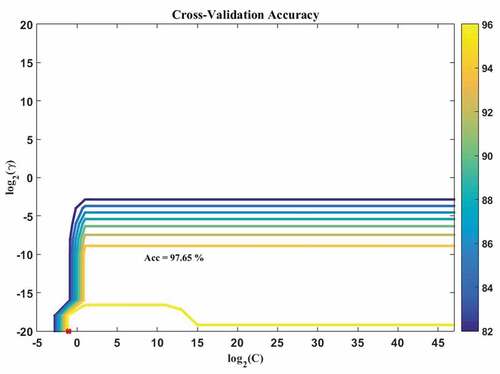
The grid search method was used to determine the parameters (C, γ) of the RBF kernel and random search method for other kernels. Figure shows the accuracy of determining the parameters (C, γ) of the RBF kernel by the grid search method.
Figure 7. Precision determining the (C, γ) parameters of RBF kernel by grid search method
To perform two-class (binary) classification, the questionnaires were divided into two classes(odd samples as training class and even samples as a test class). According to the previous explanation we have totally of 170 training samples and 170 test samples. For the second series of questionnaires, the same as the first step, odd questionnaires were used to training the SVM. The even questionnaires were estimated by using a supporting vector machine, the results of which were presented in Table . Is based on the results of Table , it was found that the supporting machine has been able to accurately estimate the results of the questionnaires, which can be a substitute for the completion of time-based questionnaires.
Table 8. Comparison of kernel’s SVM accuracy based on the education delivered with the real results extracted from questionnaires
Given the data taken for the even (C, γ), the grid search method, as shown in Table , the accuracy of the support vector machine for the Gaussian kernel (RBF) 98.83% and for the linear kernel of 96.47 % And polynomials is 98.83%. The result indicates that using SVM without completing the time-consuming questionnaires was able to accurately determine the results of the questionnaire under study. This means that, regardless of the results of the questionnaires completed by the employees (even), and only considering the results of the staff questionnaire (odd), the support machine has been able to achieve the same results with the same even questionnaires. Brought up if the accuracy of the estimation is high, then this method can be considered as a very suitable alternative for completing the questionnaires of time.
Based on different kernels, a support vector machine has been able to estimate a limited statistical population with a high degree of categorization of the recycling questionnaire. Therefore, this method can work efficiently in the shortest time and with high precision of classification for similar activities and high statistical population.
4.4. Correlation between two-stage data
To correlate the data, correlation t-test and SPSS software were used. The results are shown in Table . Based on the results in the Table (sig <0/05), there is a significant difference between the first stage data (before the use of innovation management) and the second stage data (after using the innovation management). As a result, innovation management (a selective approach by a support machine) in this research has created a significant difference in employee insight and vision. This work can play a significant role in economic development and reducing the country’s environmental pollution. Based on these results, it is clear that the proposed method of the previous stage of the support machine has been able to influence the employees’ perspective and change their view on the issue of recycling.
Table 9. Correlation
5. Conclusion
In this study, the supervised binary classification was used for providing the best method of vegetables and fruits recycling. The purpose method is suitable for selecting the best vegetable and fruits recycling method based on the learning method. As a result, an SVM can be used to manage innovative crops recycling furthermore Innovation management affects the recycling of products. The results of this research showed that according to the results of innovation management, different aspects of crops recycle (including: estimation of the best recycling method, product recycling plans, determination of the results of the questionnaire) will be affected.
This finding is based on the results of the research Zakypor Malekabadi et al., (2010), Gheisari et al., (2008Citation2008), Naghavi and Farzi Deri (2007Citation2007), Tenscannon (2000).
According to SPSS results, there is a significant relationship between innovation management indicators and crop recycling. The results of this study showed that according to Tables – (sig <0.05), the choice method by SVM has a significant difference in employee insight and vision. So there is a significant relationship between purpose method and crop recycling.
The results of this study showed that based on the results of Tables and , a support machine with an accuracy of 90% to 100% after the training was received without completing the questionnaires of the time of the results of the questionnaire under study to determine correctly. As a result, SVM has been a Powerful and robust classifier for the waste recycler. For future works, it is suggested the use of other learning methods for classification innovation management.
The results of this study showed that based on the results of Tables and , a support machine with an accuracy of 90% to 100% after the training was received without completing the questionnaires of the time of the results of the questionnaire under study to determine correctly. As a result, SVM has been a Powerful and robust classifier for the waste recycler. For future works, it is suggested the use of other learning methods for classification innovation management.
Acknowledgements
Thanks to Dr Farshid Babapour Mofrad members of the project group who provided links into the community and critical comment on results. Thanks to anonymous reviewers for helpful comments on an earlier version of this paper.
Additional information
Funding
Notes on contributors
Sahar Dehyouri
Sahar Dehyouri was born on the 31th of May 1979 in Ahwaz, Iran. She completed her BA degree in agricultural extension and education at the University of Tehran in 2004 and a Master’s degree in the same major in science and research branch of Islamic Azad University in 2007. Dehyouri completed her PhD at the same major and same university in 2011. She has been working as an assistance professor at the Islamshahr branch of Islamic Azad University, Department of agriculture. Some of the courses he teaches include agricultural and environmental management, agricultural Data and Analysis, micro & macroeconomic in agriculture, Environmental economic, dynamic systems & etc … . Dehyouri has published more than thirty peer-reviewed articles, four book, and other research activities. She is interested in new challenges of environment to improve humane welfare and better mutual relationship between human and environment.
References
- Abbasi, M., Abduli, M. A, Omidvar, B., & Baghvand, A. (2013). Forecasting municipal solid waste generation by hybrid support vector machine and partial least square model. International Journal of Environmental Research, 7(1), 27–38. doi: 10.22059/IJER.2012.583
- Abdoli., M. A. (2011). The urban solid wastes management system and controlling methods, Tehran Municipality, the recycle and recovering of waste material. ( In Farsi).
- Akbari, M., Shakiba, H., Ziaee, M. S., Marzban, S. H. M., & Razi, S. (2013). Relation between organizational health and organizational entrepreneurship: The case of university of Tehran. Journal of Public Administration, 5(13), 1–20. doi: 10.22059/JIPA.2013.35545
- Asadi, G., 2008, Municipal solid waste, monthly infrastructures engineering, No.4, Tehran. ( In Farsi)
- Babapour Mofrad, F., Aghaeizadeh Zoroofi, R., Abbaspour Tehrani Fard, A., Akhlaghpoor, S., & Sato, Y. (2014, May). Classification of normal and diseased liver shapes based on spherical harmonics coefficients. Journal of Medical Systems, 38, 20. doi:10.1007/s10916-014-0020-6
- Betz, A., Buchli, J., Göbel, C., & Müller, C. (2015). Food waste in the Swiss food service industry– Magnitude and potential for reduction. Waste Management, 35, 218–20. doi:10.1016/j.wasman.2014.09.015
- Crossan, M. M., & Apaydin, M. (2010). A multi‐dimensional framework of organizational innovation: A systematic review of the literature. Journal of Management Studies, 47(6), 1154–1191. doi:10.1111/j.1467-6486.2009.00880.x
- El-Bendary, N., El-Hariri, E., Hassanien, A. E., & Badr, A. (2015, March). Using machine learning techniques for evaluating tomato ripeness. Expert Systems with Applications, 42(4), 1892–1905. https://doi.org/10.1016/j.eswa.2014.09.057
- Food and Agriculture Organization. (2013). Food wastage footprint: Impacts on natural resources. Fao press.
- Gheisari., S., Danesh, S., Mosavi, M., & Torghabeh, J. (2008). Investigation of the potential use of vegetable waste for the production of vermicomposting, The fourth national congress of waste management. ( In Farsi).
- Hadavi, A. (2009, April). Innovation management instruments: A review on the thesis and achievement. Tadbir, No.204. ( In Farsi).
- Hall, C. M., & Gössling, S. (2013). Sustainable culinary systems: Local foods, innovation, and tourism & hospitality. London: Routledge.
- Health News. (2017). Findings from the national survey of the Iran's waste production is three times the global standard (Report no. 209850). Retrieved from http://www.salamatnews.com/news/209850/
- Hsu, Ch. W., Chang, Ch. Ch., Lin, & Ch. J. (2016). A practical guide to support vector classification. Taiwan: National Taiwan University. Retrieved from http://www.csie.ntu.edu.tw/~cjlin
- Kaza, S., Yao, L. C., Bhada-Tata, P., & Van Woerden, F. (2018). What a Waste 2.0: A global snapshot of solid waste management to 2050. Washington, DC: World Bank, Urban Development. © World Bank. https://openknowledge.worldbank.org/handle/10986/30317 License: CC BY 3.0 IGO
- Lai, S., Leung, K. S., & Leung (2018). A support-vector-machine-based method for detecting semantic difference using taxonomy and word embedding features. Proceedings of the 12th International Workshop on Semantic Evaluation (SemEval-2018), 741–746. New Orleans, Louisiana, June 5–6,2018. ©2018 Association for Computational Linguistics.
- Lund, H. (2000). Recycling, handbook. Mc graam – hill inc.
- Momeni, M. (2008). New issues in operations research (5th ed). Tehran: Agah Publishing Institute.
- Municipal Organization and Dehyaries. (2018). Findings from the national survey of emphasizes the use of Japan's waste management technologies in Iran. Retrieved from http://imo.org.ir/RContent/1TILF3-.aspx
- Naghavi, R., & Farzi-Deiry., A. (1998). Investigation on dry waste management in Tehran. third national congress on waste management, Tehran. ( In Farsi).
- Naghavi, R., & Farzi-Deiry, A. 2007. Investigation on dry waste management in Tehran, third national congress on waste management, Tehran. (In Farsi)
- Noori, R., Abdoli, M. A., Ameri Ghasrodashti, A., & Jalili Ghazizade, M. (2009, July). Prediction of municipal solid waste generation with combination of support vector machine and principal component analysis: A case study of Mashhad. Environmental Progress and Sustainable Energy, 28(2), 249–258. doi:10.1002/ep.10317
- Papargyropoulou, E., Wright, N., Lozano, R., Steinberger, J., Padfield, R., & Ujang, Z. (2016). Conceptual framework for the study of food waste generation and prevention in the hospitality sector. Waste Management, 49, 326–336. doi:10.1016/j.wasman.2016.01.017
- Salehi, S., KHoshfar, G. H., & Hemmati, Z. (2013). Investigating women's attitudes towards recycling household waste in Mazandaran. Proceedings of 2nd Conference on Environmental Planning and Management, Iran, Tehran.
- Sarmad, Z., Baazargan, A., & Hejaazi., A. (2012). The research methods in behavioral sciences (24th ed.). Tehran.
- Scott, C., Lundgren, H., & Thompson, P. (2011). Guide to Supply Chain Management. Berlin Heidelberg: Springer.
- Silvennoinen, K., Heikkilä, L., Katajajuuri, J. M., & Reinikainen, A. (2015). Food waste volume and origin: Case studies in the Finnish food service sector. Waste Management, 46, 140–145. doi:10.1016/j.wasman.2015.09.010
- Simboli, A., Taddeo, R., & Morgante, A. (2014). Value and wastes in manufacturing. An overview and a new perspective based on eco-efficiency. Administrative sciences. Administrative Sciences, 4, 173–191. doi:10.3390/admsci4030173
- Tanskanen, J. (2000). Strategic planning of municipal solid waste management. Journal of Conservation and Recycling, 3.
- Tchobanoglous, G. (2003). Solid waste management. In Joseph, A. S., N. L. Nemerow, & F. J. Agardy (Eds.), Environmental engineering (5th ed.). Hoboken, NJ: John Wiley & Sons, Inc. ISBN 0-471-41813-7.
- Vapnik, V. (2000). the nature of statistical learning theory. Springer-Verlag New York. doi:10.1007/978-1-4757-3264-1
- Wen, Z., Shi, J., Li, Q., He, B., & Chen, J. (2018). ThunderSVM: A fast svm library on GPUs and CPUs. Journal of Machine Learning Research, 19, 1–5.
- World Health Organization. (2011). World report on disability. Switzerland: Author.
- Zaki Pour-malek Aabadi., A., Isfahani., Z., & Abbasi., S. (2010). The formulation of fruit leather extracted from Kiwi fruit. The Science and Food Iranian Industrial Investigation Newspaper. 6(4), winter, In Farsi.