
 ?Mathematical formulae have been encoded as MathML and are displayed in this HTML version using MathJax in order to improve their display. Uncheck the box to turn MathJax off. This feature requires Javascript. Click on a formula to zoom.
Abstract
It is well documented that urban runoff and roadside soils can become contaminated with particulate deposits, especially heavy metals, sourced from vehicles. However, phosphorous from vehicular sources has been given little consideration as a possible roadside contaminant. This paper examines the potential contamination of surface water (via runoff to storm drains and discharge to waterbodies) and groundwater (via roadside soil infiltration) by the phosphorous deposited onto pavement and road shoulders in the city of Waterloo, Ontario, Canada. Total and soluble reactive phosphorous concentrations in roadside soil and runoff samples were determined for two study sites. Subsequently, the results were statistically analyzed. Following comparison to other sources of urban runoff, it was concluded that roadways are a significant source of phosphorous in urban runoff, with high potential to impact surface water. Conversely, results of this work indicate that vehicular-sourced phosphorous does not pose a significant threat to groundwater.
PUBLIC INTEREST STATEMENT
Phosphorous is an environmental contaminant which, when present in excess amounts in water, can make it unsafe to drink and harmful to aquatic life. Phosphorous accumulates in ground and surface water from sources such as agricultural fertilizers and septic beds. Since phosphorous is proven to be a powerful and persistent contaminant, it is important to understand which sources contribute the most phosphorous to the environment. The current study hypothesised that vehicular emission deposits on roadways are also an important source of phosphorous in the environment. This study investigated the degree to which phosphorous accumulates in road runoff and roadside soils in the city of Waterloo, Ontario (near Toronto, Ontario). It was concluded that while phosphorous present in roadside soils was not significantly different from background patterns, phosphorous in road runoff is significant and has strong potential to contribute to the eutrophication of surface waterbodies.
1. Introduction
Despite its importance to the natural environment, phosphorus remains a source of constant environmental concern. Though restrictions on phosphorus use in detergents and cleaning products were implemented in the 1970s, and stricter regulation of agricultural phosphorus application and wastewater effluent has been enforced in many countries, toxic algae blooms continue to contaminate surface waterbodies. Well-documented examples of phosphorous-induced eutrophication can be observed in Canada’s Great Lakes, particularly in Lake Erie (Wilson et al., Citation2018; Xu et al., Citation2018). Possible sources of excess phosphorus in the environment have been extensively researched and regulated. These sources include wastewater treatment plants (Dolan & McGunagle, Citation2005), agriculture non-point sources (Seitzinger et al., Citation2005), septic bed leachate (Zanini et al., Citation1998) and atmospheric loading (Dolan & McGunagle, Citation2005). A potential source that has not been given consideration for its effect on water resources is the phosphorous released from vehicular emissions. During the 1920s, phosphorus compounds began being added to gasoline and motor oils (Totten, Citation2003). Specifically, tricresyl phosphate and phosphate esters are added to prevent engine pre-ignition (Brooke et al., Citation2009). Although high phosphorus levels may damage vehicle emission systems, phosphorous compounds remain an additive in low concentrations. Gasoline manufacturers do not typically disclose the exact proportions of additives in gasoline; however, soluble phosphorous can enhance the potential eutrophication of waterbodies even in very small concentrations (e.g., the Ireland. Environmental Protection Agency (Citation2005) recognizes the eutrophication limit to be 0.03 mg/L).
The Ireland Environmental Protection Agency recognizes the limit of phosphorous (as orthophosphate, the soluble reactive form of phosphorous) in drinking water to be 5 mg/L (Ireland Environmental Protection Agency, Citation2005); therefore, municipal wells cannot have orthophosphate concentrations which exceed this limit. Currently, Ontario does not have a maximum allowable orthophosphate concentration for drinking water. Certainly, given its higher limit (5 mg/L compared to the surface water eutrophication limit of 0.03 mg/L) and lower mobility in groundwater, phosphorous is less of a risk to municipal wells than it is to surface water. Phosphorous mobility in groundwater is affected by several soil properties; it is most mobile in soils with low metal oxide and clay content, low pH, low dissolved oxygen content, or where there is a shallow water table and high initial saturation of phosphorous in the soil profile (Domagalski & Johnson, Citation2011; Robinson, Citation2015; Roy & Malenica, Citation2013). Where soil conditions are not favourable for phosphorous mobility (for example, in soils with high pH and high metal oxide content), a greater proportion of phosphorous will be attenuated by the soil matrix. Despite the specific conditions required for phosphorous mobility in groundwater, several studies document groundwater wells which have had phosphorous concentrations in excess of 5 mg/L (e.g., Qian et al., Citation2011; Rao & Prasad, Citation1997; Rasiah et al., Citation2011). Roy and Malenica (Citation2013) compiled groundwater phosphate concentration data from 17 different studies and found that phosphate concentrations in excess of background patterns (and in several cases exceeding or approaching 5 mg/L) can be attributed to septic bed leachate, sewage-treated fields, agricultural fertilizer, manure application to cropland, and geologic controls. As such, if phosphorous loading to soil from a certain source is found to be significant, its potential impact on local shallow groundwater resources is feasible. Mobile phosphate (phosphate which can be transported by groundwater and which cannot be attenuated by soil), as aforementioned, has the potential to contaminate municipal wells, but it can also reach surface waterbodies which rely on groundwater to maintain baseflow (Holman et al., Citation2008; Robinson, Citation2015).
It was hypothesized in this work that phosphorous from vehicular emissions has the potential to contaminate both surface waterbodies and groundwater through two mechanisms: First, once deposited onto a roadway, particulate phosphorous is expected to be incorporated into road runoff where it would then be channeled to storm water drains and discharged into surface water. Second, phosphorous deposited onto a roadway is expected to infiltrate roadside soils in the event that water and/or snow from the road is splashed onto the roadside by vehicular movement, or when particulate matter from the road is directly deposited on the soil surface. Both of these concepts are well demonstrated by heavy metals (described in detail in the following paragraph), which can be deposited on roadways through metal corrosion, braking, tire wear, and exhaust. The latter of these two concepts (infiltration of phosphate in soil near the roadside) have been demonstrated in the recent works of Fabiańska et al. (Citation2019) and Cui et al. (Citation2017). These studies reported highly variable concentrations of organophosphate in roadside soil samples, indicating that the distribution of phosphorous in roadside soils is dependent on soil properties, traffic volume, and vehicle idling. As in these previous works, the current study aims to measure phosphorous concentration profiles in roadside soils, but additionally, attempts to draw conclusions regarding the risk of phosphorous contamination in municipal groundwater supplies. Several other studies (e.g., Dallmann et al. (Citation2014); He (Citation2019)) demonstrate that organophosphate esters are measurable and significant in vehicle emissions and road dust, supporting the finding that, despite popular belief, phosphates remain a problematic pollutant in vehicle emissions. Thus, their ability to be mobilized and transported in ground and surface water should be given serious consideration.
Many studies concerning the deposition of heavy metals near roadsides have been completed (e.g., Kuoppamaki et al., Citation2014; Ward et al., Citation1977; Werkenthin et al., Citation2014). Metals were originally of concern due to lead additives in gasoline, and although lead has not been an additive to commercial gasoline in Canada since the 1990s (Environment Canada, Citation2009), other heavy metals are still present in vehicular emissions. Furthermore, metals can also be deposited though brake and tire wear. Past studies have focused on a wide range of metals including cadmium, copper, lead, nickel, antimony, and zinc (Werkenthin et al., Citation2014). A compilation of studies done in Europe showed that the concentration of all of these metals decreased with increasing distance from roadways, and with increasing depth (Werkenthin et al., Citation2014). Furthermore, Ward et al. (Citation1977) concluded that roadside metal concentrations increase with increasing traffic densities.
Metals have also been shown to accumulate in runoff from roadways which may be channeled via curbs directly to storm sewers or may migrate directly to the roadside when curbs are not present. Pereira et al. (Citation2007) found higher concentrations of iron, manganese, zinc, copper, lead, chromium, and nickel in roadside sediments when compared to similar sediment at a non-roadside location. These higher concentrations were attributed to runoff. Other works have found that road dust in urban areas can be contaminated with heavy metals (e.g., Apeagyei et al., Citation2011; Duong & Lee, Citation2011; Świetlik et al., Citation2013). Such contamination is strongly associated with traffic volume such that higher traffic areas are typically more contaminated (Duong & Lee, Citation2011). Road dust is transported via runoff during rain events, and therefore, contaminated road dust is readily channeled into storm sewers or roadside sediments (Zanders, Citation2005). It is expected that particulate phosphorous can be transported in the same manner.
As aforementioned, the risk of soil and water contamination from vehicular phosphorous deposition is unknown. Given that phosphorous is a particularly problematic environmental contaminant, vehicular emissions as a source of phosphorous warrant further consideration. The objective of the work described in this paper was to determine whether or not phosphorous from vehicular emissions presents a significant risk to surface waterbodies (via runoff) and/or groundwater (via infiltration to roadside soils). The results of this work were compared to phosphorous concentrations from runoff samples measured in previous studies and to background phosphorous soil profiles.
2. Study site
The field investigations conducted during the course of this study were performed along the shoulders of two different types of urban roads in the city of Waterloo, Ontario, Canada, as shown in Figure . The first site, illustrated in Figure ), is situated along Columbia St. W (Col), a busy, four-lane thoroughfare. The second is located within the University of Waterloo campus and is the central vehicular corridor that surrounds the main campus buildings. It is referred to as the Ring Road (RR) and is shown in Figure ). The shoulder areas that are the focus of the field studies at each site are similar in that they are both maintained open grass fields that slope gently away from the roads. Both sites also contain curbs such that runoff is channeled directly to storm drains which are discharged, untreated, into the Grand River, which runs through the Waterloo area. The RR site also hosts several medium-sized trees along the edge of the sidewalk. Soils range from gravelly fine sand to fairly compact clay. Although groundwater levels were not directly measured at the two sites, it can be inferred that the water table is fairly close to the surface, as both sites are located close to waterbodies (a small lake at the far end of the Col site, and a stream at the edge of the RR site).
Figure 1. Study sites used for sample data collection in Waterloo, ON: Columbia Street (Col) and Ring Road (RR).
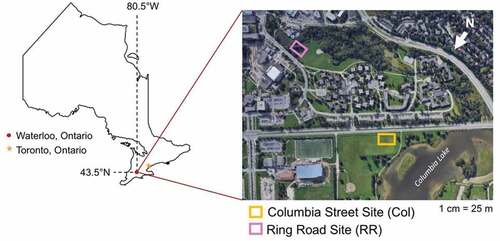
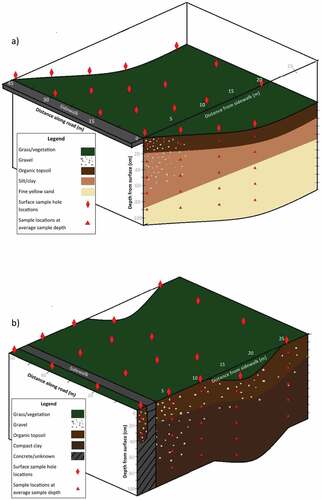
Figure 2. Cross sections for the Columbia (Col) study site (a) and the Ring Road (RR) study site (b).
The Col site is a fairly high traffic road, with an average annual daily traffic count of 26,183 vehicles (City of Waterloo, Citation2018). It has a speed limit of 60 km/h, two lanes in each direction, and a local public transit bus stop at one end of the study area. There is a lightly used sidewalk along the curb at this site and an approximately 1.5 m road verge between the sidewalk and the road. The RR site is also a high traffic area, although it is a lower speed route with a limit of 40 km/h. This site is an area of high pedestrian traffic resulting in frequent vehicle idling at crosswalks. Directly adjacent to the roadway, there is a heavily used sidewalk. Although there are no available traffic counts for RR, the daily traffic count is expected to be less than that of the Col site.
3. Methods
3.1. Soil core samples
Soil samples were collected from the roadside as progressively deeper core sections taken along a series of transects oriented perpendicular to the road. Coring locations were situated along 4 parallel transects at each site and positioned at 0 m, 5 m, 10 m, 15 m, and 25 m from the curb (at the Col site) or sidewalk edge (at the RR site) as shown in Figure . The transects were spaced between 10 and 20 m apart at each study site. The core samples collected from correlating depths and distances from the road along the four transects were combined to form a composite sample for analysis purposes. At the Col site, the 0 m sample was taken directly beside the curb; however, the 0 m sample at the RR site was taken from the edge of the sidewalk, approximately 1.2 m from the curb.
Sampling was completed using a 2 cm diameter soil probe. Depth samples were taken every 20 cm from the top 1 m of soil, at 0–20 cm, 20–40 cm, 40–60 cm, and 80–100 cm. All soil samples were kept frozen until analysis. In order to investigate the potential impact of seasonal changes in road management and vehicular patterns, a sampling campaign was conducted during both the winter and summer.
3.2. Snow pack samples
Snow pack samples were collected from the curbside at both field sites during the winter sampling. This sampling was done after a period of relatively warm weather which caused the snow banks on the roadsides to become compact. These snowbanks are hypothesized to have been thoroughly exposed to vehicular emissions and particulates both from vehicle spray and ploughing. The partial melting of the snow banks formed layers of ice at street level. At the locations sampled, there was approximately 3–5 cm of compact ice on the edge of the road or on the curb next to the road. Using a shovel, 1 L samples were taken from 3 locations next to the road at each site and kept frozen until they were prepared for chemical analysis.
3.3. Runoff samples
Runoff samples were taken from both road surfaces along the curbs in late summer/early fall during a major precipitation event. The Ring Road (RR) site was sampled during August 2017 and the Columbia (Col) site was sampled during October 2017. The samples were collected following a period of approximately 1 week with no precipitation and during the first half hour of runoff to storm drains. Surface runoff samples were taken along the roadways at 3 storm drains at each site. At each of the 3 storm drains, 2 samples were collected. One was filtered on site with 0.45 μm syringe tip filters, and one was left unfiltered. These samples were kept frozen until analysis.
3.4. Total phosphorus analysis of soil samples
Total phosphorus (TP) was analyzed in soil samples using the SEDEX sequential extraction method (Ruttenberg et al., Citation2009), referred to as the Aspila method (Aspila et al., Citation1976). This is an ashing and acid extraction method which uses Mg(NO3)2 as an oxidizer during ashing and Hydrochloric acid (HCl) for acid extraction. The processed samples were analyzed using Inductively Coupled Plasma Optical Emission Spectrometry (ICP-OES). Two subsamples were tested for each sampling point to compensate for the very small mass of soil (0.1 g) used for this method. They were averaged to achieve a final concentration of TP.
3.5. Heavy metal analysis of soil samples
As soil samples were already being analyzed for phosphorous, the concentration of heavy metals was also determined for the near surface (0–20 cm) winter soil samples. Though other works have already demonstrated the risk of heavy metal contamination in roadside soils, they are considered in this work as an indicator tracer in order to demonstrate that the mechanism of roadside contaminant deposition is valid at these sites and that the method of subsurface investigation to track this type of curbside contamination is appropriate.
The soil samples were analyzed at SGS Agri-Food Laboratories in Guelph, ON, to be tested for a suite of heavy metals including copper (Cu), lead (Pb), nickel (Ni), chromium (Cr), cobalt (Co), antimony (Sb), and zinc (Zn). This analysis was done using Environmental Protection Agency (EPA) methods 3050B and 200.8 (United States Environmental Protection Agency, Citation1994, Citation1996). Acid extraction of soil samples was completed using HNO3 and H2O2 for sample digestion and Inductively Coupled Plasma Mass Spectrometry (ICP-MS).
3.6. Analysis of snow samples and runoff samples for SRP and TP
The snow pack and runoff samples were tested for soluble reactive phosphorus (SRP) and total phosphorus (TP). Snow pack samples were melted and homogenized before testing and subsamples were taken for SRP (filtered to 0.45 μm) and TP (unfiltered) at the Environmental Geochemistry Lab at the University of Waterloo using EPA method 365.1 (United States Environmental Protection Agency, Citation1993). This is a colorimetric method which reacts ammonium molybdate and antimony potassium tartrate with orthophosphate to form an antimony-phospho-molybdate complex. When reduced by ascorbic acid, this compound is intensely blue in colour, proportional to orthophosphate concentration. This blue colour allows for colorimetric measurement. SRP samples are then filtered, making the resultant soluble phosphorous fraction smaller than 0.45 μm. This remaining fraction can be dissolved by the molybdate solution. TP samples are not filtered but rather have their particulate matter digested using heat and the addition of a 2.5% persulfate solution. They are then subject to the same reaction as the SRP samples using the molybdate solution.
4. Statistical methods
Concentrations of phosphorous in the soil with depth were compared using the non-parametric Kruskal–Wallis (K-W) Test (Bluman, Citation2017):
Where
H = test statistic
N = number of ranks
R = sum of ranks
n = sample size
The distribution of the population in which the samples were taken cannot be verified; therefore, a non-parametric test is appropriate for this analysis. The Kruskal–Wallis test determines whether three or more samples came from populations with the same distribution. The test is completed at each sample depth, for Col Winter, Col Summer, RR Winter, and RR Summer samples at a significance level (α) of 0.05. The Kruskal–Wallis test statistic (H) follows a Chi-squared distribution; therefore, the critical values used for the test are always right-tailed. When the test statistic, H, exceeds the critical value, it is determined that there is a significant difference between the samples and they do not originate from the same population. When the test statistic is less than the critical value, there is no significant difference in the samples and they can be said to originate from the same population. This test is useful for the data presented in this work as it allows any differences in concentration distributions to be quantified, and then compared with one another. The null (H0) and alternate (H1) hypotheses for this test are as follows:
H0: There is no difference in the phosphorous concentrations within each group (Col Winter, Col Summer, RR Winter, RR Summer) at a given depth.
H1: There is a significant difference in the phosphorous concentrations within each group (Col Winter, Col Summer, RR Winter, RR Summer) at a given depth.
Concentrations of phosphorous with distance from the curb were compared for each of Col Winter, Col Summer, RR Winter, and RR Summer using the Spearman Rank Coefficient (Bluman, Citation2017):
Where
rs = rank coefficient
d = difference between ranks
n = number of variable pairs
The Spearman Rank Coefficient (SRC) is used to quantify the correlation between variables by first ranking them in order of lowest to highest. As with the H-Statistic used in the K-W test described above, the SRC is also a non-parametric statistic. It is two-tailed and therefore has a positive and negative critical value. If the calculated SRC is greater than the positive critical value or less than the negative critical value, it can be said that a statistically significant relationship exists between the two variables for a given significance level. For this analysis, a critical value of ± 0.428 is used for the Col Samples (for which there are 22), and ± 0.400 for the RR Samples (for which there are 25) at a significance level (α) of 0.05.
5. Results and discussion
5.1. Heavy metal concentrations in soil samples
The spatial trends in concentrations of heavy metals in the near-surface soils align with results presented in previous literature (Khalid et al., Citation2018; Ward et al., Citation1977; Werkenthin et al., Citation2014), with concentrations decreasing with increasing distance from the roadway as shown in Figure . The maximum permissible metal content for soils is shown as a red line and given in Table . This is a standard used as a background value by the SGS Agri-Food Labs, taken from Ministry of Environment regulations under the Nutrient Management Act (O. Reg. 338/09). For all of the metal species analyzed during the current study, with the exception of Cu, the soil concentrations were well above permissible levels near the roadway. Concentrations gradually decrease to at or below permissible levels at distances between 10 m and 15 m from the curb and sidewalk.
Table 1. Maximum allowable heavy metal concentrations in soil, as stated in the Ontario Nutrient Management Act (O. Reg. 338/09)
Figure 3. Heavy metal concentrations with distance from the edge of the road in samples collected from the upper 20 cm of the soil profile. Data is plotted in reference to an allowable concentration in uncontaminated soils (shown as a red line) as stated in the Ontario Nutrient Management Act.
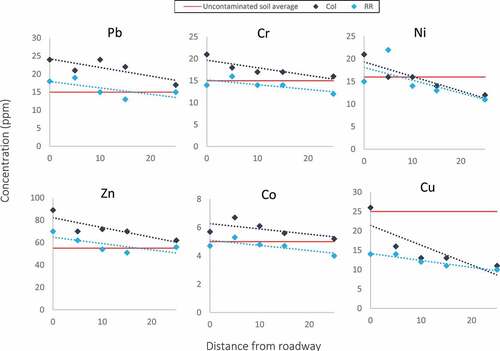
The concentration of each of the metal species was consistently higher at the Col site. This may be attributed to higher traffic density and vehicular velocity at this site compared to the RR site. The most problematic metals are those which maintain above permissible concentrations at increasing distances from the curb/sidewalk. At the Col site, lead, chromium, cobalt, and zinc do not fall below the permissible concentration level even at the furthest observed distance from the road. Khalid et al. (Citation2018) also observe problematic levels of zinc and lead in roadside soils near Gaviota, California, and concluded that these increased concentrations have adverse effects on surrounding vegetation. Though the trendlines for lead, chromium, cobalt, and zinc have near-identical slopes at both sites in the current study, the RR site trendlines do fall below permissible levels at some point before reaching the maximum distance of 25 m. Trendlines for nickel concentration at Col and RR are very close, falling below the maximum permissible concentration at approximately 12 m and 8 m, respectively. As aforementioned, copper does not ever exceed the maximum permissible level, though it does show a decreasing trend in both cases. Overall, the results of the soil heavy metal analysis suggest that the roadside soils have been noticeably affected by vehicle emissions via snow/water splashing and snow pack melt.
5.2. Phosphorus concentrations in soil samples
5.2.1. Total phosphorus concentrations with depth
The combined, composite soil total phosphorus analyses from each depth are presented in Figure and as cross-sectional contours in Figure . There is a clear trend of decreasing concentration with depth. The soil concentrations measured in the summer appear to be slightly higher than those measured in the winter months. This data would suggest that there is an influence of a surface load source at both sites. In addition to the potential phosphorous loading from vehicular traffic, there are several other possible sources of phosphorous which may include leaf litter, plant decay, and animal activity. These alternative sources complicate and mask the potential influence of phosphorous from vehicles.
Figure 4. Phosphorous concentration with depth for Col Winter samples (top left), Col Summer samples (top right), RR Winter samples (bottom left), and RR Summer samples (bottom right). Logarithmic trendlines are superimposed upon all samples with the exception Col W-5 and Col S-5, which only have data from the first two depth intervals.
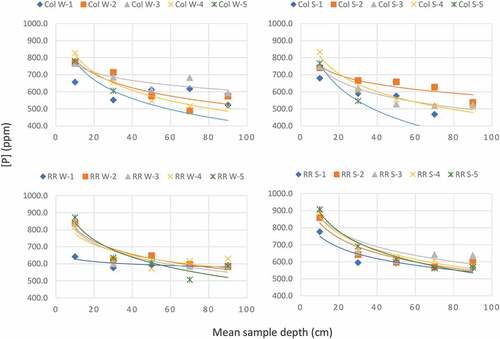
Soil phosphorus data collected by the International Soil Reference and Information Centre (ISRIC) (Citation2011) illustrate that the relationship of decreasing phosphorus concentration with depth is widely seen in natural soils. The ISRIC study examined adsorbed and plant available phosphorus concentrations in a variety of different soils, taking note of soil type and general grain size. This study used the same depth intervals as the current study (0–20, 20–40, 40–60, 60–80, and 80–100 cm below surface). The results provide a relevant indication of general phosphorous patterns to be expected in a typical soil profile. The Food and Agriculture Organization of the United Nations (FAO) defines the soils in the Waterloo Region as luvisols (high clay content, generally flat or sloping, with glacial till and alluvial parent material) (Food and Agriculture Organization of the United Nations, Citation2011). The data from the IRSIC report concerning luvisols tested using the Bray1 method show consistently decreasing phosphorous concentrations from the surface to 100 cm depth. From this, it can be concluded that the patterns seen in the current study are consistent with normal phosphorous concentration patterns in luvisols. Results of the Kruskal–Wallis (K-W) test (Table ) indicate that there is no significant difference in the concentration of phosphorous at each depth interval over different seasons or locations. This result is expected given the similarity of the trendlines shown in Figure . Both the results of the K-W test and the similarity between the phosphorus profiles in the current study and in the IRSIC report suggest that phosphorous from vehicular emissions does not pose a threat to roadside soils and subsequently the underlying groundwater.
Table 2. Results of K-W Test performed on Col Winter, Col Summer, RR Winter, and RR Summer samples at each depth interval
Other works which have examined organophosphate profiles in soil near the roadway report variable results. Fabiańska et al. (Citation2019) report very low traces of organophosphates in roadside soils, attributed to a combination of soil conditions that are favourable for transport, biodegradation by bacteria, and concentrations which are below the detection limit. This result is in contrast to results of Cui et al. (Citation2017), which observed roadside soil organophosphate concentrations nearly two orders of magnitude greater than those reported in Fabiańska et al. (Citation2019). The concentrations reported in Cui et al. (Citation2017) were observed in commercial areas with heavy traffic. While the results of these studies cannot be directly compared to the results of the current study (owing to the fact that the current study considered only total phosphorous concentration and not the concentration of individual organophosphate esters), it is clear that phosphorous in roadside soil is highly variable and likely influenced heavily by both traffic and soil conditions.
5.2.2. Total phosphorus concentrations with distance from road
The composite soil phosphorus data collected at both sites are plotted relative to sample distance from the curb/sidewalk in Figure and shown as cross-sectional contour plots in Figure . Although there is a wide range of values at any given distance from the road, there is no apparent correlation between distance and phosphorous concentration regardless of the season or location. This is verified by the Spearman Rank Coefficient calculated for each of Col W, Col S, RR W, and RR S (shown in Table ). This result is contrary to what was observed in the metals data. It is also notable that while there was a distinct difference in the metal concentrations at each site, likely due to traffic density, there is no discernible difference in phosphorus concentrations between the two sites. Although there is a decrease with depth, the overall distribution of phosphorous with respect to distance from the road would be expected to show the same pattern as the metals distribution if the phosphorus source was the road. The consistency in soil phosphorus concentration with distance from the edge of the road suggests that there is no significant phosphorus loading to roadside soils from vehicular emissions. The amount that does reach the soil is likely used by the grass as part of its growth cycle. The metal species are not uptaken by the grass and plants and would accumulate more over time. The curbside grass areas are not routinely fertilized with phosphorous but the natural nutrient cycle results in soil phosphorous concentrations which are much higher than the loading from the roadways. This likely masks the additional phosphorous contributions from the roads. Regardless, the contribution of phosphorous from vehicular emissions would not be significant enough to cause soil concentrations that are problematic in groundwater.
Table 3. Spearman rank coefficients comparing concentration of phosphorous with distance from the curb for each of Col W, RR W, Col S, and RR S
Figure 5. Phosphorus concentration with distance from the road for all samples considering all depths. Linear trendlines are shown as a dotted line for winter samples and a dashed line for summer samples.
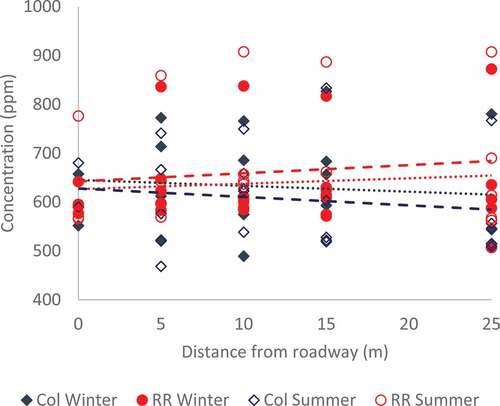
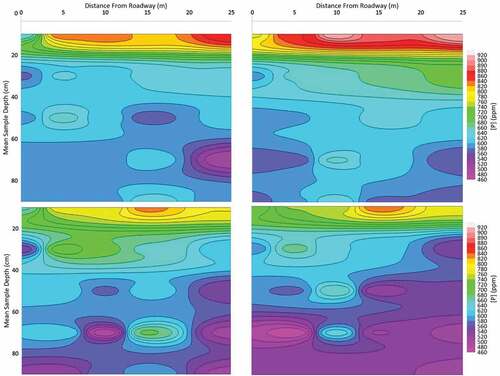
Figure 6. Total phosphorus of soils in cross section (Total phosphorous in ppm) for RR Winter (top left), RR Summer (top right), Col Winter (bottom left), and Col Summer (bottom right).
5.3. Snow pack and runoff samples
Both snow pack and runoff sample sets were taken in conditions which have high potential for contaminant accumulation: Snow pack samples were taken after a period of warm weather, allowing the snow to form compacted ice which is expected to concentrate contaminants. Runoff samples were taken after a one-week period of no precipitation and during a high-intensity rainfall event. Resultantly, these samples should represent close to a worse-case phosphorus accumulation scenario.
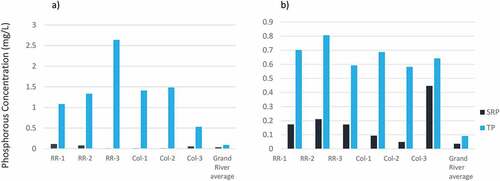
Phosphorus concentrations in the six snow pack samples are plotted in Figure ), and in the runoff samples in Figure ). Also plotted is the 3-year average of TP and SRP in the Grand River and some of its tributaries. Grand River concentrations are shown not to compare to the runoff and snow samples collected for this study (which are much less dilute than those of a waterbody), but rather to provide an understanding of the current state of phosphorous contamination in a receiving surface waterbody near the study sites. In general, SRP is higher in runoff samples than in the snow samples. This is likely because there are few sources of soluble phosphorus available to snow packs. Phosphorus deposited on snow packs is likely in the form of particulate matter transferred during ploughing, spray from vehicular motion, or direct deposition. During the summer months, runoff that migrates to storm sewers has a much longer travel distance and therefore more opportunity to accumulate dissolved matter before entering storm drains. TP, by contrast, is higher in the snow pack samples than in the runoff samples (with the exception of Col-3). It is expected that this trade-off between SRP and TP is due to longer residence time and lower solubility of phosphorous deposited on snow packs, relative to runoff. The results of the phosphorous depth profile analysis suggest that the TP accumulated in snow packs is not significant enough to increase concentrations of phosphorous in roadside soil; therefore, no further analysis of snow pack samples was undertaken. Given this observation, it is likely that much of the snow pack melts and drains back onto the roadway as runoff rather than infiltrating the soil. While infiltration is certainly greater in spring when the ground has thawed, mid-winter snow melts (which are quite common in this region) are expected to result in runoff rather than infiltration. This process also provides a mechanism which explains the higher concentrations of SRP in the runoff than in the snow. While the runoff is more dilute than the snow pack, phosphorous is not nearly as soluble in snow as it is in liquid water. Further, the road surface is an additional source of all forms of phosphorous and as melting occurs, the runoff water is expected to pick up more dissolved P load which would mix with any additional dissolved P coming from the melting snow pack. This would lead to periodically higher dissolved P within the road runoff.
Figure 7. a) and b).Phosphorus concentrations of snow pack samples (a) and runoff samples (b) comparing SRP and TP.
High TP indicates that a large portion of the phosphorus is present as particulate phosphorus. It was hypothesized that this particulate phosphorus could be in the form of phosphorus from vehicular emissions adsorbed to soil or sand from the roadway, or as phosphorus in small particulates of asphalt. In Waterloo, as well as in many large cities, storm water discharge is channeled, untreated, into waterways (into the Grand River in the case of Waterloo). To determine if this is a significant source of phosphorus entering the Grand River or other waterbodies, the mass flux of phosphorous moving from roadways to storm drains would need to be quantified. The purpose of the current study is to compare the TP and SRP concentrations of runoff to those from other high phosphorous urban runoff sources in order to understand their risk relative to those other sources.
Figure shows a compilation of total and soluble/dissolved phosphorus data taken from a range of papers and compares them with the runoff samples taken in the current research (the snow samples are not examined in this section). The samples used for comparison come from a variety of urban sample locations, including residential, commercial, and industrial areas. Sources which are “mixed” were collected from a region of mixed land use, but with one predominant use (for example, “mixed commercial” refers to a region which is primarily used for commercial purposes). The samples collected in these comparison works are either collected directly from a roadway, as were the runoff samples in the current study, or the sampling strategy is unknown. It is assumed for the purposes of this comparison that all reports and databases presenting runoff quality data must have collected the sample directly from a runoff surface (pavement, concrete, etc.)
Figure 8. Compiled Total Phosphorus (TP) and Soluble Reactive Phosphorus (SRP) (also Dissolved Phosphorus (DP)) concentrations in runoff from various studies and the current study. Percentiles for SRP and TP in the current study are shown in Table . The locations of the data shown in this figure are as follows: Pitt et al. (Citation2004) : Average concentrations across USA, where “mixed” indicates various land uses but one which is dominant; for example, “mixed commercial” indicates regions which are primarily used for commercial purposes. Pitt et al. (Citation2004) : Denver 1980 and 1992—average concentrations for the city of Denver, CO, USA in years 1980 and 1992; collected from various land use regions. Li et al. (Citation2008) : Austin, Texas, USA, and College Station, Texas, USA; concentrations from commercial samples. NSQD: National Stormwater Quality Database (Citation2014) : Average concentration across USA for samples collected on freeways, as tabulated by the National Stormwater Quality Database. Goonetilleke et al. (Citation2005) : Southeast Queensland State, Australia; samples collected from residential regions. Bryan (Citation1974) : Durham, North Carolina, USA; sample from a primarily commercial region.
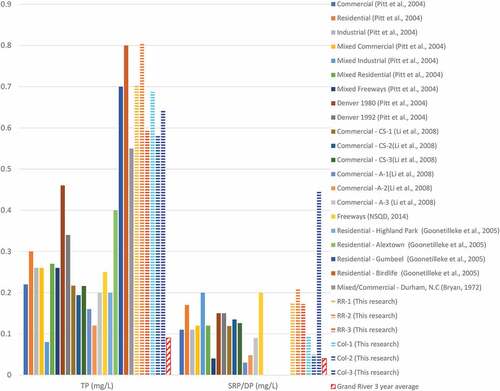
Phosphorous concentrations observed in the current research were consistently on the higher end of the compiled values. With the exception of the SRP samples for Col-1 and Col-2, all other samples for both TP and SRP fall in the 70th percentile or higher (Table ) when compared to the other data shown in Figure . It is therefore concluded that, relative to other sources of urban runoff, roadways in Waterloo yield high concentrations of TP in all cases and SRP in the majority of cases. Though it is expected that large amounts of snowmelt and spring rainfall in this region generate a proportionately large flux of roadway runoff, this work could be expanded by measuring the mass flux of TP and SRP channeled from the roadway to storm drains.
Table 4. Percentiles ranks of TP and SRP data shown in Fig. 7
It is expected that the higher overall phosphorus concentrations in the Waterloo samples are in large part resultant of high traffic volumes when compared to other industrial and commercial sites shown in Figure . While the main source of P at these sites is almost undoubtedly vehicles, the traffic volume may not be as great. The Waterloo sites are located in an unusually high traffic region, being on a busy university campus. Further, it is common for traffic jams to develop and result in vehicle idling for long periods. It is also noted that the runoff samples collected in the current study were collected after a significant period of no rainfall; therefore, there would have been strong potential for particulate emissions to accumulate on the roadway during this period. Other factors impacting the concentrations provided in Figure may include the spatial distribution of impermeable material in the region, preferential runoff flow paths which may cause mixing with other sources of phosphorous, attenuation reactions on sandy or granular asphalt, and timing of sample collection in relation to precipitation events. Given the multitude of factors which may influence phosphorous concentrations in a particular runoff sample, this work does not aim to make any conclusions as to the explanation of why certain regions and sources have higher concentrations, rather, it aims to place the runoff samples collected in the current study within the context of those collected from diverse regions and land uses. Future work would benefit from conducting an in-depth investigation to understand which of the factors listed above are most influential in determining phosphorous concentrations in urban runoff.
6. Conclusions
The objective of this work was to determine whether or not phosphorous sourced from vehicular emissions and deposited onto roadways presents a significant risk to either groundwater, via infiltration into roadside soil, or to surface water, via runoff to storm drains. There was no correlation between soil phosphorous concentrations and distance from the roadway in any of the sampled data, nor were roadside phosphorous profiles different than background profiles for similar soil types. Though it was observed that heavy metals have contaminated roadside soils and that the mechanism for roadside soil contamination from vehicular deposits is valid, phosphorous does not appear to present a risk to roadside soils and, therefore, should neither present a risk to groundwater.
Conversely, phosphorous concentrations (measured as TP and SRP) in runoff were consistently higher than those of other urban runoff studies (>70th percentile in all but two cases). This suggests that vehicular emissions in this region do yield high concentrations of phosphorous in runoff relative to other sources of urban runoff. The nature of the environment in which this study was undertaken is such that runoff from roadways channeled to storm drains, particularly during spring, contributes significant amounts of water to discharge surface waterbodies. Given that phosphorus concentrations in roadway runoff are high compared to other urban sources which undoubtedly contribute to eutrophication of surface waterbodies, subsequent work should aim to quantify the mass flux of phosphorous channeled from roadways into storm drains. This would provide an increased understanding of the overall contribution of emission-sourced phosphorous to surface waterbodies.
Competing Interests
The authors declare no competing interests.
Acknowledgements
The authors would like to acknowledge The Natural Sciences and Engineering Research Council of Canada as the primary funding source for this research. We would also like to acknowledge Marianne Vandergriendt for her invaluable lab support, as well as Simon Huddart and Melanie Ty for their field assistance. Finally, we would like to thank the anonymous reviewers of Cogent Environmental Science for the valuable suggestions they provided during the review of this manuscript.
Additional information
Funding
Notes on contributors
Philippe Van Cappellen
The authors are involved in the investigation of non-point source contamination within urban and rural environments associated with a wide variety of land management practices. Within the urban environment, specific emphasis has been placed on the impacts of vehicular traffic management including road deicing practices in cold climates. The current project aims to assess the potential influence of vehicular phosphorous emissions on groundwater in the vicinity of busy urban roadways with observations related to associated road runoff. Regional impacts of nutrient management on surface waters and groundwater within agricultural landscapes is also a primary focus. The research team integrates detailed field investigation with laboratory work and modeling tools to explore beneficial management practices (BMPs) intended to reduce the impact of various land management practices on regional water quality.
References
- Apeagyei, E., Bank, M. S., & Spengler, J. D. (2011). Distribution of heavy metals in road dust along an urban-rural gradient in massachusetts. Atmospheric Environment, 45(13), 2310–17. https://doi.org/10.1016/j.atmosenv.2010.11.015
- Aspila, K. I., Agemian, H., & Chau, A. S. Y. (1976). A semi-automated method for the determination of inorganic, organic and total phosphate in sediments. The Analyst, 101(1200), 187–197. https://doi.org/10.1039/an9760100187
- Bluman, A. G. (2017). Elementary statistics: A step by step approach (10th ed.). McGraw-Hill Education.
- Brooke, D. N., Crookes, M. J., Quarterman, P., & Burns, J. (2009, August). Environmental risk evaluation report: Tricresyl phosphate. Environment Agency, UK.
- Bryan, E. (1974). Concentrations of lead in urban stormwater. Journal (Water Pollution Control Federation), 46(10), 2419–2421. https://pubmed.ncbi.nlm.nih.gov/4444083/
- City of Waterloo. (2018). City of Waterloo open data: Traffic volumes. Retrieved April 30, 2019 from http://data.waterloo.ca/datasets/426089c5166c4f8f8f4000acb2fef840_0/data
- Cui, K., Wen, J., Zeng, F., Li, S., Zhou, X., & Zeng, Z. (2017). Occurrence and distribution of organophosphate esters in urban soils of the subtropical city, Guangzhou, China. Chemosphere,175,514–520. https://doi.org/10.1016/j.chemosphere.2017.02.070
- Dallmann, T., Onasch, T., Kirchstetter, T., Worton, D., Fortner, E., Herndon, S., Wood, E. C., Franklin, J. P., Worsnop, D. R., Goldstein, A. H., & Harley, R. (2014). Characterization of particulate matter emissions from on-road gasoline and diesel vehicles using a soot particle aerosol mass spectrometer. Atmospheric Chemistry and Physics, 14(14), 7585–7599. https://doi.org/10.5194/acp-14-7585-2014
- Dolan, D. M., & McGunagle, K. P. (2005). Lake Erie total phosphorus loading analysis and update: 1996-2002. Journal of Great Lakes Research, 31, 11–22. https://doi.org/10.1016/S0380-1330(05)70301-4
- Domagalski, J. L., & Johnson, H. (2011). Subsurface transport of orthophosphate in five agricultural watersheds, USA. Journal of Hydrology, 409(1–2), 157–171. https://doi.org/10.1016/j.jhydrol.2011.08.014
- Duong, T. T. T., & Lee, B. (2011). Determining contamination level of heavy metals in road dust from busy traffic areas with different characteristics. Journal of Environmental Management, 92(3), 554–562. https://doi.org/10.1016/j.jenvman.2010.09.010
- Environment Canada. (2009, December). Environment Canada’s gasoline regulations. Government of Canada. https://laws-lois.justice.gc.ca/eng/regulations/SOR-90-247/page-1.html
- Fabiańska, M., Kozielska, B., Konieczyński, J., & Bielaczyc, P. (2019). Occurrence of organic phosphates in particulate matter of the vehicle exhausts and outdoor environment – A case study. Environmental Pollution, 244, 351–360. https://doi.org/10.1016/j.envpol.2018.10.060
- Food and Agriculture Organization of the United Nations. (2011). Country pasture/forage resource profiles - Canada. D. McCartney, Author.
- Goonetilleke, A., Thomas, E., Ginn, S., & Gilbert, D. (2005). Understanding the role of land use in urban stormwater quality management. Journal of Environmental Management, 74(1), 31–42. https://doi.org/10.1016/j.jenvman.2004.08.006
- He, M. (2019). Organophosphate esters in road dust from a suburban area of Chongqing, China: Characterization of particle size distribution and human exposure. Archives of Environmental Contamination and Toxicology, 76(4), 630–639. https://doi.org/10.1007/s00244-019-00612-1
- Holman, I., Whelan, M., Howden, N., Bellamy, P., Willby, N., Rivas-Casado, M., & McConvey, P. (2008). Phosphorus in groundwater—an overlooked contributor to eutrophication? Hydrological Processes, 22(26), 5121–5127. https://doi.org/10.1002/hyp.7198
- International Soil Reference and Information Centre. (2011, February). Overview of soil phosphorus data from a large international soil database. N. H. Batjes, Author.
- Ireland Environmental Protection Agency. (2005). Phosphorus Regulations National Implementation Report. Dr Conor Clenaghan, Mr. Frank Clinton & Dr Matthew Crowe. ISBN: 1-84095-181-8.
- Khalid, N., Hussain, M., Young Hillary, S., Boyce, B., Aqeel, M., & Noman, A. (2018). Effects of road proximity on heavy metal concentrations in soils and common roadside plants in Southern California. Environmental Science and Pollution Research, 25(35), 35257–35265. https://doi.org/10.1007/s11356-018-3218-1
- Kuoppamaki, K., Setala, H., Rantalainen, A.-L., & Kotze, D. J. (2014). Urban snow indicates pollution originating from road traffic. Environmental Pollution, 195(195), 56–63. https://doi.org/10.1016/j.envpol.2014.08.019
- Li, M., Barrett, M., Rammohan, P., Olivera, F., & Landphair, H. (2008). Documenting stormwater quality on Texas highways and adjacent vegetated roadsides. (Report). Journal of Environmental Engineering, 134(1), 48–59. https://doi.org/10.1061/(ASCE)0733-9372(2008)134:1(48)
- NSQD: National Stormwater Quality Database. (2014). http://www.bmpdatabase.org/nsqd.html
- Pereira, E., Baptista-Neto, J. A., Smith, B. J., & Mcallister, J. J. (2007). The contribution of heavy metal pollution derived from highway runoff to Guanabara Bay sediments: Rio de Janeiro/Brazil. Anais Da Academia Brasileira De Ciências, 79(4), 739–750. https://doi.org/https://dx.doi.10.1590/S0001-37652007000400013
- Pitt, R., Maestre, A., & Morquecho, R. (2004). The National Stormwater Quality Database (NSQD), Version 1.1. University of Alabama. http://rpitt.eng.ua.edu/Research/ms4/Paper/Mainms4paper.html
- Qian, J., Wang, L., Zhan, H. B., & Chen, Z. (2011). Urban land-use effects on groundwater phosphate distribution in a shallow aquifer, Nanfei River basin, China. Hydrogeology Journal, 19(7), 1431–1442. https://doi.org/10.1007/s10040-011-0770-x
- Rao, N., & Prasad, P. (1997). Phosphate pollution in the groundwater of lower Vamsadhara river basin, India. Environmental Geology, 31(1–2), 117–122. https://doi.org/10.1007/s002540050170
- Rasiah, V., Moody, P., & Armour, J. (2011). Soluble phosphate in fluctuating groundwater under cropping in the north-eastern wet tropics of Australia. Soil Research, 49(4), 329–342. https://doi.org/10.1071/SR10167
- Robinson, C. (2015). Review on groundwater as a source of nutrients to the Great Lakes and their tributaries. Journal of Great Lakes Research, 41(4), 941–950. https://doi.org/10.1016/j.jglr.2015.08.001
- Roy, J., & Malenica, A. (2013). Nutrients and toxic contaminants in shallow groundwater along Lake Simcoe urban shorelines. Inland Waters, 3(2), 125–138. https://doi.org/10.5268/IW-3.2.521
- Ruttenberg, K. C., Ogawa, N. O., Tamburini, F., Briggs, R. A., Colasacco, N. D., & Joyce, E. (2009). Improved, high-throughput approach for phosphorus speciation in natural sediments via the SEDEX sequential extraction method. Limnology and Oceanography: Methods, 7(5), 319–333. https://doi.org/10.4319/lom.2009.7.319
- Seitzinger, S. P., Harrison, J. A., Dumont, E., Beusen, A. H. W., & Bouwman, A. F. (2005). Sources and delivery of carbon, nitrogen, and phosphorus to the coastal zone: An overview of Global Nutrient Export from Watersheds (NEWS) models and their application. Global Biogeochemical Cycles, 19(4). https://doi.org/10.1029/2005GB002606
- Świetlik, R., Strzelecka, M., & Trojanowska, M. (2013). Evaluation of traffic-related heavy metals emissions using noise barrier road dust analysis. Polish Journal of Environmental Studies, 22(2), 561–567. http://www.pjoes.com/Evaluation-of-Traffic-Related-Heavy-Metals-r-nEmissions-Using-Noise-Barrier-Road,89010,0,2.html
- Totten, G. E. (Ed.). (2003). Fuels and lubricants handbook: Technology, properties, performance and testing. ASTM International.
- United States Environmental Protection Agency. (1993, August). Method 365.1, revision 2.0: Determination of phosphorus by semi-automated colorimetry. J. W. O’Dell, Ed..
- United States Environmental Protection Agency. (1994). Method 200.8, revision 5.4: Determination of trace elements in waters and wastes by inductively coupled plasma – mass spectrometry. J.T. Creed, C.A. Brockhoff, and T.D. Martin, Ed..
- United States Environmental Protection Agency. (1996). Method 3050B, revision 2.0: Acid digestion of sediments, sludges, and soils.
- Ward, N. I., Brooks, R. R., & Roberts, E. (1977). Heavy-metal pollution from automotive emissions and its effect on roadside soils and pasture species in New Zealand. Environmental Science & Technology, 11(9), 917–920. https://doi.org/10.1021/es60132a007
- Werkenthin, M., Kluge, B., & Wessolek, G. (2014). Metals in European roadside soils and soil solution - A review. Environmental Pollution, 189(189), 98–110. https://doi.org/10.1016/j.envpol.2014.02.025
- Wilson, R. S., Schlea, D. A., Boles, C. M. W., & Redder, T. M. (2018). Using models of farmer behavior to inform eutrophication policy in the great lakes. Water Research, 139(Complete), 38–46. https://doi.org/10.1016/j.watres.2018.03.065
- Xu, H., Brown, D. G., Moore, M. R., & Currie, W. S. (2018). Optimizing spatial land management to balance water quality and economic returns in a lake erie watershed. Ecological Economics, 145(Complete), 104–114. https://doi.org/10.1016/j.ecolecon.2017.08.015
- Zanders, J. M. (2005). Road sediment: Characterization and implications for the performance of vegetated strips for treating road run-off. Science of the Total Environment, 339(1–3), 41–47. https://doi.org/10.1016/j.scitotenv.2004.07.023
- Zanini, L., Robertson, W. D., Ptacek, C. J., Schiff, S. L., & Mayer, T. (1998). Phosphorus characterization in sediments impacted by septic effluent at four sites in central Canada. Journal of Contaminant Hydrology, 33(3–4), 405–429. https://doi.org/10.1016/S0169-7722(98)00082-5