
 ?Mathematical formulae have been encoded as MathML and are displayed in this HTML version using MathJax in order to improve their display. Uncheck the box to turn MathJax off. This feature requires Javascript. Click on a formula to zoom.
Abstract
Households which are the primary producers of solid waste and suffer from the effects of uncollected solid waste should be able to participate in improving SWM. Accordingly, the contribution of urban dwellers on SWM service plays a great role for better improvement of SWM at the community. Therefore, this study aims to estimate households’ willingness to pay for improved solid waste management services and analyze its determinant using binary logit econometrics model. A total of 350 randomly selected households were interviewed to address the objective of this study. The study was used both descriptive and econometrics analysis. Finally, the survey result indicated that 86.3% of sample households were willing to pay for improved solid waste management services. Following this, the one and one half bounded contingent valuation result revealed that the mean willingness to pay is 13.10 ETB[Money official Exchange rate of 1$ = 31.45 Ethiopian Birr (ETB)]/month with the total willingness to pay of 494587ETB/month which is much higher than the amount of money collected by Bahir Dar city municipality (335,000 ETB/month). Additionally, the model result demonstrated that educational level of the household, monthly aggregate income, and quantity of waste generated per week, access to solid waste management services and respondents’ responsibility on solid waste management had significant positive effect on households’ willingness to pay unlike sex of household head and number of children in the household. The municipality of Bahir Dar city should consider these significant variables to design and implement improved solid waste management services.
Public interest statement
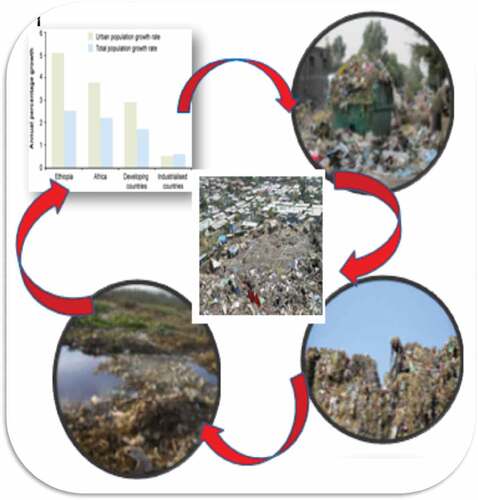
In 2012, the world’s cities generated 1.3 billion tons of solid waste per year, amounting to a rate of 1.2 kg per person per day. With rapid population growth and urbanization, municipal waste generation is expected to rise to 2.2 billion tons by 2025. In sub-Saharan Africa, waste generation is approximately 62 million tons per year ranging from 0.09 −3.0 kg per person per day, with an average of 0.65 kg/capita/day. In developing countries, waste management requires a large expenditure of 30–50% of municipal operational budgets. However, cities collect only half of the wastes generated. In Ethiopia, the per capita amount of waste generated ranges from 0.28 to 0.83 kg/person/day and it lacks the financial resources and institutional capacity to provide the needed municipal infrastructure for adequate solid waste management. In Ethiopia, the government realized that it is impossible to address the problem of environment, particularly solid waste management, without involvement of local communities.
1. Introduction
Globally, the amount of municipal solid waste is growing faster than the rate of urbanization. In 2012, the world’s cities generated 1.3 billion tons of solid waste per year, amounting to a rate of 1.2 kg per person per day. With rapid population growth and urbanization, municipal waste generation is expected to rise to 2.2 billion tons by 2025 (Akhtar et al., Citation2017; AOIKE, Citation2019). At present, 62 million tons per year of municipal waste is generated in sub-Saharan Africa, with an average of 0.65 kg per person/day (Wilson et al., Citation2012). By 2050, the urban population in sub-Saharan Africa is projected to generate three times the amount of waste it currently produces (Kaza et al., Citation2018).
Although urbanization is a sign of economic, cultural, and social development, the pace of its occurrence is excessively rapid and unsustainable (Dimitre, Citation2011). The number of persons added to the urban population in developing countries increase the challenges faced by governments, urban planners, nongovernment service providers and urban residents (Damtew & Desta, Citation2015; Hoang et al., Citation2017). Urbanization and population growth are solely responsible for high increasing rate of solid waste disposal (Alam & Ahmade, Citation2013; Rezaei et al., Citation2010). Even though the overall goal of urban solid waste management/SWM/is to collect, treat and dispose of solid waste generated by all urban population dwellers, and it is also common that 30–60% of all the urban solid waste in developing countries is uncollected and less than 50% of the population is served (Monyoncho, Citation2013).
Almost 2 billion people worldwide still lack access to solid waste collection services, with the lowest collection rates being observed in low-income countries (Rodić & Wilson, Citation2017). Scholarly literatures indicated that improper municipal solid waste disposal and management causes all types of pollution: air, soil, and water (Alam & Ahmade, Citation2013; Srigirisetty et al., Citation2017). This indicated that improper solid waste management contributes to a worsening environmental degradation (Marshall & Farahbakhsh, Citation2013). Problems of waste generation and management in developing countries have become one of the intractable environmental problems facing urban centers (Thi et al., Citation2015).
In Ethiopia, the per capita amount of waste generated ranges from 0.28 to 0.83 kg/person/day (Act, Clean Air, Act, Recovery & Act, Recovery, Citation2006) and it lacks the financial resources and institutional capacity to provide the needed municipal infrastructure for adequate solid waste management (SWM) (Dagnew et al., Citation2012). In Ethiopia, the government realized that it is impossible to address the problem of environment, particularly SWM, without involvement of local communities (Cheever, Citation2011). As a result, SWM is becoming a major public health and environmental concern in urban areas of Ethiopia though only 65% of the population received solid waste collection services (Pierrat et al., Citation2012). An inefficient municipal SWM system may create serious negative environmental impacts like infectious diseases, land and water pollution, obstruction of drains and loss of biodiversity (Khajuria et al., Citation2010; Nabavi-Pelesaraei et al., Citation2017).
As urbanization continues, SWM becomes a major public health and environmental threat in urban areas (Kassa & Teshome, Citation2016; Noori et al., Citation2010). Bahir Dar city is one of the highly expanding and rapidly growing cities in Ethiopia (Alam & Ahmade, Citation2013; Ejaz et al., Citation2010; Saritha et al., Citation2015). According to UNEP (Citation2010a), one of the challenges that the Ethiopian cities such as Bahir Dar city faces are the problem of sanitation in general and SWM in particular. A total of 98.8 tons per day of solid waste is generated from Bahir Dar city. But the city municipality collects and disposes only 58% of the total solid waste disposed to the environment (Ebistu & Minale, Citation2013). This implies that small proportions of the urban dwellers are served and large quantity of solid waste left uncollected. This indicated that the government of Ethiopia is failed to implement Article 92.1 which states that “government shall endeavor to ensure that all Ethiopians live in a clean and healthy environment” (B. A. Biruk Abate. Fenta, Citation2017; Kassa & Teshome, Citation2016).
Similarly, Article 92.2 explained that “Government and citizens shall have the duty to protect the environment”(Cheever, Citation2011). But these interventions that aim to improve the coverage and quality of SWM services are not demand oriented (B. Birhan. Fenta, Citation2020). Bahir Dar, a city with 220,000 inhabitants in northwestern Ethiopia, is one of the fastest growing cities in the country (Mehari et al., Citation2016). If the current annual population growth rate of 6.6% continues, the city population will double in 11 years and households which are the primary producers of solid waste and suffer from the effects of uncollected solid waste should be able to participate in improving SWM. Accordingly, the contribution of urban dwellers on SWM service plays a great role for better improvement of SWM at the community (Ezeah et al., Citation2013). Thus the need for adequate SWM is unquestionable and well acknowledged by the municipality (Lohri et al., Citation2014). However, there is limited evidence on the willingness to pay (WTP) for improved SWM and associated factors in the study area. So, this study is conducted to estimate the Bahir Dar city households’ WTP for improved SWM services using one and one half bounded followed by open-ended contingent valuation/CV/for improved SWM services.
2. Literature review
2.1. Contingent valuation method
Despite a variety of validity and measurement issues (Carson & Czajkowski, Citation2014) application of CV surveys are argued to be a viable method of collecting information on preferences for providing public goods and services in developing countries (Whittington, Citation2004). For instance Niringiye (Citation2010) in Kampala, Pek and Othman (Citation2010) in Malaysia and Afroz et al. (Citation2009) in Dhaka provide examples of recent CV studies in developing country contexts. Many of these studies provide evidence that households are willing to pay a significant amount for the provision of improved waste management. Eliciting a respondent’s preferences through the CV method requires careful survey design, choice of survey mode, and selection of random sample (Whittington, Citation2002). According to D. A. Hoyos and P. Mariel (2010), the economic valuation of environmental resources using stated preference information has come to be known as Contingent valuation method/CVM/. CVM is one of the most commonly used techniques for environmental resource valuation.
CVM is among the stated preference valuation methods and is based on direct expression of individuals’ WTP or WTA in compensation for any change in environmental quantities, qualities, or both (Bogale & Urgessa, Citation2012; Kasaye, Citation2015). CVM asks people to directly state their WTP for nonuse values rather than inferring them from observed behaviors in regular market places (Albertini & Cooper, Citation2000). The CV technique has great flexibility, allowing valuation of a wider variety of nonmarket goods and services than is possible with any of the indirect techniques. In natural resources, CV studies generally derive values through the elicitation of respondents’ WTP to prevent injuries to natural resources or to restore injured natural resources (Khalid, Citation2008). In order to elicit more reliable answers from respondents, researchers have developed different methods of asking evaluative questions, for example, open-ended questions, bidding games, payment cards, and dichotomous choice format (Chien et al., Citation2005). Among the formats of CVM, Dichotomous choice CV format (single bounded, double bounded, and one and one half bounded) has gained popularity over the last several years due to their purported advantages in avoiding many of the biases known to be inherent in other formats used in the CVM. The dichotomous choice format involves a binary question to a given price and has been advocated by the National Oceanic and Atmospheric Administration (NOAA) panel protocol on CVM studies (Jantzen, Citation2006; Rahji & Oloruntoba, Citation2009).
Among the dichotomous choice formats, double bounded CV format has the benefit of higher statistical efficiency than single bounded CV format (Jones et al., Citation2010). In double bounded CV, the second price is set on the basis of the subject’s response to the first price. If the subject responds “yes” the first price, the second price is some amount higher than the first price; if the initial response is “no,” the second price is some amount lower (Ezebilo, Citation2013). But double bounded CVM has aroused controversy because of evidence that responses to the first price may sometimes be inconsistent with the responses to the second price which leads to a lower WTP (Mulat et al., Citation2019). As a result, one and one half bounded CVM was introduced to reduce the potential responses biases due to the follow up bid in double bounded CV format (Cooper et al., Citation2002). One and one half bounded CVM is used to identify both the bounded and unbounded WTP of the respondents but not the exact amount of respondents’ WTP (Oerlemans et al., Citation2016). One and one half bounded CV followed by an open-ended question provides strictly more information than a pure one and one half bounded CV format. As Marta-Pedroso et al. (Citation2012) explained the follow up open-ended question is used to state the unbounded WTP of respondents. Depending on the above explanation, this study employed one and one half bounded CVM followed by open-ended question to elicit the households’ maximum WTP.
2.2. Empirical studies
The indiscriminate disposal of waste is not a new phenomenon worldwide and in developing countries in particular, which persist till date, despite the long realization of the consequences. Research has been undertaken by scholars around understanding household’s participation in SWM services, their attitudes towards the SWM action, their WTP for improved SWM and the factors influencing household’s WTP value for improved SWM services. So, the results of the reviewed articles are summarized and presented both in narration and tabular form. The study conducted by Han et al. (Citation2011) estimated WTP for environment conservation using CVM. The result indicated that 73% of the respondents were WTP for the conservation of the forest with average WTP of 8.03 USD but 27% of the respondents were not WTP anything at all.
A study by Kalbali et al. (Citation2014) analyzed factors affecting the WTP of visitors and the amount they are WTP for forest park using CV and application of Tobit model and estimated the average WTP of them for using the park. The report revealed that average WTP per visitor for each visit was estimated 2623 Rials and annual recreational value of the forest park was around 4 billion Rials. Additionally, Cho et al. (Citation2005) measured rural homeowners’ WTP for land conservation easements using CVM. The estimated result reported that household’s WTP to participate in an easement program ranges from 10.97 USD to 21.79 USD per year per household.
Estimated households’ WTP for improved MSWM services in Kampala, Uganda (Ojok et al., Citation2014). A dichotomous choice CV technique was used to elicit households’ WTP. The logit regression model was used to obtain the WTP of the households with sample size of 4015 households by applied systematic sampling method. Greater than 48% of households in Kampala were willing to pay for improved MSWM services with a mean monthly WTP of UGX 5,382 (USD 2.91). Also, a study on determinants of households WTP for solid waste collection services in Oyo state, Nigeria (Basiru, Citation2017) with dichotomous choice CV technique was used to elicit households WTP. Total of 140 sample households were selected by systematic random sampling method and data collected with structured questionnaire. The data were analyzed using logit regression technique and results showed that the mean WTP of households for improved SWM is N 1240.92.
The study originated from Economic Valuation of Private Sector Waste Management Services with a contingent valuation survey in Ilorin stat, south west Nigeria (Ezebilo & Animasaun, Citation2011). The study was conducted in 224 sample households randomly after stratified the study area. A censored Tobit model was used to analysis results. The results show that more than 80 % of the respondents were support of the residential waste management services. The respondents were WTP an average of 3,660 Nigerian Naira (US 24 USD) per year. Income, education, dwelling type and whether the respondent is satisfied with private sector participation in provision of SWM service were positively influenced the respondents’ WTP.
A study on WTP for SWM Services in Islamabada, Pakistan (Anjum, Citation2013), and stratified random sampling technique was applied for sample size selection of 500 respondents. A double bounded dichotomous choice questions followed by an open-ended question format was used. The logistic regression estimation reveals that 65.4 percent of the total respondents are WTP, while the multiple regressions reveals a monthly mean WTP of Rs 289.15 which is greatly affected by household income, education and environmental awareness variables were positive and significant relationship with WTP, and household size was a negative and significant relationship with households WTP at 5% significance level for all these variables. But age, service availability, and marital status of the respondent were not significant.
Study examined factors that might influence WTP for waste disposal among male and female gender in Ekiti State, Nigeria (Adebo & Ajewole, Citation2012). A total of 300 respondents were interviewed. The data collected was analyzed using descriptive analysis and probit regression. Results showed that 85.5% of the respondents were WTP for improved SWM while 14.5% were not willing. Probit regression analysis showed WTP for waste disposal was significantly affected by gender; nature of primary occupation, marital status, level of education and average monthly income. However, family size, household headship (significant and negative at 10% and 5% confidence level respectively), and nearness to dump site all have a negative relationship with WTP.
An analysis of households’ WTP for better SWM services in urban areas of district Peshawar, Pakistan (Khattak et al., Citation2009). this study the CVM was used to analyze the determinants of households’ WTP for improved water services by applying the open-ended value elicitation format. The study used cross-sectional data collected from 216 households selected through systematic random sampling method. From logit regression important results were obtained indicating that 49% of the samples HHs were willing to pay for better SWM services. The results further show HH size, Income of HH and higher education as important determinants of HH’s WTP for better SWM services at 10%, 5%, and 1% significance levels respectively.
A study used CVM to determine the WTP of the poor for improved access to SW collection and disposal services, in the city of Kuala Lumpur, Malaysia (Murad et al., Citation2007). Stratified quota random sampling methods were used along with the key stratification variable characteristics of household. Total sample size of 300 households and multiple linear regressions for data analysis were applied. The mean WTP from their study was MYR 13.00. The most significant factors in their study that affect WTP were respondents satisfaction with present waste collection services, income of respondents, gender, length of stay of residents in the area, and number of children’s less than 12 ages. Finally a study of municipal solid waste management of Tinsukia Municipality of Assam in India (Das and (Das & Gogoi, Citation2014). They found that if the family income increases then the probability that the people are in favor of cost sharing is 13%. The study further revealed that the amount of monthly waste generated per household has also influence on peoples WTP for SWM.
2.3. Conceptual framework
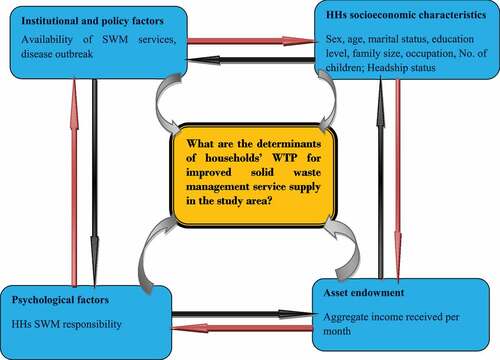
The conceptual framework summarizes the concepts, assumptions, expectations, and theories that support and inform the research design. According to Miles and Huberman (Citation1994), a conceptual framework can be defined as a visual or written product that “explains, either graphically or in narrative form the main things to be studied, the key factors, concepts or variables and the presumed relationship among them”.
Households WTP for improved SWM services will depend upon a number of important determinants. In this study HH’s WTP is treated as the dependent variable, and it is taken as categorical dummy variable which assumes only two values. So, the conceptual framework of the study focused on how to elicit households’ WTP for better SWM in study area? And what are the major socioeconomic factors that affect the farmer’s WTP for better SWM service supply? Based on the related literatures, the researcher has developed the following conceptual framework for the purpose of analysis. As stated above, MSWs are generated from different sources such as from industries, institutions, commercials, households and the like. This study was emphasized on households’ WTP, and determinants of households WTP for improved SWM services in the case of Bahir Dar city. The main focus and scope of this study is summarized on the following conceptual framework (Figure ).
Figure 1. Conceptual framework.
3. Materials and methods
3.1. Description of the study area
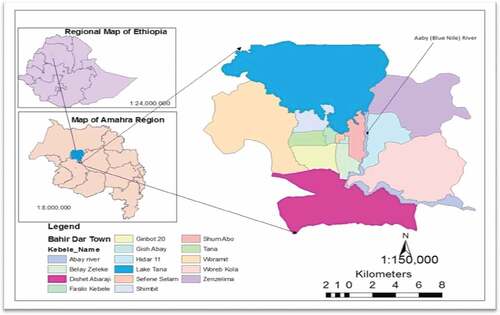
Bahir Dar city is located in the north western part of Ethiopia which is the capital city of Amhara National Region state (UNEP, Citation2010a). Bahir Dar city is located at11°36”North latitudes and 37°23”East longitudes (Kassa & Teshome, Citation2016). Literally, Bahir Dar means a city situated on or very close to the shore of Lake Tana and Blue Nile (Figure ). It has a total population of 220,344 in 2007 (CSA, Citation2007) and estimated number of 297,749 in 2014. Today, sewage discharge into Lake Tana has become a serious and highly visible problem (UNEP, Citation2010a). At the same time, Bahir Dar city is converting more and more land into streets, parking lots and hotels. This increases the amount of wastes disposed to the environment. Household, Commercial, industrial, construction left over’s, and agricultural wastes are the main types of wastes produced in the city. Household waste accounts 53% of the total MSW generated (Kassa & Teshome, Citation2016). Even though waste management and disposal service problems of Bahir Dar city has been identified as the priority issues next to housing and flood/drainage problems, 30%–40% waste is disposed in open places, wetlands, around fences, along streets, channels and at the peripheries of water bodies. The city has expanded rapidly throughout the 20th century. Today, waste discharges into Lake Tana have become a serious visible problem (Fikreyesus, Citation2011; Kassa & Teshome, Citation2016; UNEP, Citation2010a).
Figure 2. Map of the study area.
3.2. Sampling procedure and method of data collection
3.2.1. Sample size determination
The sample size would be determined by considering resource constraints & representativeness of sample. A critical component of sample size formulas is the estimation of variance in the primary variables of interest in the study (Omair, Citation2014). Addressed this issue by stating that “one method of determining sample size is to specify margins of error for the items that are regarded as most vital to the survey, an estimation of the sample size needed is first made separately for each of these important items” when these calculations are completed, researchers will have a range of n’s, usually ranging from smaller n’s scaled for continuous variables, to large n’s for dichotomous or categorical variables. For categorical dependent variable, 5% margin of error is acceptable, and for continuous dependent variable 3% margin of error is acceptable (Krejcie & Morgan, Citation1970). The sample size was decided by using scientific statistical method. The formula that we used for determining sample size is the following:
Where: n = the total desired minimum sample size; N = total population (65,690) based on (CSA, Citation2007); Z = standardized normal deviation at the required confidence level that corresponds to 95% confidence interval equal to 1.96; d = the level of statistical significance (allowable error which is equal to 0.05), hence the dependent variable is categorical (Krejcie & Morgan, Citation1970); P = the proportion in the target population estimated to have characteristics being measured (From previous studies or studies in other comparable countries, i.e. 0.65 from Solomon, 2011; and Q = 1- P = 0.35)
Representative and reasonable number samples for the study is 348 sample units. From the total household samples, 2 additional households were considered for nonvoluntary respondents and finally 350 sample units were taken. Therefore, n = 350 was the minimum sample size of households for reliable results.
3.2.2. Sampling procedure
The choice of sampling technique (probability or nonprobability) depends on purpose of the study. So, the objective of this study is to estimate households’ WTP for improved SWM service and analysis factors that determine households’ WTP for better SWM services. For such a quantitative research, probability sampling technique is appropriate as compared to nonprobability sampling technique because samples drawn by using probability sampling techniques are more representative than nonprobability sampling techniques. Accordingly, multi stage random sampling technique was employed to address the objective of this study.
In the first step, Bahir Dar city was selected because of three major reasons: lack of background information about households’ WTP and its determinants for improved SWM services, the increment of solid waste disposal induced problems in the city and the presence of high rate of migration from rural areas in all directions, and these increases pressure to manage solid waste effectively in order to avoid outbreaks of diseases.
In the second stage, 17 Kebeles’Footnote1 of Bahir Dar city was stratified based on geographical location, i.e. inner (Kebele close to the center of the city), middle (Kebele located in the middle distance to the center) and periphery (Kebele located far from center of the city).
In the third step, a total of three Kebeles (one from each stratum) were selected. In the fourth step, 350 randomly selected urban households were allocated to the sample Kebeles using probability proportional to sample size.
In the fourth stage, using random sampling method select sample households from sampling frame. It is worth mentioning that the sampling units were households, not individuals, since if implemented, payments for improved SWM services would be from households, not individuals. The numbers of samples within each zone was determined based on respective proportional percentages of each zone’s number of households that is multiplied by total sample size with the ratio of zone total households.
As the first concern was to ensure sample representativeness of the population, the strategy adopted for the study was to stratify households by income groups. But this was very difficult since there is no published material available from relevant government organizations the time before. So we search for previous studies, which are largely unpublished but managed to accomplish a similar task. House ownership used as a major criterion to determine whether a certain household belonged to high, medium or low income groups (Ojok et al., Citation2014). Based on this households having their own house made from cement and related materials are classified as high income groups; those households having their own houses made from mud, wood and related materials are classified as middle income groups and households lived in rented houses from individuals, Kebelles or housing agency are classified as low income groups.
3.2.3. Source and method of data collection
To address the objective of this study, both primary and secondary data were collected. Quantitative primary data were gathered accompanied by face to face interview. On the other hand and key informant interview were also made as part of data collection method for qualitative primary data. Moreover, secondary data were collected from published and unpublished documents. The questionnaire for household survey was designed in two parts. The first section incorporates socio-economic characteristics of respondents and the second section contains CV scenario and household’s WTP for improved SWM services. Pretest with open-ended questions provide some information on the bounds of respondents’ WTP (Hoyos & Mariel, Citation2010). As a result, 20 households were randomly selected for pretest before the actual survey. Before going to pre-testing the questionnaire, two day training was given to four enumerators to well understand each question and on how they made interview and approach the respondents to get valid information. Emphasis was also given to consent of respondents on the training session. A pilot study was made for two consecutive days from three Kebelles (07, 13, and 02), and sixteen households were interviewed before the actual survey. In this phase all interviewers and the researcher himself have participated. However, it was made sure that all respondents were above the age of 18 years.
Depending on the result of preliminary survey, initial bids (6, 12 and 18 ETB/month) were determined by using open-ended CV format (Belhaj, Citation2003; Fentahun, Citation2014; Gebremariam, Citation2012; Kasaye, Citation2015; Tilahun et al., Citation2011). As a result, 6, 12 and 18 ETB per month followed by open-ended questions were randomly assigned to 350 sample households in the final survey. Questionnaires are design to get the most precise data for econometric analysis of households’ WTP; determinants of WTP and amount of WTP, and assessing solid waste The survey was conducted during the period of 2018 by translated the questionnaire in to local language “Amharic” for better understanding of both the respondents and enumerators. Finally, the cross sectional data were collected using carefully designed CV survey questionnaire. The design of the CV questionnaire used to elicit WTP of respondents was done following the recommendations of NOAA panel (Carson et al., Citation2001). which suggested a CVM survey questionnaire should include: (1) an introductory section which helps set the general context for the decision to be made; (2) a detailed description of the good to be offered to the respondent; (3) the institutional setting in which the good will be provided; (4) the manner in which the good will be paid for; (5) a method by which the survey elicits the respondent’s preferences with respect to the good; (6) debriefing questions about why respondents answered certain questions the way that they did; and (7) the collection of a set of respondent characteristics including attitudes, and demographic information.
3.3. Analytical methods
3.3.1. Mean willingness to pay/MWTP/
To estimate the WTP in this study, the threshold decision-making theory was employed where respondents were asked “yes” and “no” questions on their WTP and elicit a specific monetary value for “yes” responses (M. Hanemann et al., Citation1991). For open-ended CV survey responses from maximum WTP figures reported by the respondent can be simply be averaged to produce an estimate of MWTP.
Where: “Ti” is the reported maximum WTP amount by surveyed households and “n” is the sample size. The same thing for calculating means WTP, for each income groups of sample households:
Where: “Ki” is the reported maximum WTP amount by low, middle and high income groups and “” the number of households in low-, middle-, and high-income groups separately.
3.3.2. Statistical analysis
Descriptive statistics (percentages and frequencies, means and standard deviations) and econometric model were employed to analyze the collected data using statistical software (STATA versions 15). These were done after appropriate coding, edited, and register of collected data, and then enter the data into SPASS software. The objective of this study is to analyze determinants of households’ WTP decision for improved SWM services which has binary qualitative responses (1 for willing, 0 otherwise).
In analyzing the relationship between the selected socio-economic factors in determining the household WTP for improved SWM in Bahir Dar city choice models were used. Therefore, linear probability, binary logit and probit model are used to express and estimate the mathematical relationships between explanatory variables and the binary dependent variable which has qualitative responses. In linear probability model, the estimated probability of the dependent variable lies out of the interval unlike logit and probit model (Cameron & Trivedi, Citation2005). Most studies on household’s WTP cited in this study employed either a probit model for instance (Dagnew et al., Citation2012; Lunojo, Citation2016; Seth et al., Citation2014; SINHA, Citation2014) or logit model example see (Addai & Danso-Abbeam, Citation2014; Ali et al., Citation2012; Dauda et al., Citation2015; Dhokhikah et al., Citation2015), in estimating the factors influencing WTP for improved SWM depending on whether a random component is normally or logarithmically distributed (Bhattarai, Citation2015). How do logit models differ from probit models? This question is answered by (Park, Citation2015). The core difference lies in the distribution of the error term. In the logit model, error term is assumed to follow the standard logistic distribution; whereas, probit model is assumed to follow the standard normal distribution. With this minor difference, binary logit is preferable as compared to binary probit because of its mathematical simplicity and interpretation. Following this, binary logit model was employed involving the estimation of the probability of WTP for improved SWM services as a function of independent variables (
).
The study used the threshold decision-making theory proposed by (Kau & Hill, Citation1971) to analyze the determinants of WTP for improved SWM services by household heads. The theory points out the fact that when the individual is faced with a situation to take a decision in this case to pay for improved waste management services or not to pay he/she has a reaction threshold, which is dependent on a certain set of factors. As such, at a certain value of stimulus below the threshold, no reaction is observed while at the critical threshold value, a reaction is stimulated. Such phenomena are generally modeled using the relationship;
Where is equal to one when a choice is made to pay for improved waste management services and zero otherwise; this means
EquationEquation (4)4
4 represents a binary choice model involving the estimation of the probability of WTP for improved waste management services
as a function of independent variables
. Mathematically, this is represented as;
Where is the observed response for the ith observation of the response variable,
. This means that
for a household head who is willing to pay for improved waste management services and
for a household head that is not willing to pay for improved waste management services.
is a set of independent variables such as literacy, monthly income, age, marital status, housing arrangement, and quantity of waste generated, gender, associated with the ith individual, which determine the probability of willing to pay for improved waste management services (P). The function F may take the form of a normal, logistic, or probability function.
Since the model is nonlinear, the parameters are not necessarily a measure of change of probability for a unit change in covariant. Logit model is related to the odds for a binary outcome. That means the probability of the outcome is measured by the odds of occurrence of an event. Usually, the logit model is written as log-odds ratio. The odds-ratio is thus given by:
According to (Greene & Hensher, Citation2003), the model is a regression of the conditional expectation of on giving;
Where Pi denotes the probability that the ith household WTP and Zi is a linear function of “n” explanatory variables (X), and is expressed as following (Cameron & Trivedi, Citation2005; Gujarati & Porter, Citation1999; Wooldridge, Citation2010):
Where: β0 is the constant term, βi is coefficients of explanatory variables, Xi explanatory variables and Ui is the error term.
The βi tells us how the log-odds in favor of willing households change as the independent variables change. The odds to be used can be defined as the ratio of the probability that a household is WTP (Pi) to the probability that he/she is not WTP (1—Pi), i.e. finally the model is specified as follows (Cameron & Trivedi, Citation2005; Gujarati & Porter, Citation1999; Wooldridge, Citation2010):
Based on review of previous empirical studies (Aklilu, Citation2002; Amfo-Otu et al., Citation2012; Hagos et al., Citation2013; Nkansah et al., Citation2015; Thirumarpan & Dilsath, Citation2016), household socio-economic characteristics and attributes of SWM which are hypothesized to affect urban households’ WTP for improved SWM service were identified (Table ).
Table 1. CV Formats and Econometric models used for analysis
Table 2. Definition, descriptive statistics and expected sign of variables
Table 3. WTP for improved SWM services in Bahir Dar city
4. Result and discussion
The minimum household size is 1 while the maximum is 9 and the mean household size was found to be 4.18 which is less than the National mean family size of 5 (CSA, Citation2007). The minimum number of children in a household is 0 while the maximum is 3 and the mean is 1.83 which is approximately on average households in Bahir Dar city have 2 children (age less than equal to 15 years).
The survey result shows 165(47.14%) of the households interviewed were male and 185(52.86%) were females. This study has more female respondents than males and this may be a good chance to get reliable data about households actual WTP for improved solid waste management services since traditionally females are more concern about their environment than males because they are responsible to general hygiene of the house, i.e. house cleaning, refuse disposal, washing and cooking and this would tell more on the outcome of their effort.
In this survey, 255 households which are 72.86% of the respondents reported that they were the head of the households. About 46.67% of the respondents were male while 53.33% were female. With regard to marital status, 80.9% of respondents said they were married while 19.1% said they were not (i.e. not married, widowed and divorced). The youngest respondent was 23 years of age while the oldest was 71 with mean value of 49 years age.
Education is the most important variable in this study, because education is always considered as a crucial factor to achieve higher degree of awareness for households about SWM services. As we can be seen from the Table about 70, 91, and 123 of the respondents have a basic education, secondary, tertiary and above tertiary education levels respectively and a mean year of education was 6.23 years schooling. While the illiteracy rate is 18.85% (66 households were did not read and write) and less than the national and regional illiteracy rate of 35% and 30% respectively (CSA, Citation2007). It is clear from the table that WTP for improved solid waste supply services and households level of education are positively related.
4.1. WTP for improved SWM service
As W. Hanemann and Kanninen (Citation1996) recommended, prior to the elicitation question, individuals are asked if they would pay anything. As a result, yes or no questions were designed to assess the WTP status of the respondents for improved SWM services. The survey result indicated that 86.3% of sample respondents were WTP for improved SWM services as shown on the Table .
The above table depicts the households WTP belonging to different income group stratifications based on criteria explained in the previous sections. In total 302 households were WTP, and from the total households who were WTP for improved SWM supply 116, 110, and 76 households from low income, middle and high income groups respectively. So, it is clear from the table that WTPs were affordable by households depending upon their income level rather to apply all generators pay equal costs principle. Hence it is clear that these socioeconomic activities generate income as well as wastes and this also shows WTP amount depending on ability to pay.
Based on number of households who were not willing to cooperate with the government by cost sharing for better SWM, households who have been in low income groups were greater than middle as well as higher income groups, and also middle income groups were greater than higher income group households. Out of 86 households in low income groups, 21(24.42%) households WTP for better solid waste service supply. Similarly out of 140 households in middle income groups and 124 households from high-income groups, 18(12.86%) and 9(7.25%) households were WTP for the proposed SWM improvement plan respectively. These shows that households economic status (ability to pay) for such service provision must take as consideration rather to apply all generators pay equal costs principle. However, this study result was in line with a study done in Ethiopia (Jimma town) which was 83.5% (Batu & Fikadu Tolosa, Citation2016), but higher than studies done in Tanzania 63% (Mussa, Citation2015), South east Nigeria 64.4% (Oyawole et al., Citation2016), Ghana 57% (Awunyo-Vitor et al., Citation2013), Nepal 61% (Maskey & Singh, Citation2017), and Ethiopia (Addis Ababa city) 91.02% (Amiga, Citation2002) which was and Ethiopia (Injibara town) 81.06% (Mulat et al., Citation2019). The possible reason might be due to difference in study areas, period, design and demography.
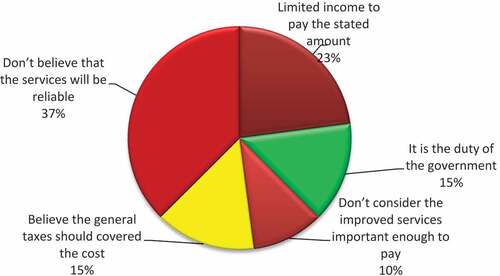
While from 350 sample households, 48(13.7%) of the respondents were not WTP anything at all for improved SWM services. So, those respondents were asked to list out their major reasons. The result indicated that majority of the respondents mentioned shortage of income to pay the stated amount 11(22.92%) and the trust of the stated project to be implemented 18(37.5%) as a major reason. Whereas, the remaining respondents listed out it is the duty of the government 7(14.58%), believe the general taxes should covered the cost 7(14.58%) and do not consider the improved services important enough to pay 5(10.42%) as a reason for not WTP (Figure ). Following this explanation, one and one half bounded CVM followed by open-ended question was used for this study to elicit the households’ WTP. Finally, the result demonstrated that the mean and mode of their WTP is 13.10 ETB ($0.45) and 8 ETB, respectively. This implies that the respondents’ average WTP is much greater than the current SWM service charge (8 ETB/month) by 5.10 ETB. This indicates that the current SWM service charge is not demand oriented. As a result, demand-based SWM service increase the revenue stream of the municipality to improve the services supply as well as satisfaction level of urban households. Consequently, demand based SWM service should be designed and implemented in Bahir Dar city. The result of this study was less than a study done in Nepal ($0.72) (Maskey & Singh, Citation2017), Ethiopia (Injibara and Mekelle) which were 29.7 ETB and 11.89 ETB respectively (Dagnew et al., Citation2012; Mulat et al., Citation2019), and greater than a study done in Ethiopia (Addis Ababa) which is 7.07ETB (Amiga, Citation2002).
Figure 3. Reasons for not WTP for better SWM services.
4.2. Total WTP for improved solid waste management
One of the main steps in analyzing data obtained from CVM is estimating and aggregating benefit. In line with this we estimated the total WTP and total revenue from our survey results. The result of the open-ended questions was categorized into class marks following the steps to convert ungrouped frequency distribution in data to grouped frequency distribution. The class mark of each class limit was calculated following statistical procedures. Next to this, the TWTP of households for improved SWM service was estimated based on the proportion (willing versus not willing households). The survey covered 350 sample households out of 65,690 households in the study area because of reasons stated in the above sections. The results of the study show that 302(86.3%) of households were WTP for improved SWM services. Based on our estimation, 56,690 households were WTP for SWM service (0.863*65,690).
Households who were WTP for improved MSWM services were further asked how much money they were willing to pay per month and the responses from 302 households were summarized in table below. From the class intervals for the WTP amounts, the class mark (midpoint of WTP amounts) was calculated and the results presented in Table (col. 1). The total number of households willing to pay (col. 4) was obtained by taking the proportion of sample households falling in that boundary (col. 2) and multiplying by the total number of households willing to pay for improved SWM services. The number of households in each income group (cols. 5, 7, and 9 for low, middle and high income groups respectively) were obtained based on total proportions (col.2), the stated amounts of WTP for each income group and the total households WTP in that class boundary (col. 4). To obtain the WTP for the different household income groups (cols. 6, 8, and 10 for low, middle and high income groups respectively), the number of households in each WTP class boundary of each income group (cols. 5, 7, and 9) was multiplied by the corresponding class mark (col. 1). The total WTP (col. 11) was the summation of WTP of the different income groups (cols. 6, 8, and 10) in the different class boundaries (which is the same as multiplying col. (4) and the corresponding class mark in col. (1). Finally, the total willingness to pay (TWTP) was obtained by adding the WTP of the total households in each class mark. The result indicated that the TWTP is 494,587 ETB/month (Table ) (col. 11). The result of this study is much higher than the amount of money collected by Bahir Dar city municipality (335,000 ETB/month). TWTP across high, middle and low income groups were also calculated and result indicated that in each class mark was varying by income groups. The TWTP of the low, middle and high income group were 124,464.5, 18,014.5, and 189,977 ETB/month, respectively.
Table 4. Estimating total WTP for the different household income groups
The result indicated in the above Table, 125 (41.4%), of households were WTP an approximately 3.5 ETB, 112 (37.1%) households were WTP an approximate average of 9.5 ETB, 37 (12.2%) of them were WTP an average of 15.5 ETB, and 28 (9.3%) were WTP on avarage 20ETB per month for better SWM services. As we seen from the above table, TWTP first increase as midpoint WTP increase and reaches maximum when the price is 9.5 ETB/month, and after that it decreases as price increases due to small number of households WTP that amount.
The below demand curve can be derived in terms of the total number of households and their associated maximum WTP bids. Any point on the curve indicates all the households that prefer the improved SWM service at the corresponding WTP value. The area under the curve shows the total value of consumers’ surplus. Using a simple areas formula for right angle triangle, we calculated the expected approximate total consumer surplusFootnote2 of 220,000 ETB (1/2*20*22,000), assuming each household will get door to door SWM services on proposed schedule. This shows the economic benefit of those consumers, by willing and able to pay for services relative to its market price.
Figure 4. Estimated Demand curve for improved SWM services Source: survey results, 2018.
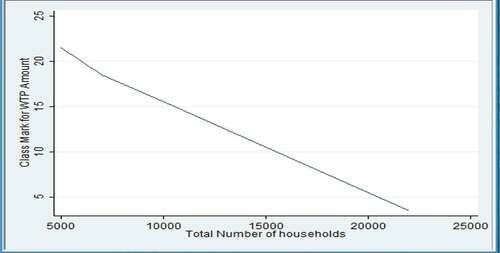
As the monthly payment (class mark) increases, the number of households WTP that price declines (see column, 3) in Table . This relationship can be more easily observed by deriving a demand curve for the improved SWM. For this we measure the class marks along the vertical axis and the number of households WTP at least that class mark (WTP midpoint) per month along the horizontal axis. We note from Figure that the demand curve is negatively sloped indicating that, like most economic goods, the demand for improved SWM services will decrease with increasing SWM services charges, keeping all other things constant.
4.3. Estimating total expected revenue
This section estimates the total revenue/TR/Footnote3 that will accrue at different tariffs per households per month for improved SWM services. Again, use is made of extrapolation of the sample results to apply to the population. Total revenue (TR) at various prices that households in Bahir Dar city are WTP is calculated. To make the aggregation, we used the mean WTP for each income groups calculated based on Equationequation 33
3 . Then TR is the sum of low, middle and high income groups’ total revenue to make aggregation (Table ).
Table 5. Expected Aggregate Revenue
Table reports on % of households from sample WTP by income group established in this study, the corresponding total number of households in the population by income group, the number of households from population WTP by income group, mean WTP by income group and then the amount of expected revenue (in ETB) by income groups. For example, to obtain aggregate monthly revenue of ETB 361,599 for the high income group, firstly we calculate the 92.74% of the total number of households in population from that particular income group (since the study itself reveals that 92.74% of the households from high income group are WTP). In the present study 23,278 households belong to high income group and 92.74% of 23,278 are 21,588. It means that 21,588 households from high income group are WTP if we consider the total population. Then multiplying this number, i.e. 21,588 with the mean WTP, i.e. ETB 16.75 we get the monthly expected revenue from that income group, i.e. ETB 361,599. In this way we can calculate the expected revenue from other income groups. Then taking the sum of the expected revenues from the three different income groups we get the aggregate revenue to be ETB 738,178.25. Since households are not charged for waste disposal based on willingness and ability to pay, the estimated aggregate revenue is proxy for the potential revenue that can be realized from user charges.
Table 6. Determinants of Households’ for better SWM services
Annual summarized report of SWM in Bahir Dar city, carried out by the office of the city Sanitation, Beautification and Parks development department in Jun 2017, the amount of budget the city municipality spent on MSWM of Bahir Dar city in the financial year 2016/2017 was ETB 5,440,000. These were operational costs only, involving solid waste collection, transportation and disposal activities for total collection coverage of 52% (Lohri et al., Citation2014). This implied that for 100% coverage, the total expenditure for SWM would be ETB 10,461,538. At the lowest class mark of 3.5 ETB per month (midpoint WTP), annual payment from a household would be ETB 2,758,980 (3.5*65,690*12) per annum, which implies 51% cost recovery. But this is only if the municipality charges the lowest price to all households. And if the different income groups are to be charged, their mean WTP, and then it means that amount collected from a household in low income groups with a mean value of 6 ETB will be 72 ETB per annum. While for the middle income groups with a mean value of 13.25 ETB, the annual collection from a single household will be 159 ETB and for a household within a high income groups with a mean value of 16.75 ETB/month the annual collection will be 194 ETB respectively. We must remember that the values given by households in the survey are not for the existing service but it is for the hypothetical improvement. There is also a possibility of cross subsidy in case some households are unable to pay since the middle and high income households are giving higher WTP amounts than low income groups.
4.4. Factors associated with WTP for improved solid waste management
Generally, to test for multicollinearity, a correlation matrixFootnote4 was employed. From the correlation matrix, it can be seen that multicollinearity is not a problem in these data, since none of the independent variables have a correlation coefficient of at least 0.8 with another variable (also mean VIF = 1.25 < 10 and correlation coefficient matrix shows that the highest R2 is 0.4745 ≤ 0.75). In line with this, an important test for household survey data is testing hetroscedasticity problem since the p-value associated to a Heteroscedasticity test falls below a certain threshold (0.05 for example) which is 0.039, we would conclude that the data is significantly heteroscedastic. The data has no such problem and specification problems of each model.
The likelihood ratio chi-square of 87.38 with a p value of 0.0000 tells us that our model as a whole is statistically significant, as compared to the null model with no predictors. The critical value for χ2 (13) distribution with α = 0.01 is 3.56. This means that the critical χ2 (13) value less than the LR χ2 (13) (87.38 > 3.56), we reject the null hypothesis and we conclude that all independent variables together have a significant impact on WTP. The Pseudo R-square was found to be 0.7879 indicates that about 78.8% of the variation is explained by explanatory variables included in the model. However, little emphasis is placed on this since “goodness of fit” is not as important compared with the statistical and economic importance of the explanatory variables (Wooldridge, Citation2010 p. 575). The likelihood ratio index (LRI) is also used to measure goodness of fit for the logit model which is equivalent to R2 in a conventional OLS regression model. The computed results indicate that the model is statistically acceptable as 78.79% of the variation is explained by explanatory variables included in the model (Table ).
The determinants of the WTP for improved SWM system have been widely suggested to have significant influence on the willingness of the respondents to pay for waste collection. Table shows the sign, magnitude, statistical tests and significance level of each explanatory variable. Out of the 13 variables hypothesized to influence WTP of the respondents, four variables were found to be statistically significant at less than 1% significant level. These variables are educational level of household head, monthly aggregate income, quantity of waste generated per week and responsibility of solid waste management. On the other hand, sex of household head, access to SWM service and number of children in the household were significant at less than 5% significant level and other variables were not significant.
Even though sex of the respondents was hypothesized negatively, the result of the model indicated that the variable had statistically significant positive effect on WTP at less 5% significant levels. This implies that female respondents are more WTP for improved SWM than male respondents (Table ). This is due to the fact that women are responsible to clean the house and dispose of the wastes. The odds ratio result confirms that the WTP of female respondents were 0.001 times more than male respondents WTP for improved SWM services and thus negative sign result is confirms the findings of Lunojo (Citation2016), Adenike and Titus (Citation2009), and Adebo and Ajewole (Citation2012), who also found sex to be an important in determining households WTP amount for improved solid waste management services.
As expected, educational level of the respondents was found to have statistically significant positive effect on households’ WTP. This implies that increase in the respondent’s level of education increases the probability of household’s WTP. This is because educated respondents clearly understand all the threats, diseases and damages caused by improper SWM. This result shows that household’s educational level is an important determinant of WTP. The result of the model suggests that as the respondents’ level of education increase by a year, the probability of WTP also increases by a factor of 27.937 (Table ). This finding that persons who have been educated at higher levels are WTP higher values for SWM services improvement confirms the findings of other works done Amiga (Citation2002), Yusuf et al. (Citation2007), Anjum (Citation2013), and Rahji and Oloruntoba (Citation2009). The possible explanation may be due to the fact that educated people can understand easily the consequences of mismanagement of waste.
As expected, Monthly aggregate income had statistically significant positive effect on households’ WTP. This implies that the higher the income of the respondents, the maximum amount they are WTP for improved SWM services. This also proves that the amount high income respondents are WTP is expected to be more in comparison to lower income respondents. This is because having more income increases the purchasing power of respondents. The result of the model indicated that as monthly aggregate income of the respondents’ increases by one ETB, his/her WTP will be increased by a factor of 1.002 (Table ). This result concede with findings of Yusuf et al. (Citation2007), Ezebilo (Citation2013), and Rahji and Oloruntoba (Citation2009) also showed a positive correlation between income and respondents willingness to pay. Theoretically they explained that the participation of people for SWM in higher income areas is high while the participation in lower income areas is low. This shows the correlation of income with participation for SWM services. This result is also in line with the theory and other research results. According Kassa and Teshome (Citation2016) showed that contractors with higher paid up capital, i.e., having high income returns showed a higher WTP for SWM services. This shows a positive relationship between income and WTP for improved SWM services.
Quantity of solid waste generated per week by shopping plastic bag was positively hypothesized with households’ WTP. The result of the model indicated that the variable was found to have positive and statistically significant effect at less than 1% significant level. This reveals that the higher the quantity of waste generated, the higher the probability of the households’ WTP for improved SWM services. The odds ratio result suggests that if the households’ quantity of waste generated per week increases by one plastic bag, the probability of WTP increase by a factor of 8.547 for better SWM services. This shows that respondents with higher quantity of solid waste generated are WTP for such services than others who generated low quantity per week (Table ). This finding was consistent with studies conducted by Amiga (Citation2002); Fissha (Citation2006); and (Khattak et al., Citation2009). This could be due to difficulties to dispose larger amount of waste and it needs high cost.
The number of children in the household was negatively hypothesized with households’ WTP for improved SWM service. As expected, the variable had statistically negative significant relationship with households’ WTP. This indicates that increase in the number of children in the household leads to increase in food and nonfood expenditure. Consequently, more income is needed to full fill minimum requirements of the household members. This creates negative pressure on the households’ WTP for improved SWM services (Table ). This is similar to studies done in different parts of the world such as Ethiopia (Dagnew et al., Citation2012; Mulat et al., Citation2019); Nigeria (Oyawole et al., Citation2016), Nepal (Maskey & Singh, Citation2017), and Ghana (Awunyo-Vitor et al., Citation2013).Tis might be due to the fact that a consumer with higher number of children has a greater demand for SWM and more WTP.
As expected, access to SWM service had positive effect on households’ WTP for improved SWM. This indicates that access to MSWM service create awareness for the respondents about the environmental and health effect of SWM. So, this service triggers the households’ WTP for better SWM service. The result of the model indicated that the WTP of SWM service users are 10.651 times more than nonusers of SWM (Table ). This result is similar with studies conducted in Ethiopia (Batu & Fikadu Tolosa, Citation2016; Woretaw et al., Citation2017). This may be due to the rational behavior of customers, as their interest is maximizing utility or consumers are willing to utilize and pay for those services and goods that maximize their utility.
As expected, responsibility of SWM had statistically significant positive effect on households’ WTP because the perceptions of the respondents about the responsible bodies for SWM increase the households’ WTP. As a result, the households who perceived that we are responsible for SWM disposal play a great role to enhance households’ WTP for improved SWM. The odds ratio result suggests that if respondents assume themselves are responsible for SWM increase households’ WTP by 6.250 times more than those who are not take the responsibility to clean their living areas (Table ). This shows that the SWM responsible people are WTP and it also increases their concern about their surrounding environment. This show that the SWM responsible people are WTP and it also increases their concern about their surrounding environment and esthetic beauty. In accordance to theory and logic they will be aware of all the threats, diseases and damages that are caused because of improper management. To have such sort of activities we need to aware our population (Maskey & Singh, Citation2017; Mulat et al., Citation2019).
5. Conclusion
This study was conducted to elicit households’ WTP for improved SWM in Bahir Dar City using one and one half bounded CV followed by open-ended question. The result indicated that 86.3% of sample respondents were willing to pay for improved SWM services with the mean WTP of 13.10 ETB for the whole sample while for low, middle and high income groups the corresponding figures are 6.00, 13.25 and 16.75 Birr per month, respectively. This implies that the respondents’ average WTP is much higher than the current SWM service charge. As a result, SWM service charges should be set at a level that does not encourage illegal dumping and maximize cost recovery. Therefore, this study recommends that the proposed sanitation fees need to be revised before they are put into operation based on willingness and ability to pay. The expected revenue that city municipality will collect from low, middle and high income groups are ETB 364,731.25, 252,950.25, and 85,596 respectively per month and total of ETB 703,277.5 per month (8,439,330 ETB annually). When this revenue properly collected it covers 92.3% of cost recover for 100% solid waste collection coverage in the study area. It also attempts to identify significant explanatory variables that are assumed to influence households’ WTP decision using binary logit model. The result demonstrated that education level of household head, monthly aggregate income, and quantity of waste generated per week, access to SWM service and responsibility of SWM had statistically significant positive effect on households’ WTP. This implies that the above variables increase the probability of households’ WTP for improved SWM services unlike negatively related variables (sex of household head and number of children). The implications of this research finding are that the municipality of Bahir Dar city should consider these significant variables to design and implement improved SWM services.
Competing interests
The authors declares no competing interests.
Cover image
Source: Author.
Additional information
Funding
Notes on contributors
Kassahun Tassie
Kassahun Tassie holds bachelor’s degree in Economics from Mekelle University, Ethiopia in July/2010. After this he was done in different agriculture and trade development and regulation offices in Amhara National Region State. After two years’ experience he got in country scholarship in Bahir Dar University and now he holds master’s degree in development economics in October/2016. The author joined Department of Agricultural Economics in CAES of Bahir Dar University since 2016. He holds certificates on Education quality auditors (HERQA, 2019); E-learning approaches (Bahir Dar University, 2019); Effective teaching skill (Jhpiego, Ethiopia, 2018); higher diploma program (BDU, 2018). Kassahun has a keen interest to work in the areas of economic valuation, food security, livelihood analysis, impact analysis, choice experiment, poverty analysis and determinates of adoption are the author’s interest areas of research. He aspires to be involved in collaborations and partnerships among experts and/or institutions that target working on community development activities especially on higher institution education.
Notes
1. The lowest governmental administrative level in the study area.
2. “Consumer surplus” is an economic measure of consumer’s benefit, which is calculated by analyzing the difference between what consumers are willing and able to pay for a good/services relative to its market price.
3. Total Revenue (TR) is the aggregated money that the city municipality will be collected by providing the improved SWM services for the residents based on willingness and ability to pay (Q*P).
4. This study could employ the more preferred Variance Inflation Factor (VIF) to test for multicollinearity for logit model and the study ran an Ordered Probit Model which is not compatible with testing for VIF. Under this circumstance, the correlation matrix was the best available technique to test for multicollinearity for an ordered probit model.
References
- Act, Clean Air, Act, Recovery, & Act, Recovery. (2006). Environmental protection agency (EPA). Report on Carcinogens, 168. U.S. Department of Health and Human Services.
- Addai, K. N., & Danso-Abbeam, G. (2014). Determinants of willingness to pay for improved solid waste management in Dunkwa-on-Offin, Ghana. Journal of Agriculture and Environmental Sciences, 3(1), 01–26. http://hdl.handle.net/123456789/1108
- Adebo, G. M., & Ajewole, O. C. (2012). Gender and the urban environment: Analysis of willingness to pay for waste management disposal in Ekiti-State, Nigeria. American International Journal of Contemporary Research, 2(5), 228–236.
- Adenike, A. A., & Titus, O. B. (2009). Determinants of willingness to pay for improved water supply in osogbo metropolis; Osun State, Nigeria. Research Journal of Social Sciences, 4, 1–6.
- Afroz, R., Hanaki, K., & Hasegawa-Kurisu, K. (2009). Willingness to pay for waste management improvement in Dhaka city, Bangladesh. Journal of Environmental Management, 90(1), 492–503. https://doi.org/10.1016/j.jenvman.2007.12.012
- Akhtar, S., Ahmad, A. S., Qureshi, M. I., & Shahraz, S. (2017). Households willingness to pay for improved solid waste management. Archive of SID. Doi: 10.22034/gjesm.2017.03.02.003
- Aklilu, A. (2002). Households’ willingness to pay for improved solid waste management: The case of Addis Ababa.
- Alam, P., & Ahmade, K. (2013). Impact of solid waste on health and the environment. International Journal of Sustainable Development and Green Economics (IJSDGE), 2(1), 165–168.
- Albertini, A., & Cooper, J. (2000). Application of contingent valuation method in developing countries. Economic and Social Development Paper, (146), 49-92.
- Ali, H., Ali, N., Ibrahim, M., Ahmad, S., & Yaacob, S. (2012). Solid waste management and the willingness to pay for improved services towards achieving sustainable living. Advances in Natural and Applied Sciences, 6(1), 52–61. doi: GALE/A283456189
- Amfo-Otu, R., Debrah, W. E., Adjei, K. P., & Akpah-Yeboah, S. (2012). Willingness to pay for solid waste collection in semi-rural Ghana: A Logit estimation. International Journal of Multidisciplinary Research, 2(7), 40–49.
- Amiga, A. (2002). Households’ willingness to pay for improved solid waste management: the case of addis abab. Addis Ababa University.
- Anjum, R. (2013). Willingness to pay for solid waste management services: A case study of Islamabad. Pakistan Institute of Development Economics:.
- AOIKE, U. (2019). Household waste and local solid waste collection in Niamey, Republic of Niger. Kyoto University Research Information Repository.
- Awunyo-Vitor, D., Ishak, S., & Seidu, J. G. (2013). Urban Households‘ Willingness to Pay for Improved Solid Waste Disposal Services in Kumasi Metropolis, Ghana. Urban Studies Research 2013 1–8 https://doi.org/10.1155/2013/659425
- Basiru, H. A. (2017). Economic value and determinants of effective household solid waste collection services in Kano, Nigeria. Universiti Putra Malaysia.
- Batu, M. M., & Fikadu Tolosa, E. A. (2016). Determinants of households’ willingness to pay for improved solid waste management in Ethiopia: The case study of Jimma Town. J Environ Earth Sci, 6 (2224–3216),75.
- Belhaj, M. (2003). Estimating the benefits of clean air contingent valuation and hedonic price methods. International Journal of Global Environmental Issues, 3(1), 30–46. https://doi.org/10.1504/IJGENVI.2003.002410
- Bhattarai, K. (2015). Households’ willingness to pay for improved solid waste management in Banepa municipality, Nepal. Environment and Natural Resources Journal, 13(2), 14–25. https://pho2.tci-thaijo.org/index.php/ennrj/article/review/70294
- Bogale, A., & Urgessa, B. (2012). Households’ willingness to pay for improved rural water service provision: Application of contingent valuation method in eastern Ethiopia. Journal of Human Ecology, 38(2), 145–154. https://doi.org/10.1080/09709274.2012.11906483
- Cameron, A. C., & Trivedi, P. K. (2005). Microeconometrics: Methods and applications: Cambridge university press.
- Carson, R. T., & Czajkowski, M. (2014). The discrete choice experiment approach to environmental contingent valuation. In Stephane, M., & Andrew, D. (Eds.), Handbook of choice modelling: Edward Elgar Publishing.
- Carson, R. T., Flores, N. E., & Meade, N. F. (2001). Contingent valuation: Controversies and evidence. Environmental and Resource Economics, 19(2), 173–210. https://doi.org/10.1023/A:1011128332243
- Cheever, M. (2011). Environmental Policy review 2011: Waste management in Ethiopia. Environmental Policy Review: Key Issues in Ethiopia, 133. http://web.colby.edu/eastafricaupdate
- Chien, Y.-L., Huang, C. J., & Shaw, D. (2005). A general model of starting point bias in double-bounded dichotomous contingent valuation surveys. Journal of Environmental Economics and Management, 50(2), 362–377. https://doi.org/10.1016/j.jeem.2005.01.002
- Cho, S.-H., Newman, D. H., & Bowker, J. M. (2005). Measuring rural homeowners’ willingness to pay for land conservation easements. Forest Policy and Economics, 7(5), 757–770. https://doi.org/10.1016/j.forpol.2005.03.007
- Cooper, J. C., Hanemann, M., & Signorello, G. (2002). One-and-one-half-bound dichotomous choice contingent valuation. The Review of Economics and Statistics, 84(4), 742–750. https://doi.org/10.1162/003465302760556549
- CSA. (2007). Population and housing census report. Addis Ababa: Central statistical agency.
- Dagnew, H., Alemu, M., & Zenebe, G. (2012). Households’ willingness to pay for improved urban waste management in Mekelle City, Ethiopia. Environment for development discussion paper-resources for the future (RFF)(12–16). Resources for the Future.
- Damtew, Y. T., & Desta, B. N. (2015). Micro and small enterprises in solid waste management: Experience of selected cities and towns in Ethiopia: A review. Pollution, 1(4), 427–461. http://www.researchgate.net/publication/282734757
- Das, S., & Gogoi, K. (2014). Community participation for urban solid waste management: A study on tinsukia municipality of Assam. VU Digital Repository.
- Dauda, S. A., Yacob, M. R., & Radam, A. (2015). Household’s willingness to pay for heterogeneous attributes of drinking water quality and services improvement: An application of choice experiment. Applied Water Science, 5(3), 253–259. https://doi.org/10.1007/s13201-014-0186-6
- Dhokhikah, Y., Trihadiningrum, Y., & Sunaryo, S. (2015). Community participation in household solid waste reduction in Surabaya, Indonesia. Resources, Conservation and Recycling, 102, 153–162. https://doi.org/10.1016/j.resconrec.2015.06.013
- Dimitre, G. (2011). The Changing Dynamics of Urbanization in Developing Countries.
- Ebistu, T. A., & Minale, A. S. (2013). Solid waste dumping site suitability analysis using geographic information system (GIS) and remote sensing for Bahir Dar Town, north western Ethiopia. African Journal of Environmental Science and Technology, 7(11), 976–989. DOI: 10.5897/AJEST2013.1589
- Ejaz, N., Akhtar, N., Hashmi, H., & Naeem, U. A. (2010). Environmental impacts of improper solid waste management in developing countries: A case study of Rawalpindi city. The Sustainable World, 142, 379–387. doi: 10.2495/SW100351
- Ezeah, C., Fazakerley, J. A., & Roberts, C. L. (2013). Emerging trends in informal sector recycling in developing and transition countries. Waste Management, 33(11), 2509–2519. https://doi.org/10.1016/j.wasman.2013.06.020
- Ezebilo, E. E. (2013). Willingness to pay for improved residential waste management in a developing country. International Journal of Environmental Science and Technology, 10(3), 413–422. https://doi.org/10.1007/s13762-012-0171-2
- Ezebilo, E. E., & Animasaun, E. D. (2011). Economic valuation of private sector waste management services. Journal of Sustainable Development, 4(4), 38. https://doi.org/10.5539/jsd.v4n4p38
- Fenta, B. (2020). Feasibility study of municipal solid waste to energy based on composition and quantity of waste; case of Bahir Dar city. Dahir Dar University institutional Repository system.
- Fenta, B. A. (2017). Waste management in the case of Bahir Dar City near lake Tana shore in northwestern Ethiopia: A review. African Journal of Environmental Science and Technology, 11(8), 393–412. https://doi.org/10.5897/AJEST2017.2340
- Fentahun, W. (2014). Households’demand for improved water supply service in rural areas of Ankasha Woreda, Amhara Regional State In Ethiopia. African Journal of Environmental science and Technology.
- Fikreyesus, D. (2011). Ethiopia Solid Waste & Landfill. Community Development Research.
- Fissha, M. (2006). Household demand for improved water service in urban areas: The case of Addis Ababa, Ethiopia.
- Gebremariam, G. G. (2012). Households’willingness to pay for soil conservation practices in Adwa Woreda, Ethiopia: A contingent valuation study. AgEcon SEARCH.
- Greene, W. H., & Hensher, D. A. (2003). A latent class model for discrete choice analysis: Contrasts with mixed logit. Transportation Research Part B: Methodological, 37(8), 681–698. https://doi.org/10.1016/S0191-2615(02)00046-2
- Gujarati, D. N., & Porter, D. C. (1999). Essentials of econometrics. The McGraw-Hill Companies.
- Hagos, D., Mekonnen, A., & Gebreegziabher, Z. (2013). Households willingness to pay for improved urban solid waste management: The case of Mekelle city, Ethiopia. Ethiopian Journal of Economics, 22(1), 107–138. http://www.rff.org/---/EfD-DP-12-06.pdf
- Han, F., Yang, Z., Wang, H., & Xu, X. (2011). Estimating willingness to pay for environment conservation: A contingent valuation study of kanas nature reserve, Xinjiang, China. Environmental Monitoring and Assessment, 180(1), 451–459. https://doi.org/10.1007/s10661-010-1798-4
- Hanemann, M., Loomis, J., & Kanninen, B. (1991). Statistical efficiency of double-bounded dichotomous choice contingent valuation. American Journal of Agricultural Economics, 73(4), 1255–1263. https://doi.org/10.2307/1242453
- Hanemann, W. M., & Kanninen, B. (1996). The statistical analysis of discrete response CV data. Department of agricultural and resource economics working paper no. 798. University of California, Berkeley.
- Hoang, M. G., Fujiwara, T., Pham Phu, S. T., & Nguyen Thi, K. T. (2017). Predicting waste generation using Bayesian model averaging. Global Journal of Environmental Science and Management, 3(4), 385–402. DOI: 10.22034/gjesm.2017.03.04.005
- Hoyos, D., & Mariel, P. (2010). Contingent valuation: Past, present and future. Prague Economic Papers, 19(4), 329–343. https://doi.org/10.18267/j.pep.380
- Jantzen, J. (2006). The economic value of natural and environmental resources. Institute for Applied Environmental Economics, Nedherland.
- Jones, N., Evangelinos, K., Halvadakis, C. P., Iosifides, T., & Sophoulis, C. M. (2010). Social factors influencing perceptions and willingness to pay for a market-based policy aiming on solid waste management. Resources, Conservation and Recycling, 54(9), 533–540. https://doi.org/10.1016/j.resconrec.2009.10.010
- Kalbali, E., Borazjani, M. A., Kavand, H., & Soltani, S. (2014). Factors affecting the willingness to pay of ghorogh forest park visitors in Iran. International Journal of Plant, Animal and Environmental Sciences, 4(3), 368–373. http://www.ijpaes.com/---/640pdf.pdf
- Kasaye, B. (2015). Farmers willingness to pay for improved soil conservation practices on communal lands in Ethiopia. JBEM/NBL.
- Kassa, B. A., & Teshome, Y. M. (2016). Smallholder farmer’s willingness to pay for improved soil and water conservation practice: A contingent valuation study in Abaro-Toga Watershed Ethiopia. American Journal of Business, Economics and Management, 3 (6),432.
- Kau, P., & Hill, L. (1971). Analysis of purchasing decision with multivariate probit. American Journal of Agricultural Economics, 53(5), 882–883. https://doi.org/10.2307/1238126
- Kaza, S., Yao, L., Bhada-Tata, P., & Van Woerden, F. (2018). What a waste 2.0: A global snapshot of solid waste management to 2050: The World Bank.
- Khajuria, A., Yamamoto, Y., & Morioka, T. (2010). Estimation of municipal solid waste generation and landfill area in Asian developing countries. Journal of Environmental Biology, 31(5), 649–654.
- Khalid, A. R. (2008). Economic valuation of the goods and services of coastal habitats. The Regional Training Workshop, March 24 – 28, 2008.
- Khattak, N., Rehman, U., Khan, J., & Ahmad, I. (2009). An analysis of willingness to pay for better solid waste management services in urban areas of district Peshawar. Munich Personal RePEC Archive.
- Koyachew, E. K. (2016). The problem of solid waste management and people awareness on appropriate solid waste disposal in Bahir Dar City: Amhara region, Ethiopia. ISABB Journal of Health and Environmental Sciences, 3(1), 1–8. https://doi.org/10.5897/ISAAB-JHE2016.0026
- Krejcie, R. V., & Morgan, D. W. (1970). Determining sample size for research activities. Educational and Psychological Measurement, 30(3), 607–610. https://doi.org/10.1177/001316447003000308
- Lohri, C. R., Camenzind, E. J., & Zurbrügg, C. (2014). Financial sustainability in municipal solid waste management–costs and revenues in Bahir Dar, Ethiopia. Waste Management, 34(2), 542–552. https://doi.org/10.1016/j.wasman.2013.10.014
- Lunojo, E. (2016). Household willingness to pay for improved solid waste management services in Njombe town council, Tanzania. Mzumbe University.
- Marshall, R. E., & Farahbakhsh, K. (2013). Systems approaches to integrated solid waste management in developing countries. Waste Management, 33(4), 988–1003. https://doi.org/10.1016/j.wasman.2012.12.023
- Marta-Pedroso, C., Marques, G. M., & Domingos, T. (2012). Willingness to pay and demand estimation for guaranteed sustainability labelled beef.
- Maskey, B., & Singh, M. (2017). Households’ willingness to pay for improved waste collection service in Gorkha municipality of Nepal. Environments, 4(4), 77. https://doi.org/10.3390/environments4040077
- Mehari, A. K., Gebremedhin, S., & Ayele, B. (2016). Effect of Bahir Dar municipal effluents on water quality of the head of Blue Nile River. Ethiopian Journal of Environmental Studies and Management, 9(2), 197–208. https://doi.org/10.4314/ejesm.v9i2.7
- Miles, M. B., & Huberman, A. M. (1994). Qualitative data analysis: An expanded sourcebook. An extended source book.
- Monyoncho, G. O. (2013). Solid waste management in urban areas Kenya: A case study of Lamu town. University of Nairobi repository system.
- Mulat, S., Worku, W., & Minyihun, A. (2019). Willingness to pay for improved solid waste management and associated factors among households in Injibara town, Northwest Ethiopia. BMC Research Notes, 12(1), 401. https://doi.org/10.1186/s13104-019-4433-7
- Murad, M. W., Raquib, M. A., & Siwar, C. (2007). Willingness of the poor to pay for improved access to solid waste collection and disposal services. The Journal of Environment & Development, 16(1), 84–101. https://doi.org/10.1177/1070496506297006
- Mussa, J. (2015). Residents’ willingness to pay for improved solid waste management in Dodoma municipality, Tanzania. Sokoine University of Agriculture.
- Nabavi-Pelesaraei, A., Bayat, R., Hosseinzadeh-Bandbafha, H., Afrasyabi, H., & Chau, K.-W. (2017). Modeling of energy consumption and environmental life cycle assessment for incineration and landfill systems of municipal solid waste management-A case study in Tehran Metropolis of Iran. Journal of Cleaner Production, 148, 427–440. https://doi.org/10.1016/j.jclepro.2017.01.172
- Niringiye, A. (2010). Determinants of willingness to pay for solid waste management in Kampala City. Current Research Journal of Economic Theory, 2(3), 119–122. http://www.airitilibrary.com/publication/alDetailedMesh?DoclD=20424885X-201008-2010009060071-201009060071-119-122
- Nkansah, E., Dafor, N. K., & Essel-Gaisey, F. (2015). Willingness to pay for improved solid waste disposal in Tema metropolis. UDS LIBRARY.
- Noori, R., Karbassi, A., & Sabahi, M. S. (2010). Evaluation of PCA and Gamma test techniques on ANN operation for weekly solid waste prediction. Journal of Environmental Management, 91(3), 767–771. https://doi.org/10.1016/j.jenvman.2009.10.007
- Oerlemans, L. A. G., Chan, K.-Y., & Volschenk, J. (2016). Willingness to pay for green electricity: A review of the contingent valuation literature and its sources of error. Renewable and Sustainable Energy Reviews, 66, 875–885. 66 https://doi.org/10.1016/j.rser.2016.08.054
- Ojok, J., Koech, M. K., Tole, M., & Okot-Okumu, J. (2014). Households’ perception, attitudes and expectations on solid waste management in Kampala, Uganda. The Journal of Solid Waste Technology and Management, 40(4), 335–348. https://doi.org/10.5276/JSWTM.2014.335
- Omair, A. (2014). Sample size estimation and sampling techniques for selecting a representative sample. Journal of Health Specialties, 2(4), 142. https://doi.org/10.4103/1658-600X.142783
- Oyawole, F. P., Ajayi, O. P., Aminu, R. O., & Akerele, D. (2016). Willingness to pay for improved solid waste management services in an urbanizing area in South-East Nigeria. Ethiopian Journal of Environmental Studies and Management, 9(6), 793–803. http://dx.doi.org/10.4314/ejesm.v9i6.11
- Park, H. M. (2015). Regression models for binary dependent variables using STATA, SAS, R, LIMDEP, AND SPSS. http://www.indiana.edu/~statmath
- Pek, C. K., & Othman, J. (2010). Household demand for solid waste disposal options in Malaysia. Munich Personal RePEC Archive.
- Pierrat, A., Guitton, S., & Ayerbe, D. (2012). «Clean and green Addis Ababa», enjeux et pratiques environnementales du nouveau millénaire à Addis Abeba [Paper presented]. Addiss Ababa: Annales d’Éthiopie.
- Rahji, M. A. Y., & Oloruntoba, E. O. (2009). Determinants of households’ willingness-to-pay for private solid waste management services in Ibadan, Nigeria. Waste Management & Research, 27(10), 961–965. https://doi.org/10.1177/0734242X09103824
- Rezaei, M. R., Abdoli, M. A., Karbassi, A., Baghvand, A., & Khalilzadeh, R. (2010). Bioremediation of TNT contaminated soil by composting with municipal solid wastes. Soil and Sediment Contamination, 19(4), 504–514. https://doi.org/10.1080/15320383.2010.486049
- Rodić, L., & Wilson, D. C. (2017). Resolving governance issues to achieve priority sustainable development goals related to solid waste management in developing countries. Sustainability, 9(3), 404. https://doi.org/10.3390/su9030404
- Saritha, V., Sunil Kumar, K. A., & Srikanth Vuppala, N. V. (2015). Consumer attitudes and perceptions on electronic waste: An assessment. Pollution, 1(1), 31–43. DOI: 10.7508/PJ/2015.01.004
- Seth, K., Cobbina, S. J., Asare, W., & Duwiejuah, A. B. (2014). Household demand and willingness to pay for solid waste management service in Tuobodom in the Techiman-North District, Ghana. American Journal of Environmental Protection, 2(4), 74–78. https://doi.org/10.12691/env-2-4-3
- Sinha, P. U. M. M. Y. (2014). A case study on the estimation of willingness to pay of the households for the management of solid waste under the municipality area of dibrugarh town (Chokidingee and Khalihamari) of Assam. Journal of International Academic Research for Multidisciplinary Impact Factor, 1(07). ISSN: 2320-5083.
- Srigirisetty, S., Jayasri, T., & Netaji, C. (2017). Open dumping of municipal solid waste–impact on groundwater and soil. Tech. Res. Organ. India, 4(6), 26–33.
- Thi, N., Dung, B., Kumar, G., & Lin, C.-Y. (2015). An overview of food waste management in developing countries: Current status and future perspective. Journal of Environmental Management, 157(4), 220–229. https://doi.org/10.1016/j.jenvman.2015.04.022
- Thirumarpan, K., & Dilsath, M. S. A. (2016). Household willingness to pay for improved solid waste management in Batticaloa, Sri Lanka. Tropical Agricultural Research and Extension, 18(2).
- Tilahun, M., Mathijs, E., Muys, B., Vranken, L., Deckers, J., Gebregziabher, K., & Bauer, H. (2011). Contingent valuation analysis of rural households’ willingness to pay for frankincense forest conservation [Paper presented]. 2011 International Congress, Zurich, European Association of Agricultural Economists.
- UNEP. (2010a). Assessment of the solid waste management system in bahir dar town and the gaps identified for the development of an ISWM plan. Forum for Environment, June 2010.
- Whittington, D. (2002). Improving the performance of contingent valuation studies in developing countries. Environmental and Resource Economics, 22(1–2), 323–367. https://doi.org/10.1023/A:1015575517927
- Whittington, D. (2004). Ethical issues with contingent valuation surveys in developing countries: A note on informed consent and other concerns. Environmental and Resource Economics, 28(4), 507–515. https://doi.org/10.1023/B:EARE.0000036776.89379.4f
- Wilson, D. C., Rodic, L., Scheinberg, A., Velis, C. A., & Alabaster, G. (2012). Comparative analysis of solid waste management in 20 cities. Waste Management & Research, 30(3), 237–254. https://doi.org/10.1177/0734242X12437569
- Wooldridge, J. M. (2010). Econometric analysis of cross section and panel data: MIT press.
- Woretaw, E., Woubishet, D., & Asmare, W. (2017). Households’ preferences and willingness to pay for improved solid waste management interventions using choice experiment approach: Debre Tabor Town, Northwest Ethiopia. Journal of Economics and Sustainable Development, 8(7), 16–32.
- Yusuf, S. A., Ojo, O. T., & Salimonu, K. K. (2007). Households’ willingness to pay for improved solid waste management in Ibadan North local government area of Oyo state, Nigeria. Journal of Environmental Extension, 6(1), 57–63. https://doi.org/10.4314/jext.v6i1.2766