
Abstract
So far, no study has used ability profiles to evaluate the “science, technology, engineering, and/or mathematics (STEM) potential” (i.e. the capacity to engage in STEM professions) of Swiss students at the end of their compulsory education. In the current study, we use the proportion of high achieving students with a math-tilted ability profile as an indicator of STEM potential. Based on data from the Program for International Student Assessment, we assess Swiss students’ STEM potential, nationwide and in each Swiss canton, compared to students in other countries. Our analysis shows that Swiss students, especially Swiss female students, have high STEM potential compared with their peers in other countries. Despite regional differences in the compulsory education system, STEM potential was high across all of the Swiss cantons. Based on our results, we conclude that national as opposed to regional factors are mainly responsible for the high STEM potential of Swiss students.
Public Interest Statement
A population’s prosperity and well-being depend to a large extent on the willingness and ability of its members to engage in science, technology, engineering, and/or mathematics (STEM) professions. Based on previous research and using data from the Program for International Student Assessment, we use the proportion of high achieving students with a math-tilted ability profile as an indicator of students’ “STEM potential.” We compare the STEM potential of Swiss students relative to their peers in other countries, overall and split by gender. We show that Swiss students—particularly Swiss female students—have high STEM potential relative to their peers in other countries. The high STEM potential across regions within Switzerland suggests that national as opposed to more local factors are responsible for the high STEM potential of Swiss students.
1. Introduction
A population’s prosperity and well-being depend to a large extent on the willingness and ability of its members to engage in high-level science, technology, engineering, and/or mathematics (STEM) professions (see Hanushek, Peterson, & Woessmann, Citation2013; Hanushek & Woessmann, Citation2011; Solow, Citation1956). Extensive research has demonstrated that high achieving students who perform particularly well in math-related areas are much more likely to succeed in STEM areas decades later than their peers (e.g. Benbow & Lubinski, Citation2006; Halpern et al., Citation2007; Lubinski & Benbow, Citation2006; Lubinski, Benbow, & Kell, Citation2014; Lubinski, Webb, Morelock, & Benbow, Citation2001; Wai, Lubinski, & Benbow, Citation2005; Webb, Lubinski, & Benbow, Citation2002). Hence, the proportion of high achieving students with math-titled “ability profiles” offers a valid indicator of a population’s STEM potential.
Building on previous research described above, in the current study we use ability profiles (Cronbach & Gleser, Citation1953) to assess the STEM potential of Swiss students at the end of their compulsory education. Switzerland is an interesting example for analysis given its high mathematics achievement and the unique organization of its educational system. Specifically, we use data from the Program for International Student Assessment (PISA) to identify the proportion of high achieving students with math-tilted profiles as an indicator of STEM potential. We then compare the Swiss STEM potential with that of other countries. Given the particularly low participation of women in STEM professions (also in Switzerland, see Federal Council, Federal Council, Citation2010), and evidence of gender differences in ability profiles (Hautamäki, Laaksonen, & Scheinin, Citation2008), we were particularly interested in assessing the STEM potential of female students. Finally, we assessed the STEM potential in individual cantons (i.e. states) within Switzerland.
1.1. Abiltiy profiles
In the Study of Mathematically Precocious Youth, initiated by Julian C. Stanley and continued by his colleagues Camilla Benbow and David Lubinski, competence profiles were used to analyze the educational and career development of students identified as having high STEM potential (e.g. Benbow & Lubinski, Citation2006; Halpern et al., Citation2007; Lubinski & Benbow, Citation2006; Lubinski et al., Citation2001, 2014; Wai et al., Citation2005; Webb et al., Citation2002). Using verbal and mathematics scores from the Scholastic Aptitude Test, they categorized high achieving students according to how their mathematics abilities compared with their verbal abilities. Namely, students who performed better on the mathematics assessment than on the verbal assessement were defined as having a “math-tilted” ability profile, while students who performed better on the verbal assessment were defined as having a “verbal-titled profile”. Students who performed equally well on both assessements were defined as having a “flat profile.” All three groups demonstrated a high level of career success. However, high achieving male students with a math-tilted ability profile were much more likely to pursue STEM careers relative to their peers.
The work of Benbow, Lubinski, and their colleagues demonstrates the power of ability profiles for predicting the future pursuit of STEM careers. Given the relevance of the (potential) STEM workforce for a population’s welfare, it is surprising that, to date, only few studies have used student achievement data to construct ability profiles and assess STEM potential on the population level. In fact, despite the availability of information on students’ verbal and mathematics abilities in a number of countries around the world, so far just four studies have used student achievement data to construct ability profiles to describe student achievement on the population level (Hautamäki et al., Citation2008; Wittmann, Citation2005, 2006). Based on PISA data, Hautamäki and colleagues (Citation2008) provided descriptive data about the proportion of students with different ability profiles on the country-level. Also based on PISA data, Wittmann (Citation2006) found initial evidence that countries with a greater proportion of high achieving students with math-tilted ability profiles students had higher levels of economic success, independent of their natural resources and other economic indicators. Hence, Wittmann (Citation2006) confirmed that STEM potential, specifically as indicated by the proportion of high achieving students with math-tilted profiles, is associated with a population’s prosperity and well-being (see Hanushek et al., Citation2013; Hanushek & Woessmann, Citation2011; Solow, Citation1956). Building on these initial studies, in the current study we used PISA data to calculate the proportion of high achieving students with math-tilted ability profiles as an indicator of the population’s STEM potential. We focused on Swiss STEM potential given its high mathematics achievement (particularly among female students), which suggests that Switzerland may have high STEM potential.
1.2. Gender differences in ability profiles
Studies have consistently demonstrated gender differences with regard to student ability profiles: whereas male students are more likely to perform relatively better on math than on verbal tasks, female students are more likely to perform better on verbal than on math tasks (e.g. Hautamäki et al., Citation2008). Based on PISA data, Hautamäki and colleagues (Citation2008) found that the gender difference could be observed across all of the analyzed OECD countries (p. 42). Importantly, studies have demonstrated that the size of gender differences in mathematics performance (without considering ability profiles) varies considerably across countries (Else-Quest, Hyde, & Linn, Citation2010; Lindberg, Hyde, Petersen, & Linn, Citation2010) and are potentially related to the position of women in a country (Guiso, Monte, Sapienza, & Zingales, Citation2008). For instance, boys and girls perform equally well on mathematics tests in Finland, but boys outperform girls in Germany, and even more so in Mexico (Guiso et al., Citation2008). In light of the particularly low participation of women in STEM professions (Federal Council, Citation2010), and evidence of gender differences in ability profiles and mathematics ability, assessing female students’ STEM potential seems particularly relevant.
1.3. The Swiss context
Switzerland is a small country (currently 8.0 million inhabitants) in the middle of Europe, with four cultural/linguistic regions (German, French, Italian- and Romansch) and 26 cantons. According to the PISA 2006 study, mathematics achievement in Switzerland is among the best in the world (average score of 530), lower only than Hongkong-China, Chinese Taipei, Finland, and Republic of Korea (see Zahner Rossier & Holzer, Citation2007). Previous research has revealed that, overall, Swiss students tend to perform relatively better in math than in verbal areas relative to students in other countries (OECD, Citation2007).
As in many other countries, compulsory education in Switzerlands ends at age 15 when it is decided whether students will either enter a baccalaureate school as preparation for university studies, or enter a vocational education (with or without a Federal Vocational Baccalaureate). Approximately one third of students (32.6%) continue on to the highest upper secondary level (Federal Statistical Office, Citation2010).
A unique feature of the Swiss educational system is that compulsory education is independently organized by each of the 26 cantons as opposed to the federal government. Thus, analysis of Swiss PISA data offers the unique opportunity to assess the extent to which variations in school systems (e.g. hours of instruction, see Holzer, Citation2005; Moser & Angelone, Citation2008, p. 33; Wolter, Citation2010) may be associated with different levels of STEM potential. Such an assessement is not only relevant specifically for Swiss educators, but also for informing educational policy around the world.
1.3.1. Current study
Despite evidence that high achieving students with math-tilted profiles are more likely to pursue STEM careers, to date only few study has used ability profiles as an indicator of STEM potential on the population level. In the current study, we used ability profiles to assess the STEM potential of Swiss students relative to their peers in other countries. We were particularly interested in assessing the STEM potential of Swiss female students relative to their male peers in Switzerland, and their male and female peers in other countries. Furthermore, we assess the extent to which STEM potential varies across cantons within Switzerland. Building on previous research (Hautamäki et al., Citation2008; Wittmann, Citation2005, Citation2006), our analyses were based on PISA data. Because participants are assessed at approximately the same time that they decide either to pursue further STEM studies or not (at age 15, the end of compulsary education), PISA data are particularly well suited for capturing the STEM potential of the future Swiss workforce.
2. Method
2.1. Data
International data were from PISA 2000, 2003, 2006, 2009, 2012, and 2015 (PISA-I). In 2006, Switzerland added a country-specific test (PISA-E) which included regional data from 15 of the 26 Swiss cantons (data available from the Swiss Center of Expertise in the Social Sciences [http://forscenter.ch/en/data-and-research-information-services/2221-2/special-projects/pisa/]). We focused primarily on the 2006 data for two reasons. First, the 2006 assessement included data from the most cantons. Second, a national initative to reduce regional differences in the Swiss educational system was launched in 2007, potentially leading to a reduction of regional differences (which we wanted to identify) in the following years. The PISA-I study evaluated 15-year-old Swiss students (approximately grade 9), whereas the PISA-E evaluated students in grade 9 (approximately ages 15–16). Because the slight difference in student sample was irrelevant for our research questions, we pooled the Swiss data from the international and add-on studies. Results for Swiss cantons with two official languages, such as Bern and Valais, were reported separately. Regional data were thus available for 17 regional units within Switzerland: Aargau (AG), Basel-Land (BL), Bern (BE), St. Gallen (SG), Schaffhausen (SH), Thurgau (TG), Valais (VS-d), and Zurich (ZH) as well as the remaining German-speaking cantons (D-Remainder). For French-speaking regions, data were available for Bern (BE-f), Fribourg (Fr-f), Geneva (GE), Jura (JU-f), Neuchâtel (NE), Valais (VS-f), Vaud (VD-f). Data were also available for one Italian-speaking canton, Ticino (CHE-I). For comparison purposes, we additionally obtained regional information for Italy (13 regions), Spain (10 provinces), Belgium (Flanders and Wallonia), and the United Kingdom (Scotland, England, Wales, and Northern Ireland).
In sum, the 2006 international database included data from N = 413, 595 students in 57 countries, including n = 32,648 Swiss students. The international sample did not include 5,611 students from the United States due to missing reading data. Regional data were available for a total of 46 regional units in five countries.
2.2. Analytical strategy
We used an unrotated principal component analysis to group students based on their overall achievement level and their ability profile (see Figure ). The analysis was based on ten indicators of students’ mathematics and reading compentencies (“plausible values”). Five variables captured students’ mathematics achievement (PV1MATH-PV5MATH), and five variables captured students’ verbal achievement (PV1READ-PV5READ). Although PISA additionally assesses students’ science competencies, we constructed ability profiles based only on the mathematics and verbal scores because we wanted our analyses to be as similar as possible to the analyses by Lubinski and Benbow (Citation2006).
Figure 1. High achieving students grouped by ability profile
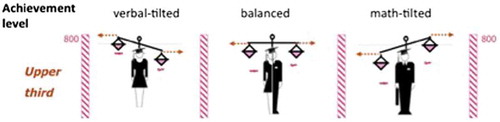
The first unrotated component represented students’ overall achievement level. The second component contrasted their mathematics and verbal achievement (profile scatter). Using the values from the component coefficient matrix as weights, we calculated overall achievement and profile scatter component scores for each student based on weighted sums of their scores on the ten variables. We defined high achieving students as students with “overall achievement” component scores in the highest third of the entire sample. The cut-off of one-third was chosen to reflect the structure of the Swiss educational system, in which approximately the top third of students continue on to the highest track of secondary school, and have the highest potential for pursuing STEM studies at the university level and hence STEM careers later on. We defined students with “profile scatter” component scores in the highest third as having verbal-tilted profiles, and students with profile scatter component scores in the lowest third as having math-tilted profiles. Students with profile scatter component scores around zero were defined as having balanced profiles.
The proportion of high achieving students with a math-tilted profile was used as an indicator of STEM potential. Using this indicator, we calculated the STEM potential of each country based on the PISA 2000, 2003, 2006, 2012, and 2015 data. We then calculated students’ STEM potential, overall and split by gender, in each country and Swiss canton based on the PISA 2006 data.
3. Results
Table displays the STEM potential by country for each of the top 15 ranked countries, the United States and Germany based on the PISA data from 2000, 2003, 2006, 2009, 2012, and 2015. Table indicates that Switzerland was consistently ranked in the top ten countries across all years. Notably, the United States was never ranked in the top 20 countries. Finland was in the top 15 countries only in 2003, 2006, and 2009.
Table 1. STEM potential as indicated by the proportion (%) of high achieving students with a math-tilted ability profile by country (Top 15, United States and Germany), PISA 2000 to 2012
Table displays the STEM potential (overall and split by gender) of the Swiss cantons in international comparison according to PISA 2006. Notably, the STEM potential of nearly all of the Swiss regions (16 out of 17) was higher than the STEM potential of the top 10 countries. Within Switzerland, the highest STEM potential was observed in the French-speaking part of Fribourg, in which 41.6% of the high achieving students had a math-tilted profile. The lowest STEM potential was observed in Geneva, in which 17.6% of the high achieving students had a math-tilted profile.
Table 2. STEM potential of Swiss cantons in international comparison as indicated by the proportion (%) of high achieving students with a math-tilted ability profile, in total and split by gender, PISA 2006
As clearly visible in Table , there was a gender gap with regards to the ability profiles of high achieving students in all of the cantons and countries, such that a greater proportion of high achieving male students had a math-tilted profile relative to their high achieving female peers. In Switzerland, just 8.2% of high achieving female students had a math-tilted profile, compared with 19.7% of high achieving male students. Nevertheless, relative to the other PISA 2006 countries, female STEM potential was high in Switzerland and across all of the Swiss cantons. There was a gender gap between high achieving male and female students across all countries and also across all cantons. Eight cantons were ranked in the top 10 with regards to female STEM potential, just behind Chinese Taipei (female STEM potential: 20.7%) and ahead of Macau-China (female STEM potential: 11.1%).
Table displays the STEM potential of the Swiss cantons compared with the other country-specific regional units for which data was available. According to the regional comparison, the Swiss cantons were ranked between 1 to 23 out of the 46 regional units. It should also be noted that Geneva, Swiss canton with the lowest STEM potential (17.6%), still had a higher proportion of high achieving students with math-tilted profiles than all of the regions of the United Kingdom (Scotland, 12%; England, Wales, Northern Ireland, 8%) and all provinces in Italy (Bolzano: 16.1%—Piemont: 7.1%).
Table 3. STEM potential of Swiss cantons relative to other country-specific regional units as indicated by the proportion (%) of high achieving students with a math-tilted ability profile, in total and split by gender, PISA 2006
4. Discussion
Despite the importance of STEM potential for a population’s welfare and prosperity, to date only a few studies have attempted to estimate STEM potential at the population level. Based on previous research and using PISA data, in the current study we used the proportion of high achieving students with a math-tilted ability profile as an indicator of students’ STEM potential. Taken together, our results revealed that there is high STEM potential in Switzerland and across its cantons. Our analysis indicates that Switzerland was consistently ranked in the top 10 countries across all years for which data were available (see Table ). It therefore appears that, as a whole, the Swiss educational system seems to be highly successful in supporting students’ STEM potential. Notably, with the exception of Geneva, each of the Swiss cantons had a higher STEM potential than Finland (19.8%), the PISA “champion country.” Previous research suggests that high achieving Finnish students tend to have balanced ability profiles (see Hautamäki et al., Citation2008). Hence, although Finland ranks very highly with regards to mathematics achievement, the results of the current study suggest that the STEM potential of Finnish students (i.e. the likelihood that they will later pursue STEM careers) may not be as high as in other countries such as Switzerland. Thus, with regard to STEM potential, the results of the current study throw doubts on the “myth of the Nordic education systems” (Kobarg & Prenzel, Citation2010). When it comes to supporting students’ STEM potential, we argue that Switerzland seems to be a model country.
Our findings clearly confirmed that there is a sizable gender gap in the proportion of students with math-tilted ability profiles in each country and region (Hautamäki et al., Citation2008; Wittmann, Citation2005, Citation2006). At first glance, our findings seem to disagree with recent results on gender differences in mathematics achievement (see Else-Quest et al., Citation2010; Guiso et al., Citation2008; Lindberg et al., Citation2010), but we note that these studies were based on analysis of overall or single scores as opposed to differences in ability profiles. Despite the gender gap, the results nevertheless suggest that the Swiss education system was more successful than most of the other countries in transmitting mathematics competencies to young women, as indicated by its relatively high female STEM potential and by the relatively small gender gap. We therefore conclude that, at least relative to other countries, the Swiss compulsory education system quite successfully promotes women’s STEM potential.
In Switzerland, compulstory education (through grade 9) is the responsibility of the cantons as opposed to the federal government, and is therefore very heterogeneous. Despite regional differences in the compulsory education system, the estimated STEM potential of all of the cantons for which we had data were excellent in international comparison. In fact, the regional analysis indicated that the Swiss cantons filled the top ranks both when compared to other countries (Table ) and when compared with other country-specific regional units (Table ). The high STEM potential across cantons may suggest that national as opposed to regional factors are responsible for the apparent success of Switzerland’s educational system with regards to developing students’ STEM potential.
How well does Switzerland utilize students’ STEM potential at the university level? In 2008, approximately 28% (3,200) of all university degrees were awarded in STEM fields (Federal Statistical Office [Bundesamt für Statistik], Citation2010). There thus seems to be considerable room to better exploit students’ STEM potential. In the study from Lubinski and Benbow (Citation2006), even gifted women with math-tilted and flat ability profiles (i.e. women with a particularly high potential for success in STEM professions) tended to prefer careers in life and law sciences than in STEM fields (Wai et al., Citation2005). Thus, we believe that high achieving female students with math-tilted ability profiles should be encouraged to pursue STEM studies, and that students with balanced ability profiles may likewise represent an “untapped resource.” We also recommend promoting STEM studies by stimulating younger people’s interest in STEM subjects (see also Federal Council [Bundesrat], Citation2010). Finally, teacher education programs should raise awareness of the importance of developing students’ STEM potential, so that teachers can better diagnose and optimize students’ STEM potential in the classroom (see Hoge & Coladarci, Citation1989; Kaufmann, Citation2016; Südkamp, Kaiser, & Möller, Citation2012).
4.1. Limitiations and suggestions for future research
Our indicator of STEM potential was based on previous research demonstrating a close link between math-tilted ability profiles and pursuit of STEM studies and professions among high achieving students (e.g. Benbow & Lubinski, Citation2006; Halpern et al., Citation2007; Lubinski & Benbow, Citation2006; Lubinski et al., Citation2001, 2014; Wai et al., Citation2005; Webb et al., Citation2002). Nevertheless, it should be noted that we were unable to provide additional evidence of the validity of our indicator in the current study. Future longitudinal studies should use ability profiles to identify students with STEM potential and follow their educational and professional careers over time. For instance, longitudinal studies could investigate whether perhaps Swiss women with high STEM potential have greater tendency to choose STEM degree programs in biology, agriculture, and health (BAH careers) while Swiss men have a greater tendency to choose computing, engineering, mathematics (CEM careers, see Sikora & Pokropek, Citation2012). Although similar analyses have been conducted on students in the United States since the 1970s, to date, no such study has been conducted in Swizterland. Such studies would have the power to reveal where students’ STEM potential might be lost (e.g. when making decisions about university studies).
Because high-level STEM professionals are most important for a population’s welfare (see Hanushek et al., Citation2013; Hanushek & Woessmann, Citation2011; Solow, Citation1956), in the current analysis we focused exclusively on the ability profiles of high achieving students. Future research should investigate the ability profiles of low and middle-achieving students (see Lohman, Gambrell, & Lakin, Citation2008), which may be an important predictor of a population’s capacity to meet the demand for employees in less complex STEM professions. Such research could provide helpful information for vocational education and training programs and would ideally be integrated within a comprehensive PISA project on vocational students (see Baethge et al., Citation2006).
Finally, our analyses were based on PISA data, which itself has a number of limitations. Due to sample variations, countries’ STEM potential (i.e. the proportion of high achieving students with a math-tilted ability profile) is not directly comparable across years (see Table ). For instance, the percentage of “high achieving” students in one country increases when more countries with overall low scores participate in the study. Re-analyses based only on the subsample of countries that participated in each PISA year (2000–2015) confirmed our conclusion that Switzerland consistently demonstrated high STEM potential across study years. More generally, the validity of comparisons based on PISA data has been criticized (Goldstein, Citation2004), as have its test construction, data gathering procedure and the applied Rasch-analytical approach (for details, see e.g. Hopfenbeck et al., Citation2017; Jahnke & Meyerhöfer, Citation2008). Given the criticism of the PISA data, future research should replicate our results using alternative data sources, such as achievement scores from the Scholastic Aptitude Test or American College Test, school grades and/or data on students’ interests.
5. Conclusions
Taken together, our study demonstrates that Swiss students—particularly Swiss female students—have high STEM potential at the end of their compulsory education. To date, Swiss STEM potential has often been underestimated without considering students’ ability profiles (see e.g. OECD, Citation2007). More generally, our study demonstrates how accessible, international achievement data can be used to construct ability profiles. Further (longitudinal) studies based on ability profiles have the potential for answering many interesting questions about how students’ STEM potential can best be supported on the individual and population levels.
Funding
The authors received no direct funding for this research.
Additional information
Notes on contributors
Esther Kaufmann
Esther Kaufmann, PhD, is a senior lecturer and researcher at the University of Zurich in Switzerland. She earned her PhD from the Graduate School of Economic and Social Sciences at the University of Mannheim in Germany. Her research interests include evaluation (meta-analysis and test development), judgment and decision-making, and online research.
Werner W. Wittmann
Professor emeritus Werner W. Wittmann, PhD, is a psychologist, evaluation researcher, and research methodologist. His research interests include methodological aspects of evaluation (Brunswik symmetry, meta-analysis). In 2005, he was awarded the F. Lazarsfeld Award for Evaluation Theory by the American Evaluation Association.
References
- Baethge, M., Achtenhagen, F., Arends, L., Babic, E., Baethge-Kinsky, V., & Weber, S. (2006): Berufsbildungs-Pisa. Machbarkeitsstudie [PISA-VET: Feasibility study]. Munich: Franz Steiner Verlag.
- Benbow, C. P., & Lubinski, D. (2006). Julian C. Stanley, Jr. (1918–2005). American Psychologist, 61(3), 251–252.10.1037/0003-066X.61.3.251
- Cronbach, L. J., & Gleser, G. C. (1953). Assessing similarity between profiles. Psychological Bulletin, 50, 456–473.10.1037/h0057173
- Else-Quest, N. M., Hyde, J. S., & Linn, M. C. (2010). Cross-national patterns of gender differences in mathematics: A meta-analysis. Psychological Bulletin, 136, 103–127.10.1037/a0018053
- Federal Council [Bundesrat]. (2010): Mangel an MINT-Fachkräften in der Schweiz Ausmass und Ursachen des Fachkräftemangels in MINT (Mathematik, Informatik, Naturwissenschaften und Technik). Bericht des Bundesrates [Lack of STEM professionals in Switzerland: Extent and causes of the shortage of skilled workers in mathematics, computer science, natural sciences and technology]. Federal Council Report. Retrieved from https://www.wbz-cps.ch/sites/default/files/bericht_fachkraeftemangel_2010_0.pdf
- Federal Statistical Office [Bundesamt für Statistik]. (2010): Maturitätsquote nach Maturitätstyp und Kanton: 1998–2010 [Baccalaureate rate by type and canton]. Retrieved from http://www.bfs.admin.ch/bfs/portal/de/index/themen/15/06/key/ind12.indicator.12106.1201.html?open=104#104
- Goldstein, H. (2004). International comparisons of student attainment: Some issues arising from the PISA study. Assessment in Education: Principles, Policy & Practice, 11(3), 319–330.10.1080/0969594042000304618
- Guiso, L., Monte, F., Sapienza, P., & Zingales, L. (2008). Culture, gender, and math. Science, 320, 1164–1165. doi:10.1126/science.1154094
- Halpern, D. F., Benbow, C. P., Geary, D. C., Gur, R. C., Hyde, J. S., & Gernsbacher, M. A. (2007). The science of sex differences in science and mathematics. Psychological Science in the Public Interest, 8(1), 1–51.10.1111/j.1529-1006.2007.00032.x
- Hanushek, E. A., Peterson, P. E., & Woessmann, L. (2013). Endangering prosperity: A global view of the American school. Washington, DC: Brookings Institution Press.
- Hanushek, E. A., & Woessmann, L. (2011). How much do educational outcomes matter in OECD countries? Economic Policy, 26(67), 427–491.10.1111/ecop.2011.26.issue-67
- Hautamäki, J., Laaksonen, S., & Scheinin, P. (2008). Level and balance of achievement. In J. Hautamäki, et al (Eds.), PISA 06 Finland: Analyses, reflections, explanations. Ministry of Education Publications 2008:44. Retrieved from http://www.pisa2006.helsinki.fi/files/PISA06_Analyses_Reflections_and_Explanations.pdf
- Hoge, R. D., & Coladarci, T. (1989). Judgments of academic achievement: A review of literature. Review of Educational Research, 59(3), 297–313. doi:10.3102/00346543059003297
- Holzer, T. (2005). PISA 2003. Einflussfaktoren auf die kantonalen Ergebnisse [Factors affecting cantonal results]. BFS Aktuell. Neuchâtel: Federal Statistical Office.
- Hopfenbeck, T. N., Lenkeit, J., El Masri, Y., Cantrell, K., Ryan, J., & Baird, J.-A. (2017). Lessons learned from PISA: A systematic review of peer-reviewed articles on the Programme for International Student Assessment. Scandinavian Journal of Educational Research, 1–21. doi:10.1080/00313831.2016.1258726
- Jahnke, T., & Meyerhöfer, W. (2008): Pisa & Co. Kritik eines Programms [Pisa & Co. Criticism of a program]. Hildesheim: Verlag Franzbecker.
- Kaufmann, E. (2016). Teachers as judges: A psychometric reanalysis of Hoge and Coladarci’s meta-analysis. Manuscript submitted for publication.
- Kobarg, M., & Prenzel, M. (2010). Nicht alle Nordlichter glänzen [Not all northern lights shine]. Schule im Blickpunkt, 43(5), 8–10.
- Lindberg, S. M., Hyde, J. S., Petersen, J. L., & Linn, M. C. (2010). New trends in gender and mathematics performance: A meta-analysis. Psychological Bulletin, 136(6), 1123–1135.10.1037/a0021276
- Lohman, D. F., Gambrell, J., & Lakin, J. (2008). The commonality of extreme discrepancies in the profiles of academically gifted students. Psychology Science Quarterly, 50(2), 269–282.
- Lubinski, D., & Benbow, C. P. (2006). Study of mathematically precocious youth after 35 years: Uncovering antecedents for the development of math-science expertise. Perspectives on Psychological Sciences, 1(4), 316–345.10.1111/j.1745-6916.2006.00019.x
- Lubinski, D., Benbow, C. P., & Kell, H. J. (2014). Life paths and accomplishments of mathematically precocious males and females four decades later. Psychological Science, 25, 2217–2232.10.1177/0956797614551371
- Lubinski, D., Webb, R. M., Morelock, M. J., & Benbow, C. P. (2001). Top 1 in 10,000: A 10-year follow-up of the profoundly gifted. Journal of Applied Psychology, 86(4), 718–729.10.1037/0021-9010.86.4.718
- Moser, U., & Angelone, D. (2008). PISA 2006: Porträt des Kantons Aargau [PISA 2006: Portrait of the Canton of Aargau]. (Forschungsgemeinschaft PISA Deutschschweiz/FL, Eds). Zurich: KDMZ.
- OECD (2007). PISA 2006 science competencies for tomorrow’s world. Paris: Author.
- Sikora, J., & Pokropek, A. (2012). Gender segregation of adolescent science career plans in 50 countries. Science Education, 96(2), 234–264.10.1002/sce.v96.2
- Solow, R. M. S. (1956). A contribution to the theory of economic growth. Quarterly Journal of Economics, 70, 65–94. doi:10.2307/1884513
- Südkamp, A., Kaiser, J., & Möller, J. (2012). Accuracy of teachers’ judgments of students’ academic achievement: A meta-analysis. Journal of Educational Psychology, 104(3), 743–763. doi:10.1037/a0027627
- Wai, J., Lubinski, D., & Benbow, C. P. (2005). Creativity and occupational accomplishments among intellectually precocious youths: An age 13 to age 33 longitudinal study. Journal of Educational Psychology, 97(3), 484–492.10.1037/0022-0663.97.3.484
- Webb, R. M., Lubinski, D., & Benbow, C. P. (2002). Mathematically facile adolescents with math-science aspirations: New perspectives on their educational and vocational development. Journal of Educational Psychology, 94(4), 785–794.10.1037/0022-0663.94.4.785
- Wittmann, W. W. (2005). Group differences in intelligence and related measures. In O. Wilhelm & R. W. Engle (Eds.), Handbook of understanding and measuring intelligence (pp. 223–239). London: Sage.10.4135/9781452233529
- Wittmann, W. W. (2006). The case of the Program for International Student Assessment (PISA) and how the United States of America deals with its implications compared to other countries. Presented at Evaluation 2006, The Consequences of Evaluation, Portland, Oregon. November 1–4.
- Wolter, S. C. (2010). Bildung in der Schweiz unter der Lupe [Swiss education under the magnifying glass]. Die Volkswirtschaft, 3, 54–57.
- Zahner Rossier, C., & Holzer, T. (2007). PISA 2006: Kompetenzen für das Leben – Schwerpunkt Naturwissenschaften – Nationaler Bericht [PISA 2006: Skills for life – Focus on sciences]. Neuchâtel: Federal Statistical Office.