
Abstract
Increasing complexity towards harnessing the power of ICT on all levels has created uncertainty about higher educational technological capabilities and adequate strategies to develop e-readiness. In this study, an empirically grounded higher education e-readiness questionnaire in the domain of higher education was developed and validated. Exploratory factor analysis (n = 120) followed by confirmatory factor analysis (n = 336) was done which was presented in two forms; covariance model and the structural model. The covariance model showed that the 5 indicators (“Innovativeness”, “Infrastructure”, “Collaboration”, “Learning flexibility”, “Student experience”) and assigned 24 items were important e-readiness dimensions from the learners’ point of view. The structural models validated the previously extracted factors along with their indicators. As a practical tool, the e-readiness tool could assist institutions towards identifying issues that contribute towards e-readiness thereby formulating strategies accordingly. An example of how it can be used as a practical tool is presented in this paper.
PUBLIC INTEREST STATEMENT
The aim of this study was to develop reliable and valid e-readiness quality measurement scales from the learners in a Malaysian educational context. Factors and items relevant to learners’ experience of e-readiness were identified in the literature, through interviews, expert consultation and expert ratings. The scale was tested in a teacher education university in Malaysia. The scale’s psychometric properties were assessed using exploratory factor analysis, analysis of internal consistency, confirmatory factor analysis (covariance and structural model), and evaluation of both convergent and discriminant validity. The confirmatory factor analysis confirmed five factors, namely, “Innovativeness”, “Infrastructure”, “Collaboration”, “Learning flexibility” and “Student experience”. This e-readiness scale can serve as a tool for identifying issues that contribute towards e-readiness in a Malaysian context. The tool can also be used to assist in formulating e-readiness strategies, which is the necessity of the hour for any country that wishes to exploit the benefits brought by ICT.
1. Introduction
According to Harkins (Citation2008), higher education 4.0 is an era of “innovativeness” catering to the needs of modern society. Learners must be innovative enough to adapt to the rapid changing landscape in society which rewards knowledge in its perpetuity. In other words, knowledge is no longer static but must be developed according to the changes and needs in society. It continuously grows as part of the learners’ lifelong mission (Goh, Citation2019). Higher education should empower learners to structure their own learning paths. Learners in this era no longer fit the “conventional” profile of one who systematically completes the secondary education and then move on to complete a degree (Hauke, Citation2019; Kneale, Citation2009). Due to the demands of modern society, learners require greater customization of how they want their learning to ensue (Goh et al., Citation2020a). Advances in Information, Communication and Technology (ICT) have made learning more flexible and allow greater personalization. With changes occurring in technology, the onus is on education to adapt and transform (Fry et al., Citation2009). The use of ICTs in higher education institutions has the potential to enhance the quality of teaching and learning, increase the research productivity of the faculty and students, and improve the management and effectiveness of institutions (Kinshuk et al., Citation2016). This has necessitated the concept of e-readiness.
According to the Information Technology Group at the Center for International Development (CID), Harvard University, e-readiness is how prepared “a community is … to participate in the Networked World. It is gauged by assessing a community’s relative advancement in the areas that are most critical for ICT adoption and the most important applications of ICTs.” (“Readiness for the networked world”, Citationn.d.). Similarly, Dutta et al. (Citation2011) agree that the assessment of any e-readiness is the improvement of an organisation or institution to use the application afforded by ICT. “Application” in this case is succinctly echoed by CID as an organisation that has inculcated the appropriate infrastructure (such as high bandwidth, reliable equipment, consistent maintenance, dependable content, sustainable developmental level) to assimilate ICTs throughout the use and life cycle of the organisation. In the context of higher education, Machado (Citation2007) more specifically hypothesizes e-readiness as “the ability of higher education institutions and the capacity of institutional stakeholders (managers, key ICT persons, teachers and students) to generate learning opportunities by facilitating computer-based technologies” (p. 74). E-readiness is a measure of the potential for the institutions to participate in the networked world of higher education and research (Machado, Citation2007).
The expectation that technology can improve the quality of learning has led many institutions of higher learning to invest in technological infrastructure (U.S. Department of Education, Citation2017). As the focus of education is now on learners rather than teachers and institutions (Darling-Hammond et al., Citation2019), it has also accelerated the need for flexible learning and more personalized learning through technology (Hallman, Citation2018; Peng et al., Citation2019). Moving to an adaptation of new technologies require a combination of capabilities as well as a clear understanding of the pedagogical aspects involved (Hallman, Citation2018; U.S. Department of Education, Citation2017). For example, there are questions whether the infrastructure within higher education institutions is ready to support both the required resources and tools and students using them. It also begets the question of whether these institutions are able to maintain a strategically driven teaching and learning environment of continuous improvement for its learners (Goh & Abdul-Wahab, Citation2020). It would appear that what is missing at this point is the education institution’s level of knowledge concerning their own e-readiness. Possibly too, most of the higher education institutions have not yet assessed their level of e-readiness due to a lack of contextually appropriate assessment tools.
The authors acknowledge that there are e-readiness tools that are scientifically grounded and use indicators that are explained in a transparent manner. However, most of these e-readiness tools originate from more developed western countries (Machado, Citation2007). Machado (Citation2007) cautions that the e-readiness tools developed are likely to focus on measuring the “digital divide between rich and poor countries” (p. 73). The readiness tools tend to focus its measurement on the digital readiness of countries rather than the e-readiness of a learning institution or that the data to develop the tools are derived from more developed countries (Bwalya & Mutula, Citation2014; Durek & Ređep, Citation2016; Machado, Citation2007). Oftentimes, there is a concern that e-readiness strategies in developed countries may be mismatched with a developing country’s context and culture. In addition, higher education institutions in developing economies (of which Malaysia is one) are at different stages of adopting ICTs. For instance, Cambodia often experiences difficulty with incorporating ICTs into their education system and have only started to develop and implement ICT in education policies (Richardson et al., Citation2014). This is particularly true also of Laos and Myanmar which are attempting to overcome challenges such as the huge digital gap and urban-rural gap in higher education (Tongkaw, Citation2013; Wongwuttiwat & Lawanna, Citation2018; You, Citation2017). Developing countries that are currently more successful in infusing e-readiness into higher education, such as Thailand and the Philippines, are still grappling with inadequate digital infrastructure (Wongwuttiwat & Lawanna, Citation2018). For institutions that are in the early stages of the ICT adoption, it would appear that there is still a scarcity of easy to use assessment that can be used to assess their state of readiness to use ICTs in education, benchmark to gauge their success and progress, and applied to serve their own country’s needs. Recognizing what is needed, in which way, for what purpose, and if successful still embodies a challenge for higher education institutions (Gaertner et al., Citation2016). This is where the present study comes in.
The easy to use e-readiness assessment questionnaire presented in this article has its focus on higher educational aspects. The study describes and evaluates the components found within the questionnaire necessary to fulfil the requirements of higher education e-readiness environment, from the preservice teachers’ perspectives in the Malaysian context. The indicators within the questionnaire will have quantitative targets that could be used for benchmarking and quantitative assessment of e-readiness attempts.
2. Importance of e-readiness assessment
The assessment of e-readiness is an important undertaking to assess if an educational environment is ready to participate in the information or digital education (Gaertner et al., Citation2016). Setting a solid and enabling learning environment to nurture an “information society” is the first step towards any undertakings for the acceptance, implementation and access of ICT (such as e-learning and blended learning) (Al Mulhem, Citation2020; OECD, Citation2016). Various factors have contributed towards the motivation of learning institutions to embrace ICT. One, learners today are “digital connoisseurs” (Goh & Abdul-Wahab, Citation2020, p. 168). The digital connoisseurs are very savvy and more at ease with everything digital, from the computers to their own mobile phones. The internet is the digital connoisseurs’ library. Digital connoisseurs are learning in an environment where the classrooms are everywhere (Goh & Abdul-Wahab, Citation2020). Institutions of higher learning must be ready to receive these learners. Higher education which includes teacher education, at least in Malaysia, has been accused of being slow to change and of using outmoded “traditional” methods of teaching and learning (Goh & Blake, Citation2015; Goh et al., Citation2020b).Traditional setting has moved away from lecture halls to the integration of new tools and technologies in teaching (Goh & Abdul-Wahab, Citation2020). There has been an uptake in e-learning, more so since the beginning of 2020 when the world was hit by the Covid-19 pandemic. E-learning has democratized contents and assessments processes. Higher education must move along with the growth of e-learning and simulated learning opportunities. Due largely to the recent pandemic, Internet of Things (IoT) and massive open online courses (MOOCs) have significantly taken a greater role towards widening access to education regardless of the geographical area of the world (Zulkifli et al., Citation2020). ICT has enabled learners to plan and direct his/her own learning processes, so each of them takes the responsibility of his/her own learning. It has enabled flexibility in learning through integration and promotion of knowledge sharing about real-world issues among learners and their facilitators (Hallman, Citation2018; Peng et al., Citation2019). ICT allows learners to create, receive and share information for their educational advancement.
In summary, e-readiness assessments help institutions better gauge potential best practices or impact in the e-readiness field. But more importantly, it enables learners to probe the likelihood of success of any anticipated ICT-based e-learning application (such as their e-Assessment, their use of Learning Management Systems, e-learning software, etc.). A higher education e-readiness assessment tool should therefore enable higher education institutions to gauge their readiness to take advantage of the opportunities afforded by ICTs. After all, no institutions of higher learning (which includes teacher education) want to be seen as being digitally backward and non-competitive. E-readiness assessments can serve as a guide on what interventions and policies to take to realistically achieve the institutions’ goals in teaching and learning. The level of e-readiness can also provide an edge to effectively use ICT to create new opportunities for its learners over those that are not e-ready. Therefore, any strategy for the use of technology must be well thought out systematically and incrementally and must include learners as they are at the forefront of ICT usage (Marshall, Citation2010; Sani, Citation2020).
2.1. E-readiness assessment frameworks
Literature has shown that there are various e-readiness assessment tools being developed to benchmark the use of ICTs. However, these readiness assessment tools are commonly used as an instrument to conceptualize and measure the e-readiness of a country (Bwalya & Mutula, Citation2014). Other synonymous labels such as readiness models or readiness framework are also used with the aim to show a start point in the development of a system and to allow for some form of assessment towards achieving a desirable future state. Use of ICT applications provides an edge over those that do not, especially with regards to economic growth and social development, therefore, it has become more important for a country towards ascertaining their e-readiness (Bwalya & Mutula, Citation2014). Notably, e-readiness is not just about the technology, but rather about the development and improvement in services that it ensues. E-readiness is also about the value creation it provides, for example, social value, educational value, or operational value (example, electronic banking), and government functional value (Schware & Deane, Citation2008). The Computer Systems Policy Project (CSPP) created the first e-readiness assessment tool known as the Readiness Guide for Living in the Networked World in 1998. Since then, various well-known tools for e-readiness assessment (better known as macro e-readiness assessment tools), which varies in its complexity and purpose, have been developed (Durek & Ređep, Citation2016). Macro e-readiness tools (examples, E-readiness Ranking Tool, CID e-readiness tool, APEC E-Commerce Readiness Assessment Guide, The Assessment Framework, the Networked Readiness Index, E-records Readiness Tool) contain quantifiable measures that can influence aspects of e-government. This measure has the aim to assist governments decide on areas of importance and improvements affecting the overall e-readiness of the country. These readiness tools have suggested that e-readiness requires a) access and connectivity which deals with physical infrastructure and access to the telecommunications infrastructure, b) training and education covering human capacity resource development which includes education and literacy, and ICT skill levels, c) financial consideration to support current and future technology, and d) policy environment dealing with the legal and regulatory environment affecting ICT. The most recently developed e-readiness assessment tool for education is the SELFIE. SELFIE is a self-reflection tool developed by the European Commission. It serves as a tool to gauge a school’s digital capacity through its seven key areas: Teaching and Learning Practices; Assessment Practices; Content and Curricula; Collaboration and Networking; Professional Development; Leadership and Governance Practices; Infrastructure and Equipment (Costa et al., Citation2021).
Less developed, however, are e-readiness assessment tools for use by higher educational institutions (Durek & Ređep, Citation2016; Machado, Citation2007). Although infrastructure feature and financial consideration are similarly important to e-readiness of any educational institutions, other key elements such as institutional management support, web content availability, flexibility in program and courses, research and innovation must be considered (Aydin & Tasci, Citation2005). Serdyukov (Citation2017) cautions that rapid growth in ICT must not come at the expense of not only the technological readiness but also the pedagogical readiness. Pedagogical readiness encompasses an overall consideration of the delivery medium, how it influences learning and an understanding of the motivation to learn in a technology-rich environment (Hartnett, Citation2019; Laurillard, Citation2002). An understanding of pedagogical aspects must be coupled with the need for leadership, strategic direction and collaboration within the institution to ensure that technology is able to support learning (Machado, Citation2007). However, technologies that are useful today are easily supplanted as newer technologies are being introduced. In the short term, obsolescence can be costly. This must be a factor that requires the host institutions to be responsive to an environment where the procedures used to develop and implement e-readiness are resilient, effective and sustainable, rather than “off the cuff” and dependent on decisions of only a few individuals (Serdyukov, Citation2017).
Goh and Abdul-Wahab (Citation2020) suggest some paradigm shifts that must be present for higher education to remain relevant. Preparation for e-readiness should take into consideration the overall learning environment. They advocate that there must be flexibility in the time frame for the student to come back and to take courses over many years. Open and distance learning (ODL) and modular learning provide an avenue for students to select from a basket of programs more suited to their needs and pace—and not be bordered by a fixed curriculum. On the other hand, institutions of higher learning and the industries can work together to ensure curriculum alignment with industry and employer needs. Providing a platform to integrate knowledge and share new technological know-how is now mandatory for a university to advance and evolve. Sani (Citation2020) and Marshall (Citation2010) advocate that any strategy towards the advancement of technology use must be well thought out systematically and incrementally and must include learners as they are at the forefront of ICT usage. Similarly echoed by Goh and Matthews (Citation2011) and Goh and Canrinus (Citation2019), learners are the best realistic judges of their own learning and learning environments that best meet their needs.
Machado (Citation2007) has developed an initial conceptual e-readiness framework and has also identified initial strategy framework factors influencing e-readiness in higher education. He conceptualizes e-readiness in higher education as “the ability of HEIs [higher education institutions] and the capacity of institutional stakeholders (managers, key ICT persons, teachers and students) to generate (e-) learning opportunities by facilitating computer-based technologies’—in short, how e-ready a HEI is to benefit from educational technology (or e-learning)” (p. 74). Machado’s e-readiness framework assesses the physical and technological aspects of ICT as well as stakeholders’ involvement in ICT use. His framework is aimed at assessing the situation with regard to a university’s capacity to use ICT in education. Application of ICT in teaching and learning, technology access, support and usage of ICT by both academic staff and learners are elements inculcated into the framework.
Challenges facing higher education institutions to get technology and pedagogy in place and be e-ready is not unique. Akin to the early 1990s when software was making a mark in the field of computing and when software process was relatively new and, as with any new field, there was a diversity of meanings, and technical communication was more difficult. Software developers then had “no formal process, no measurements of what they do and no way of knowing when they are on the wrong track or off the track altogether.”(Gibbs, Citation1994, p. 90). This criticism could be said as relevant today of e-readiness within higher educational activities. No matter how ambitious an educational institution is to be at the forefront of a digitally mediated learning, the learning environment must attain some form of e-readiness for its learners—be it the technological infrastructure, administrative functions or the participants itself (Atkinson, Citation2011). An avenue for taking constructive actions to overcome challenges is through the use of an assessment and survey questionnaire (Krosnick et al., Citation2012). Rather than focussing on particular technologies and measures, an e-readiness assessment questionnaire could help learning environment examine the quality and effectiveness of an implementation and to provide objective measures to improve. Therefore, the objective of this study is to identify a number of factors on the basis of which the quality of e-readiness can be measured and to propose the measurement scales for ensuring quality in e-readiness development and delivery.
3. Methodology
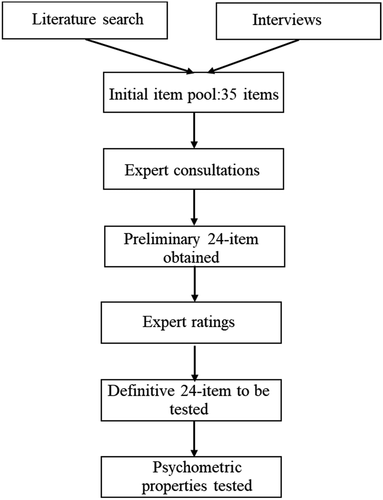
The current study consists of two phases, beginning with the scale development phase aiming at identifying e-readiness constructs. This phase started with a literature search. Semi-structured interviews with 22 educators and preservice teachers were then undertaken. Expert consultations (n = 7) were held to discuss and to establish potential content, usefulness (relevance to the items) and characteristics (such as length, mode of administration and scoring) of the new questionnaire. Expert ratings (n = 25) were also included into the development procedure to find out the item’s e-readiness contribution, on the one hand, and to validate the item’s practical meaningfulness, on the other hand. Thereafter, the scale’s psychometric properties were assessed using exploratory factor analysis, analysis of internal consistency, confirmatory factor analysis (covariance and structural model), and evaluation of both convergent and discriminant validity in an education university in Malaysia. An overview of the procedures applied is shown in .
Figure 1. Overview of study procedures
3.1. Scale development
3.1.1. Literature search
The Web of Science and Scopus databases were searched for studies which had domains or instruments measuring e-readiness in higher education. Key terms such as “measuring e-readiness”, “self-assessment of e-readiness”, “measures of e-readiness”, “e-readiness scales”, “e-readiness assessment models” and ‘e-readiness frameworks’ were used in combination with key terms such as ‘education’, and ‘higher education’. A manual search of the reference lists in any article selected was made to search for additional studies. The manual search strategy was extended by the use of publisher’s search provisions such as Taylor & Francis” “People also read”. The review of available domains or instruments was mainly intended to identify content at the domain level, and to provide information on aspects that could be useful for constructing the final version of the current questionnaire. In addition, the review also helped deduce the essential requirements for ICT together with the pedagogical and curricula provisions in the context of higher education.
3.1.2. Interviews
Semi-structured interviews were conducted (n = 22) with higher educational stakeholders. Participants were chosen to ensure that both educators (n = 2 who were Heads of department; n = 8 who were academics) and preservice teachers (n = 12) were included. The first author conducted the interviews (duration of about 30 minutes) assisted by a script developed specifically for this purpose, which included aspects identified as relevant in the literature search and during the meetings with the co-author. All interviews were recorded digitally and transcribed. The interviews were analysed inductively, applying a thematic approach (Braun & Clarke, Citation2006). The results of this analysis were used to develop an initial list of possible items for inclusion in the questionnaire.
3.1.3. Item generation
The first author, in collaboration with the co-author, generated a 35-item measure guided by available domains from the literature search and interview data. The words and phrasing used by the interviewees were retained wherever possible. A summative rating scale format was chosen in which items are formulated as statements that respondents judge based on agreement, using the commonly applied Likert scale format (Spector, Citation1992). From the various e-readiness questionnaire found during the literature search, some concepts relevant to the present questionnaire are derived. First, the levels of readiness (commonly 4–7 levels with 1 as the lowest) were utilised, followed by the dimensions of readiness with indicative items for each dimensions (normally assessed in 5–9 dimensions). Finally, how the dimensions were assessed, generally through a self-assessment mode, was used together with how the results could be represented numerically (examples were rubrics, graphs, or radar charts).
3.1.4. Consultation with experts
The initial list of items was reviewed in two online meetings with educators (n = 5) and experts (n = 2) in the development of measures. Items considered unsuitable for inclusion in the questionnaire because it was irrelevant to higher education, redundancy of item content, ambiguous content, or lack of face validity were omitted. Take for an example, two items were deemed similarly written: “… arranges mentors and facilitators for industry-academia linkages” and “… had mentors to assist towards better understanding of the profession”. The former was chosen for its clarity and simplicity of its meaning. Some items such as “… has collaboration with international experts from academia and industry for research”, “… promotes the university as local community-focused centres of research with tight linkages with local industry and society in the region” or “… has academic staff with skills in both digital pedagogy and discipline specific digital competences” were deemed not suitable. The justification was that learners might not be able to judge matters pertaining to the research ethos of a university or to the professional qualifications of academic staff.
At this stage, the final e-readiness assessment questionnaire to be tested was a total of 24 readiness items. Each item had four readiness levels where level 4 described the highest attribute of readiness while 1 represented a lack of attributes supporting the concepts of e-readiness within the higher institution. The questionnaire consisted of one closed-ended question per item. Each question required an answer to a Likert-scale reaching from 4—“fully implemented” to 1—“not implemented”. Responses to the questionnaire will serve as data input for the instrument to calculate and represent the readiness level. To make it easier for reference, this e-readiness assessment questionnaire was named HE-eRQ (Higher education e-readiness questionnaire).
3.1.5. Expert ratings
From the expert consultations, it was found that there were overlaps and not all items seemed to be relevant. Therefore, it was deemed important to conduct expert ratings as part of the development procedure to validate each item’s contribution and meaningfulness towards the overall questionnaire. Email of the HE-eRQ was sent to 50 teacher educators of the university of which 25 returned responses. Each readiness items were rated on a Likert-scale with “very important” (rating = 4) to “not important” (rating = 1). For example, the items “continuously expand the university program and product mix to align with student learning” and “recognizes out-of-class learnings done through certifications, work experience and experiential learning at the time of entry” had average scores of 3.5 and 3.0 out of 4, respectively. The 24-item questionnaire had an overall average score of 3.2 out of 4, which supports the relevance of the questionnaire’s content.
3.2. Procedure for testing of the HE-eRQ
3.2.1. Study setting
The ethics approval to conduct this study was obtained from the Research Management and Innovation Centre of the university where this study was carried out (Human Research Committee, Sultan Idris Education University Malaysia, under approval number 2019–0056-1). Having obtained ethics approval, participants were recruited on a volunteer basis from seven faculties of the university (two faculties did not participate). The university from which this study was conducted is a teacher education university; therefore, the learners were better known as preservice teachers. These participants were primarily between the ages of 19 and 23. Participants were also assured that their names would not be used, and confidentiality would be maintained by the authors.
3.2.2. Data collection
The HE-eRQ was tested using two different sets of data. The first data (n = 120) was obtained from a small group of individuals similar to the target population as recommended by several authors (Gall et al., Citation2007; Leedy & Ormrod, Citation2001). The small group study was from 150 preservice teachers undertaking the History major who were invited to participate by the first author. An e-mail to each of the potential participants explained the intention of the HE-eRQ survey. A total of 120 preservice teachers subsequently responded to the request and agreed to take the survey online. The author provided the preservice teachers a URL address by which they could access the online version of the questionnaire. The online survey was identical to the one utilized in the actual study except that the participants were asked to respond to additional items designed to reflect their impressions of the experience. They were also asked to evaluate whether the questionnaire was clear and concise and if they encountered any difficulty utilizing it online. The feedback resulted in minor revisions of some items, consisting of change of word order and shortening some sentences which were too long. These participants were not part of the final online survey.
The second set of data (n = 336) came from a survey of the research population and were administered online through a staff from each faculty (mostly Heads of Department or Course Coordinators) who were able to send out the final online survey through their group emails. The final online survey included statements from the authors informing the participants about the study’s aim and that participation was anonymous and could be withdrawn at any time. It further clarified that the completion and submission of the online survey implied informed consent to participate in the study.
3.2.3. Statistical analysis
The SPSS 22 was used for all statistical analyses. In order to evaluate the factorial structure behind the HE-eRQ, an exploratory factor analysis (EFA) was conducted with the first dataset (n = 120). A principal component analysis with varimax rotation was carried as there was a likelihood that the factors were correlated (Matsunaga, Citation2010). The number of factors to retain was decided with the eigenvalues greater or equal to 1.0 (Costello & Osborne, Citation2005). The reliability analysis and sampling adequacy analyses (Bartlett’s Test of Sphericity and the Kaiser-Meyer-Olkin measure of sampling adequacy) was also carried out with this data
A confirmatory factor analysis was carried out with the second set of data (n = 336) to confirm the factor structure as well as to provide evidence of scale reliability, dimensionality and validity. A structural equation modelling was also carried out to validate the results. To evaluate the fit of the models, several fit indices—chi-square (x2) statistical test, the ratio of chi-square to its degrees of freedom (x2/df), the goodness-of-fit index (GFI), the comparative fit index (CFI), the Tucker–Lewis fit index (TLI), parsimony comparative-fit-index (PCFI), and root mean square error of approximation (RMSEA) were used. In order to represent a good fit, these indices should have values of less than 3 for the x2/df, above 0.60 for the PCFI, above 0.90 for the GFI, CFI and TLI, and below 0.06 for the RMSEA (Arbuckle, Citation2009; Bentler, Citation1990; Hair et al., Citation2014). The chi-square test for significance was not used in this analysis because of its sensitivity to sample size. The larger the sample size, the greater the chances of obtaining a statistically significant chi-square (Hu & Bentler, Citation1999; Schumacker & Lomax, Citation2010). In this study, the sample size was relatively large at n = 336.
Internal consistency (reliability) of the constructs was assessed through composite reliability (CR) based on the recommendations of Nunnally and Bernstein (Citation1994) in which values ≥ 0.7 indicates a proper value of CR. Convergent validity was evaluated through the average variance extracted (AVE), whereby the values of AVE ≥ 0.5 are appropriate indicators of convergent validity (Hair et al., Citation2014). Discriminant validity was established when the square root of the AVE of each factor was higher than the correlation of the specific factor with any of the other factors (Fornell & Larcker, Citation1981). In all circumstances of data collection and statistical analysis, a research assistant assisted the authors.
4. Results from the testing of the HE-eRQ
4.1. Reliability, sampling adequacy and exploratory factor analysis
The reliability, sampling adequacy and exploratory factor analysis were conducted with the first dataset (n = 120). The skewness and kurtosis were within an acceptable range of +2 to −2 (Hair et al., Citation2014) for the study. All items had values below 1.96. The Kaiser-Meyer-Olkin (KMO) measure of sampling adequacy index was conducted and presented an index of 0.96. The second test, the Bartlett’s test of Sphericity, had a significant result of x2 = 5708.8, p < 0.0001. These two indicators revealed that the sample and correlation matrix were within an acceptable range for the analysis.
A total of 66.90% of the item variance, which showed an eigenvalue value of greater than one, could be explained by five underlying factors. All items in this analysis had primary loadings over .50. Hair et al. (Citation2014) considered the power of load factor equal to 0.40 as important and 0.50 as very significant but anything below .40 as low. Three items had a cross-loading above .40 (items 3, 14 and 23); however, these items had strong primary loading of between .68 and .72. The HE-eRQ had Cronbach’s alpha values ranging from .82 to .89 on the dimensions when checked for reliability. The factor loading matrix and alpha values are presented in .
Table 1. Exploratory factor analysis to evaluate the factorial structure behind the HE-eRQ
The first factor was named “Innovativeness” (6 items) which accounted for 14.66% of the total variance and had good internal consistency with a Cronbach’s alpha of 0.89. It looked at the extent to which preservice teachers perceived that there were plans for the university to remain relevant through innovative program offerings or creation of delivery models of teaching and learning that are both innovative and creative. “Infrastructure” (5 items) was named as the second factor and explained 13.69% of variance. Similarly, the internal consistency was good with a Cronbach’s alpha of 0.89. This factor measured the extent to which technology drove not only the student lifecycle but also the entire functioning of the university or that there were evidence of a modern, high-performance network, including campus backbone, improved wireless connectivity and a managed network service for students. The third factor was termed “Collaboration” (5 items) had 13.50% of its variance explained and also had a robust Cronbach’s alpha of 0.86. It looked at whether preservice teachers perceived that there were opportunities for them to collaborate with industry and local society across all aspects of the education—from curricula and faculty to infrastructure, research, study experience and placements. The fourth factor explained 12.63% of the total variance with a Cronbach’s alpha of 0.80 and was called “Learning flexibility” (4 items). It asked the preservice teachers of the availability of eLearning, Blended learning, and the use of MOOC catering to the different variety of learners. The fifth and final factor was called “Student experience” (4 items) and it measured if preservice teachers’ instructional approaches, learning experiences and academic support strategies supported their needs, aspirations and interests. It explained 12.42% of the total variance with a Cronbach’s alpha of 0.82.
4.2. The measurement and structural models
is the measurement model (see model fit in ) verified through a confirmatory factor analysis by using the second dataset (n = 336) and it shows that the HE-eRQ is represented as a multi-dimensional construct as explained by the five factors extracted through the exploratory factor analysis. The items load on the factors in a similar fashion to the exploratory results (see ). Having established confidence in the measurement model, a final structural equation model with standardized coefficients on the structure paths is shown in .
Figure 2. Measurement model
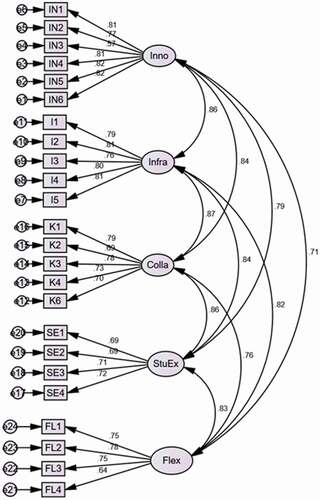
Figure 3. Structural model
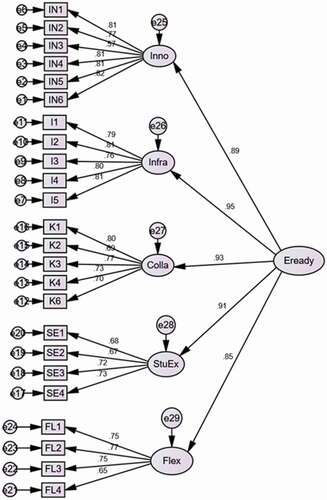
Table 2. Model fit indices
The measurement model () and structural model () are accepted because of accepted level of fit based on the GFI, CFI, TLI, PCFI and RMSEA indices (see ). Both the models () indicate an acceptable model fit of the data (Arbuckle, Citation2009; Bentler, Citation1990; Hair et al., Citation2014). In addition, all the indicators loaded significantly on the corresponding latent construct. In summary, the values of the fit indices indicate a reasonable fit of the measurement model with the sample data (Byrne, Citation2010) while the structural model confirms the five-factor structure of higher education e-readiness from the preservice teachers.
Referring to , the CR for all constructs are above 0.70 and the AVE values are within 0.55 and 0.75. The discriminant validity was assessed using Fornell and Larcker (Citation1981) by comparing the square root of each AVE in the diagonal with the correlation coefficients (off-diagonal) for each construct in the relevant rows and columns. For the colla-infra construct, there is little dispute as the difference is too small at 0.009 and can be ignored (Rahim & Magner, Citation1995). However, in the colla-infra construct, the square root of the AVE (0.746) was only slightly lower than the correlation of the specific construct (0.755). Taking into account that the factor loadings are good and the CR and AVE values for all constructs are all above the required values, it is believed that this is acceptable. Overall, discriminant validity can be accepted for this measurement model and supports the discriminant validity between the constructs.
Table 3. Composite reliability (CR), the average variance extracted (AVE), the square root of the AVE (in bold) and correlations between constructs (off-diagonal)
5. Discussion
For those higher education institutions (HEIs) that want to use ICT for their teaching and learning environment and those that have already implemented e-learning, e-readiness assessment is deemed essential (Machado, Citation2007). This paper has developed and validated an e-readiness assessment tool for HEIs and established a mechanism for supporting and benchmarking e-readiness. The analyses show that the higher education e-readiness questionnaire (HE-eRQ) distinguishes between five e-readiness experiences and holds good psychometric qualities. However, any tool will fail if it is too complex, no doubt practical, but not applicable. Therefore, as an assessment tool, the HE-eRQ can be used by HEIs from two possible ways: 1) as a planning and analyses strategy tool; and 2) as a quality assurance tool (assess current quality level and to identify improvement area). The summarization and signification of dimensions used in HE-eRQ can help HEIs in the process of development, adoption and implementation of e-readiness.
5.1. Planning and analysis strategy tool
This is a three-step process-oriented strategy. Step one entails the HEIs in using the tool to plan and analyse the practical needs of HEIs. HEIs should be able to assess the quality of ICT infrastructure provision to allow curriculum innovation, collaboration and learning flexibility. It would be important to have appropriate ICT infrastructure to cater to the demand of the students and also the alternate program offerings that offer a learning blended with student experiences—where the traditional on-campus enrolments are intermixed with self-driven MOOCs and online courses. Although the curricula coverage should have a balanced theoretical and foundational aspect, it should be with the aim of preparing a workforce for the industry and real-world application of knowledge that are sought by employers in a rapidly changing workplace today. With technology greatly impacting learning, HEIs need to augment their curriculum to address these life skills to remain relevant. Therefore, in the planning and analysis step, new or existing preparation for e-readiness must be planned and analysed and best features should be incorporated in the overall strategy. Step two is akin to the “launch pad”. This step requires HEIs to develop a prototype of the overall network, system, learning platform and training for e-readiness. The aim of step two is to provide HEIs the needed feedback of the running, cost and additional quality improvement measures that should be taken. Primarily this stage requires maximum focus and efforts else problems may arise in the implementation step. Finally, in step three, HEIs continuously monitor and assess the effectiveness towards quality improvement. The HE-eRQ should then be used to assess the e-readiness and to identify improvement area. The second suggested usage of HE-eRQ comes to play.
5.2. Quality assurance tool
Ideally, the questionnaire should be integrated into a webpage where it can be easily processed by a software and the results automatically calculated and summarized in a compact e-readiness report. The suggestion is for the website to contain a “dashboard” of information, including all e-readiness levels and its interpretation of the e-readiness levels. A detailed definition and determinations of each e-readiness levels should also be provided. Importantly, any explanation and presentation of the e-readiness levels must serve as a platform for the institutions’ strategic planning, decisions and improvement. In order to provide an example of how the HE-eRQ is used and tabulated, this paper provides one case study using the second set of data’s responses (n = 336).
shows how all five dimensions are depicted. A radar (or spider) chart is used to visualize the overall result. Each dimension results from calculating the weighted average of all e-readiness items within its related dimension. The weighting factor equals the average from all responses.
Figure 4. Radar chart visualizing e-readiness in five dimensions
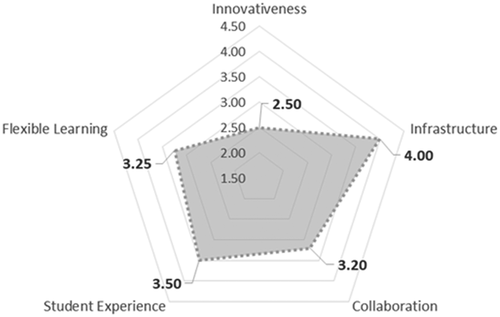
To increase better understanding about e-readiness, the assessment and calculation of the dimension “Innovativeness” is presented in . The preservice teachers self-assessed their university’s e-readiness in “Innovativeness” through six items (please refer to for full statement of each item).
Figure 5. Detailed results for dimension “Innovativeness”
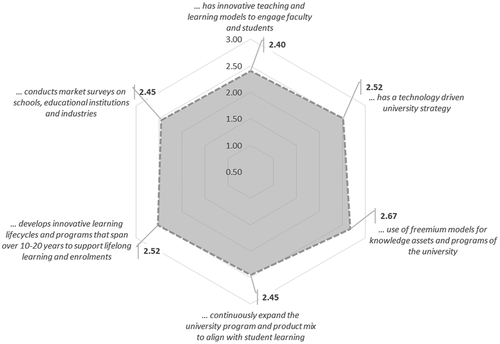
The seemingly high e-readiness level in the dimension “Infrastructure” (see ) is justifiable, as the university under this study has been consistently upgrading and creating robust technology led infrastructure facilities that is both competitive with the external environment and compatible with the internal learner requirements. For example, measured e-readiness items in this dimension are (among others) “prepares a technology-led strategy where technology drives the entire functioning of the university”, “develops off campus learning centres to provide global exposure and partnership development for learners”, the “access to information and systems as open and accessible as possible so that data can be consumed in new and innovative ways” and “invests in a modern, high-performance network, improved wireless connectivity and a managed network service for student use” or “revisits existing policies and procedures to encourage innovative use of technology by students”. It is plausible that preservice teachers in this university perceived that they have been provided with appropriate ICT and web-based infrastructure and tools to facilitate online learning together with perceived existence of long-term planning to achieve the required academic goals. The moderately high e-readiness levels in other dimensions (except for “Innovativeness”) appear accurate as well, as the university of this study is considered a forerunner in teacher education in Malaysia (in fact the only teacher education university in the country) and has been aggressively adapting the concepts of Higher Education 4.0. That the dimension “Innovativeness” (see ) shows a rather dismal level bodes some concern. According to Serdyukov (Citation2017), there is a conflict between expectations of ICT effectiveness and actual applications in teaching and learning. He succinctly argues that the fascination with technology “underestimates the need for sound pedagogy and quality teacher preparation” (p. 14). The appeal of having the best technology may have overshadow the need for innovations, such as “theoretical foundation, particularly pedagogy, psychology, and instructional methodology that are a true underpinning of teaching and learning” (p. 13). Could the preservice teachers not experience “innovative teaching and learning models to engage faculty and students”, or a “university program and product mix to align with student learning” and “innovative learning lifecycles and programs that span over 10–20 years to support lifelong learning and enrolments”? In this study, the low levels of “Innovativeness” could also reflect a need among educators to innovate and explore new ideas in teaching and learning. No doubt, the recent covid-19 pandemic has shown how necessary it is to integrate technology into teaching and learning. Nevertheless, while taking advantage of effective educational technologies, educators still need to innovate, experiment and apply new or different pedagogical approaches, curricular enhancement, and course design.
6. Conclusion
This study presented here aims for the development of a self-assessment questionnaire for assessing the e-readiness of higher education institutions and to assess its psychometric properties. The analyses show that the learners’ (in this study, preservice teachers) are able to distinguish between five e-readiness elements. The five-factor structure identified in the analysis shows that the HE-eRQ scale can capture various learners’ perspectives towards their own higher education’s e-readiness, which implies that they have opinions and can assess issues relating to aspects of e-readiness. Although there are various studies looking at the macro level of e-readiness, studies of learner experiences are rarer in the empirical literature therefore this findings support the feasibility of conducting such studies. According to the results, learners seem moderately knowledgeable about e-readiness requirements, and this could provide valuable input towards improving an institutions’ e-readiness situation. This also implies that engaging learners in assessing a situation in which they are directly involved in for improvement is possible. The result that indicated the lack of teaching and learning innovation must be re-assessed as to why since this could impair any effort towards creating an effective teaching and learning environment using technology.
Although the HE-eRQ scale’s psychometric properties are satisfactory, the applicability, validation and generalizability of the scale must be further confirmed in future studies in other higher educational settings, nationally and internationally. A mixed-method approach to enrich the interpretation of results by collecting qualitative data is suggested. Improvements of the HE-eRQ are not only limited to strengthening the robustness of each items but also to define strategic steps to reach the intended e-readiness levels. It must be noted that the use of the HE-eRQ self-assessment questionnaire will not automatically enable the HEIs to attain e-readiness. However, it is an assessment tool which institutions can use to determine their own stand with regards to e-readiness or to use it to reflect their e-readiness status and the ensuing decision that will follow.
Acknowledgements
This work was supported by the Fundamental Research Grant Scheme (FRGS) from the Ministry of Higher Education, Malaysia (under grant number FRGS/2019-0034-107-02) given to the first author. Special thanks go to the editors and the reviewers who have unselfishly expended their time to provide helpful comments and suggestions.
Additional information
Funding
Notes on contributors
Pauline Swee Choo Goh
Pauline SweeChoo GOH is an Associate Professor at the Sultan Idris Education University, Malaysia. Her publications, research interests and expertise are focused on developing and improving both pre-service and beginning teachers’ knowledge, skills and practices. She has been a Lead Investigator on multiple international and national grants, including a recent Fundamental Research Grant Scheme of the Ministry of Education Malaysia to develop an e-readiness model to remedy the widespread shortcomings to assess Higher Education 4.0 readiness.
Damian BLAKE is Head of School for Deakin University’s School of Education, and an active member of the Victorian Council of Deans on Education (VCDE) and Australian Council of Deans of Education (ACDE). His research interests include applied learning, educational partnerships, leadership and initial teacher education. He has been a Chief Investigator (CI) on multiple grants, including two recent Australian Research Council (ARC) grants in partnership with four other Australian universities.
References
- Al Mulhem, A. (2020). Investigating the effects of quality factors and organizational factors on university students’ satisfaction of e-learning system quality. Cogent Education, 7(1), 1–24. https://doi.org/https://doi.org/10.1080/2331186X.2020.1787004
- Arbuckle, J. L. (2009). AMOS 18 user’s guide. http://www.sussex.ac.uk/its/pdfs/Amos_18_Users_Guide.pdf
- Atkinson, S. (2011). Teaching off-line digital video editing on-line: An exploration into editing and postproduction digital pedagogic practice. In C. Wankel & J. S. Law (Eds.), Streaming media delivery in higher education: Methods and outcomes (pp. 121–135). IGI Global. https://doi.org/https://doi.org/10.4018/978-1-60960-800-2
- Aydin, C. H., & Tasci, D. (2005). Measuring readiness for e-learning: Reflections from an emerging country. Educational Technology & Society, 8(4), 244–257.
- Bentler, P. M. (1990). Comparative fit indexes in structural models. Psychological Bulletin, 107(2), 238–246. https://doi.org/https://doi.org/10.1037/0033-2909.107.2.238
- Braun, V., & Clarke, V. (2006). Using thematic analysis in psychology. Qualitative Research in Psychology, 3(2), 77–101. https://doi.org/https://doi.org/10.1191/1478088706qp063oa
- Bwalya, K. J., & Mutula, S. M. (2014). E-government implementation, adoption and synthesis in developing countries. Walter de Gruyter GmbH & Co KG.
- Byrne, B. M. (2010). Structural equation modeling with Amos: Basic concepts, applications, and programming (2nd ed.). NY: Taylor and Francis Group.
- Costa, P., Castano-Munoz, J., & Kampylis, P. (2021). Capturing schools’ digital capacity: Psychometric analyses of the SELFIE self-reflection tool. Computer & Education, 162(1), 104080. https://doi.org/https://doi.org/10.1016/j.compedu.2020.104080 Article
- Costello, A. B., & Osborne, J. W. (2005). Best practices in exploratory factor analysis: Four recommendations for getting the most from your analysis. Practical Assessment, Research and Evaluation, 10(7), 1–9. https://doi.org/https://doi.org/10.7275/jyj1-4868
- Darling-Hammond, L., Flook, L., Cook-Harvey, C., Barron, B., & Osher, D. (2019). Implications for educational practice of the science of learning and development. Applied Developmental Science, 24(2), 97–140. doi:https://doi.org/https://doi.org/10.1080/10888691.2018.1537791
- Durek, V., & Ređep, N. B. (2016). Review on e-readiness assessment tools. https://pdfs.semanticscholar.org/d822/753d83d09ff6068c7153b4bf6394dade3fa6.pdf
- Dutta, S., Mia, I., & Geiger, T. (2011). The networked readiness index 2010–2011: celebrating 10 years of assessing networked readiness. In S. Dutta & I. Mia (Eds.), The global information technology report 2010–2011 (pp. 3–32). World Economic Forum and INSEAD.
- Fornell, C., & Larcker, D. F. (1981). Evaluating structural equation models with unobservable variables and measurement error. Journal of Marketing Research, 18(1), 39–50. https://doi.org/https://doi.org/10.1177/002224378101800104
- Fry, H., Ketteridge, S., & Marshall, S. (2009). Understanding student learning. In H. Fry, S. Ketteridge, & S. Marshall (Eds.), A handbook for teaching and learning in higher education (pp. 8–26). Routledge.
- Gaertner, M. N., Conley, D. T., & Stolz, P. G. (2016). On track: redefining readiness in education and the workplace. https://www.pearsoned.com/wp-content/uploads/RINVN9943_RedefiningReadiness_PK_Final_020116_HR.pdf
- Gall, M. D., Gall, J. P., & Borg, W. R. (2007). Educational research: an introduction (8th ed.). Pearson.
- Gibbs, W. W. (1994). Software’s chronic crisis. Scientific American, 271(3), 86–95. doi:https://doi.org/https://doi.org/10.1038/scientificamerican0994-86
- Goh, P. S. C. (2019). Implementing narrative-pedagogical approaches in a teacher education classroom. The Qualitative Report, 24(7), 1731–1746.
- Goh, P. S. C., & Abdul-Wahab, N. (2020). Paradigms to drive higher education 4.0. International Journal of Learning, Teaching and Educational Research, 19(1), 159–171. https://doi.org/https://doi.org/10.26803/ijlter.19.1.9
- Goh, P. S. C., & Blake, D. (2015). Teacher preparation in Malaysia: needed changes. Teaching in Higher Education, 20(5), 469–480. https://doi.org/https://doi.org/10.1080/13562517.2015.1020780
- Goh, P. S. C., & Canrinus, E. T. (2019). Preservice teachers’ perception of program coherence and its relationship to their teaching efficacy. Pertanika Journal of Social Science & Humanities, 27(T2), 27–45.
- Goh, P. S. C., Canrinus, E. T., & Wong, K. T. (2020b). Preservice teachers’ perspectives about coherence in their teacher education program. Educational Studies, 46(3), 368–384. https://doi.org/https://doi.org/10.1080/03055698.2019.1584856
- Goh, P. S. C., Loy, C. L., Abdul-Wahab, W., & Raja Safinas, R. H. (2020a). Preschool teachers’ use of English as a medium of instruction: A systematic review of barriers and strategies. Issues in Education Research, 30(3), 943–964.
- Goh, P. S. C., & Matthews, B. (2011). Listening to the concerns of student teachers in Malaysia during teaching practice. The Australian Journal of Teacher Education, 36(3), 92–103. https://doi.org/https://doi.org/10.14221/ajte.2011v36n3.2
- Hair, J. F., Black, W. C., Anderson, R. E., & Babin, B. J. (7th ed.). (2014). Multivariate data analysis. Pearson Education Limited.
- Hallman, H. L. (2018). Personalized learning through 1:1 technology initiatives: Implications for teachers and teaching in neoliberal times. Teaching Education, 30(3), 299–318. https://doi.org/https://doi.org/10.1080/10476210.2018.1466874 Advanced online publication
- Harkins, A. M. (2008, March 28). Leap frog principles and practices: Core components of education 3.0 and 4.0.. Futures Research Quarterly Draft, VIII, 1–15.
- Hartnett, M. (2019). Motivation in distance education. In M. G. Moore & W. C. Diehl (Eds.), Handbook of distance education (4th ed., pp. 145–157). Taylor & Francis Group: Routledge.
- Hauke, E. (2019). Understanding the world today: The roles of knowledge and knowing in higher education. Teaching in Higher Education, 24(3), 378–393. https://doi.org/https://doi.org/10.1080/13562517.2018.1544122
- Hu, L., & Bentler, P. M. (1999). Cut-off criteria for fit indexes in covariance structure analysis: Conventional criteria versus new alternatives. Structural Equation Modeling, 6(1), 1–55. https://doi.org/https://doi.org/10.1080/10705519909540118
- Kinshuk, N. S. C., Cheng, I. L., & Chew, S. W. (2016). Evolution is not enough: Revolutionizing current learning environments to smart learning environments. International Journal of Artificial Intelligence in Education, 26(1), 561–581. https://doi.org/https://doi.org/10.1007/s40593-016-0108-x
- Kneale, P. (2009). Teaching and learning for employability Knowledge is not the only outcome. In H. Fry, S. Ketteridge, & S. Marshall (Eds.), A handbook for teaching and learning in higher education (pp. 99–112). Routledge.
- Krosnick, J. A., Presser, S., Fealing, K. H., & Ruggles, S. (2012). The future of survey research: Challenges and opportunities. https://www.nsf.gov/sbe/AC_Materials/The_Future_of_Survey_Research.pdf
- Laurillard, D. (2002). Rethinking university teaching: A conversational framework for the effective use of learning technologies (2nd ed. ed.). Routledge Falmer. https://doi.org/https://doi.org/10.4324/9780203304846
- Leedy, P., & Ormrod, J. (2001). Practical research: Planning and design (7th ed.). NJ: Pearson.
- Machado, C. (2007). Developing an e-readiness model for higher education institutions: Results of a focus group study. British Journal of Educational Technology, 38(1), 72–82. https://doi.org/https://doi.org/10.1111/j.1467-8535.2006.00595.x
- Marshall, S. (2010). A quality framework for continuous improvement of e-learning: The e-learning maturity model. Journal of Distance Education, 24(1), 143–166.
- Matsunaga, M. (2010). How to factor-analyze your data right: Do’s, don’ts and how-to’s. International Journal of Psychological Research, 3(1), 97–110. https://doi.org/https://doi.org/10.21500/20112084.854
- Nunnally, J. C., & Bernstein, I. H. (1994). Psychometric theory. McGraw Hill.
- OECD. (2016). Innovating education and educating for innovation: the power of digital technologies and skills. https://doi.org/https://doi.org/10.1787/9789264265097-en
- Peng, H., Ma, S., & Spector, J. M. (2019). Personalized adaptive learning: An emerging pedagogical approach enabled by a smart learning environment. Smart Learning Environments, 6(9), 1-14. https://doi.org/https://doi.org/10.1186/s40561-019-0089-y
- Rahim, M. A., & Magner, N. R. (1995). Confirmatory factor analysis of the styles of handling interpersonal conflict: First-order factor model and its invariance across groups. Journal of Applied Psychology, 80(1), 122–132. https://doi.org/https://doi.org/10.1037/0021-9010.80.1.122
- Readiness for the networked world. (n.d.). https://cyber.harvard.edu/readinessguide/guide.pdf
- Richardson, J. W., Nash, J. B., & Flora, K. L. (2014). Unsystematic technology adoption in Cambodia: Students’ perceptions of computer and internet use. International Journal of Education and Development Using Information and Communication Technology, 10(2), 63–76.
- Sani, R. (2020, April 15). Readiness for continuity in online learning. The New Straits Times, https://www.nst.com.my/education/2020/04/584436/readiness-continuity-online-learning
- Schumacker, R. E., & Lomax, R. G. (2010). A beginner’s guide to structural equation modeling (3rd ed. ed.). Routledge Academic.
- Schware, R., & Deane, A. (2008). Deploying e-government programs: The strategic importance of “I” before “E”. Info, 5(4), 10–19. https://doi.org/https://doi.org/10.1108/14636690310495193
- Serdyukov, P. (2017). Innovation in education: What works, what doesn’t, and what to do about it? Journal of Research in Innovative Teaching & Learning, 10(1), 4–33. https://doi.org/https://doi.org/10.1108/JRIT-10-2016-0007
- Spector, P. E. (1992). Summated rating scale construction: An introduction. Sage.
- Tongkaw, A. (2013). Multi perspective integrations Information and Communication Technologies (ICTs) in higher education in developing countries: Case study Thailand. Procedia - Social and Behavioral Sciences, 93, 1467–1472. https://doi.org/https://doi.org/10.1016/j.sbspro.2013.10.065
- U.S. Department of Education. (2017). Re-imagining the role of technology in education: 2017 national education technology plan update. https://tech.ed.gov/files/2017/01/NETP17.pdf
- Wongwuttiwat, J., & Lawanna, A. (2018). The digital Thailand strategy and the ASEAN community. Electronic Journal of Information Systems in Developing Countries, 84(3), 1–15. https://doi.org/https://doi.org/10.1002/isd2.12024
- You, Y. (2017). ICT Integration in teacher education: A teacher training institute case in Lao PDR (Master’s Thesis, Seoul National University). http://s-space.snu.ac.kr/bitstream/10371/127249/1/000000142635.pdf
- Zulkifli, N., Hamzah, M. I., & Abdul Razak, K. (2020). Isu dan cabaran penggunaan MOOC dalam proses pengajaran dan pembelajaran [Issues and challenges of MOOC in the process of teaching and learning]. Journal of Research, Policy & Practice of Teachers &teacher Education, 10(1), 77–94. https://doi.org/https://doi.org/10.37134/jrpptte.vol10.1.6.2020