
 ?Mathematical formulae have been encoded as MathML and are displayed in this HTML version using MathJax in order to improve their display. Uncheck the box to turn MathJax off. This feature requires Javascript. Click on a formula to zoom.
Abstract
Research has established that class attendance and High School Grade Point Average (HSGPA) play a significant role in student academic success in higher education. The study uses census data and records of 969 undergraduate students at Qatar University to investigate the impact of HSGPA, attendance, and socio-demographic factors on academic performance in higher education in DFW courses (grades D, F, or withdrawal). Findings indicate that increased attendance decreases the likelihood of getting DFW, and there was a strong negative relationship between high-school performance and the probability of getting DFW. This study highlights the importance of class attendance in a four-year institution and that high school academic performance acts as a foundation for their performance in a higher educational institute. These findings open pathways for modifications of institutional policies governing institutional academic decisions.
PUBLIC INTEREST STATEMENT
Universities are working hard to support students so they can attain academic success. The more information universities have about students, the better equipped they are to identify students’ needs and provide students the assistance they need to experience academic achievement. Manythings influence success in higher education, specifically high school grade point average (HSGPA) and class attendance at the university. If students attend class and have a high HSGPA, they are less likely to receive a low grade. Identifying these factors enables universities to design and implement programs that encourage student attendance. HSGPA allows a more accurate prediction of first-year students’ undergraduate performance, enabling colleges to make accurate course placement decisions. This study suggests that universities move beyond simply students attending class and examine class attendance dimensions, such as the specific classroom engagement behaviors and cognitive strategies of high-performing students as predictors of academic performance.
1. Introduction
Students’ class attendance and past academic achievement at any educational institution greatly influence their achievements and academic performance. As the accountability of attendance and the choice to attend a class or not solely rest on students, studies have shown that absenteeism poses a real problem in higher education (Akumu, Citation2018; Cleary-Holdforth, Citation2007; Romer, Citation1993). Research has demonstrated that an important predictor of academic performance is class attendance (Fadelelmoula, Citation2018; Kirby & McElroy, Citation2003; Silvestri, Citation2003). Students’ High School Grade Point Average (HSGPA) is a more accurate predictor of college performance than standardized exam scores (Geiser & Santelices, Citation2007). These academic habits influence one’s learning patterns, sense of responsibility, and drive toward hard work. These behavioral characteristics have a long-term impact and are usually carried over to the person’s post-educational character (Akumu, Citation2018). These are vital for the future of any nation that is highly dependent on the advancements in knowledge achieved by its young citizens (Al-Sheeb et al., Citation2019). Students, human capital, and the future leaders and shapers of a nation’s economy are often gauged by their graduate competency achieved through their academic performance (Norhidayah et al., Citation2009).
At Qatar University (QU), class attendance is crucial in maintaining academic integrity, enriching the learning experience, and achieving course-learning outcomes in undergraduate courses. Although attendance has been extensively studied, this study was conducted based on the specific context and concern. First, Qatar’s education system has gone through extensive reform over the past two decades, and there are no studies that address attendance and HSGP. Also, unlike other university systems where class attendance can be optional or fully required, QU is modeled after the US university system, where students are given some room for missing classes. At QU, undergraduate students are expected to attend all classes. Students are allowed to miss 25% of classes during a semester, as per the university rules. Regardless of their performance, students who exceed this limit will receive a failing grade. Researchers wanted to gain possible insights in the “fit” of a US model in this particular setting and gain information about HSGPA in the Qatari context.
With that in mind, this study seeks to investigate the impact of student attendance and HSGPA on their academic performance in higher education. Academic performance for this study’s purpose is defined as the letter grades obtained by students in selected first-year undergraduate courses, most of which are identified as DFW courses. DFW courses are those with high enrollment and a high percentage of the D, F, or withdrawal.
At this point, it is worth mentioning that low performance has been measured solely by the percentage of F grades in the past. This is a bit misleading, as many teachers purposefully add points to students bordering the D range, which renders the D grade imbalanced. However, in recent years, higher education institutes considered the D grade as a borderline in their studies about over-performance versus underperformance. This balances the grade curve with the grades A and B to the right, C in the middle, and D and F to the left (Roberts et al., Citation2018). On the other hand, withdrawal rate could indicate the effectiveness, or lack thereof, of an institution, impacting enrollment, class schedules, faculty teaching load, and resource management, to name a few. Combining all three, D, F, and W, would give a wholesome picture of student learning efficiency and faculty effectiveness.
This study seeks to investigate the impact of student attendance and HSGPA on their academic performance in higher education. The research is crucial towards understanding the association of the two factors, attendance, and HSGPA, against academic performance to assess their significance among each other. This study also examines the relationship between student demographics and their college academic performance. This study’s findings highlight the importance of attendance in a four-year institution, which will open pathways for modifications of institutional policies governing institutional academic decisions.
Moreover, local educators found in practice that, for instance, female students outperform their male peers, and international students outperform their national peers. This observation motivated the authors to include these two demographic characteristics, as is customary in statistics, to test them to identify their relative importance, significance, and collective effect on student academic performance.
The paper is organized as follows. The first section of this paper presents a literature review of previous studies related to the current research concerning the impact of student attendance and HSGPA on their academic performance. This is followed by an explanation of the research methodology and the process of data gathering. Results are then presented and discussed in subsequent sections. The paper concludes with suggestions for future research.
2. Literature review
Scholars have examined the relationship between students’ absenteeism and academic performance for decades. Research consistently reported that in the US class absenteeism undermines students’ academic performance. Romer (Citation1993) examined the relationship between students’ absenteeism and their academic performance using the attendance records of 195 students registered in undergraduate economics courses at various size universities in the US. Romer reported that academic performance has a positive significant association with attendance suggesting the use of obligatory class attendance to enhance students’ academic performance. Geiser and Santelices (Citation2007) studied students at UC Berkeley and reported that HSGPA is regularly the best predictor of freshman grades in college and the result indicator most often used in predictive-validity studies, but of four-year college outcomes as well.
Outside the US, Stanca (Citation2006) studied students in introductory microeconomics in Milan. The findings indicated that attendance had “statistically significant and quantitatively relevant effect “on student learning when controlling for unobservable student characteristics. Kassarnig et al. (Citation2017) examined nearly 1,000 undergraduate students in Denmark, and findings demonstrated that consistent class attendance strongly correlates with academic performance. Teixeira (Citation2016). In Portugal, Teixeira (Citation2016) reported data on 146 second-year management students enrolled in a Macroeconomics course that demonstrated that when controlling for potential endogenous factors associated with attendance and academic performance, absenteeism considerably lowers the students’ final grades by about two points.
Various studies conducted in South Africa (Schmulian & Coetzee, Citation2011), a British university campus in the Middle East (Pani & Kishore, Citation2016) and a European University (Landin & Pérez, Citation2014), demonstrated the class attendance greatly influences academic outcomes, meaning that low performing students are more affected by absenteeism compared to high performing students.
Furthermore, in a study conducted in Kuwait by Al-Shammari (Citation2016) in higher education to enhance student attendance through classroom management, three consecutive studies were conducted (pilot, a culminating, and replication studies). One of the leading research findings reported a significant positive correlation between student attendance and academic performance. Schmulian and Coetzee (Citation2011) investigated the reasons for not attending a large accounting class in South Africa. They tested the theories’ generalizability related to the positive correlation between class attendance and academic performance and reported a significant positive correlation between attending and academic performance. However, this correlation is low and not very meaningful.
Prior research also suggests that HSGPA is an important predictor of academic success in college. Geiser and Studley (Citation2003) reported that HSGPA is the best predictor of a student’s successful college performance. According to both studies, this result applies to grades in students’ first year and subsequent years until graduation, exhibiting a long-term effect on student performance. Platt et al. (Citation2001) found a positive association between HSGPA and the academic success of 373 graduates of athletic training and five other allied health disciplines in a private university in the US. A similar positive relationship was also found among 1,368 undergraduate business students comprising nine academic years of college in Saudi Arabia by Sulphey et al. (Citation2018). Farrington et al. (Citation2012) found that students’ HSGPA measures more than cognitive skills in that it provides insight into “non-cognitive factors” such as self-control, academic motivation, study skills, time management, and problem-solving skills (Hodara & Lewis, Citation2017).
Since there is limited research in the Gulf Cooperation Council (GCC) region and no research done in Qatar that specifically addresses attendance and HSGPA, this study is crucial towards understanding the association of the two factors, attendance, and HSGPA, against academic performance, to assess their significance among each other. Also, findings highlight the importance of attendance in a four-year institution, which will open pathways for modifications of institutional policies governing institutional academic decisions, specifically in the GCC and Qatar context.
2.1. High school GPA and academic performance
HSGPA is a cumulative index of letter grades. Most empirical studies’ findings provide evidence of the predictive power of HSGPA in measuring student readiness for college and report a positive significant influence on their subsequent academic performance (Hodara & Lewis, Citation2017; Singh & Maloney, Citation2019). According to Oztekin (Citation2016), there is an increasing trend of predicting student performance in college courses. Universities are considering this approach to ensure an increasing graduation rate, which in turn improves their ranking. This study provided a “hybrid data analytic approach” that can predict graduation rates, depending on high school performance. Other factors were also considered while doing this analysis, which can impact graduation rates. These include the high school that the student attended and their residence status. The three analytical models showed a significant effect between the proposed factors and student performance in college. Additionally, French et al. (Citation2015) focused on the relationship between GPA, education level, and salary after graduation. A longitudinal study on a group of young adults between the ages of 24–34 was conducted. The findings showed that HSGPA has a significant relationship with high education level and in early years’ salary. A good HSGPA increases the chances of securing university admission and also increases the chances of successful graduation.
Islam and Al-Ghassani (Citation2015) examined student performance in high school on their performance in the College of Science of Sultan Qaboos University. A hierarchical multiple linear regression analysis was done to check the validity of factors. The results showed that students who received high math scores in high school also received a better Calculus I grade. It can be inferred that high school performance is an effective criterion to predict student performance in college and can be a useful tool in the admission and selection process. Gipson (Citation2016) examined student success in college by considering students’ different types of HSGPA (overall, core, mathematics, or science) within STEM majors. Multiple linear regression and correlation analyses were done using SPSS. The data analysis results showed a positive correlation between all the types of HSGPA of students and their GPA in three years of college. The researcher suggested that the research data analysis information can be used for further research by identifying the predictive relationship between high school performance and university GPA.
Richardson et al. (Citation2012) conducted a qualitative study reviewing and synthesizing 13 years of research into university students’ GPAs. They identified five conventional correlates of undergraduates: GPA and HSGPA and three demographic factors (sex, age, and socioeconomic status). Their results show acceptable validity of HSGPA in predicting success at universities and that female students, older students, and students from higher socioeconomic backgrounds obtained higher grades.
On the other hand, Yousef (Citation2017) focused on investigating different factors that affect the university level’s student success rate in a higher education institute in the United Arab Emirates. Descriptive statistics analyzed the collected data, and the findings indicated a positive correlation between different teaching practices and class communications at the university level on the student’s performance. Proper high school education plays an essential role in a university student’s success and graduation rates.
Moreover, Allensworth and Clark (Citation2020) tested how accurate the assumption that HSGPA has increased over time without concurrent changes in standardized test scores when all students are examined for similar tasks under the same conditions. The findings of their work on a sample size of 17,753 students of Chicago Public Schools indicated that HSGPA is a better predictor of students’ college completion than standardized test scores. On the other hand, Sawyer’s (Citation2010 & Citation2013) studies on 192 four-year postsecondary institutions in the US tested the better determinant of academic success measured by first-year college students. They suggested that HSGPA is better than standardized test scores when there is low selectivity in admissions and minimal-to-average academic performance in college. In contrast, in situations that involve high selectivity and high academic performance, students’ test scores are more valuable than HSGPA, and in nearly all contexts, test scores have incremental usefulness beyond HSGPA. Another study by Xiang and Hinchliffe (Citation2019) examined those three factors that may determine students’ choice of repeating a course in accounting (college GPA, interest in accounting subject, and student’s self-motivation). The study was conducted on students in first college-level accounting in a US mid-west public university. Data analysis of the study suggested that high school achievements should be taken into account for the proper and efficient prediction of a university’s success.
2.2. Attendance and academic performance in higher education
While a considerable amount of literature exists on school attendance and its impact on students’ academic performance, the literature on the impact of university attendance on academic performance and its importance is limited (Paisey & Paisey, Citation2004). As the accountability of attendance and the choice to attend a class or not solely rest on students, studies have shown that absenteeism poses a real problem in higher education (Akumu, Citation2018; Cleary-Holdforth, Citation2007; Romer, Citation1993). The attendance of students at any educational institution has a strong influence on their achievements and academic performance. These habits influence one’s learning patterns, sense of responsibility, and drive toward hard work. These behavioral characteristics have a long-term impact and are usually carried along over to the person’s post-educational character (Akumu, Citation2018). In a study conducted at a regional four-year institute, Rochelle and Dotterweich (Citation2007) assessed the dynamics affecting its students’ academic performance majoring in business. The sample included 93 students taught by the same instructors across four sections of business statistics. Findings concluded that their attendance most influenced students’ success and academic performance in the business statistics course, their grades in Algebra and Differential Calculus, and their overall academic performance in terms of their GPA. Attendance of college students is essential for the student’s personal growth and academic success and is a critical part of their educational progress (Mushtaq et al., Citation2019). Being repeatedly absent from college can lead to missing important learning opportunities, developing new skills, and acquiring new educational and technical abilities. This fragmented attendance trend leads to many negative non-college consequences on the students’ future outcomes, such as substance abuse, crime, and delinquency (Sanchez et al., Citation2015).
Moreover, fragmented attendance can make students face academic disengagement due to the missed instructions and can cause them social anxiety due to feelings of underachievement. Soland et al. (Citation2019) discussed in their research that academic disengagement emerges as a self-management issue that slowly turns into chronic absenteeism, thereby resulting in course completion failure. Such disruptive behaviors lead to creating a negative loop of absenteeism and increasing the risk of dropping out of school.
2.3. Factors influencing low attendance
Researchers identified several possible reasons for student absence. Those reasons vary from acceptable excuses like illness (Massingham & Herrington, Citation2006; Moore et al., Citation2008; Woodfield et al., Citation2006), tiredness (Woodfield et al., Citation2006), part-time work (Massingham & Herrington, Citation2006; Paisey & Paisey, Citation2004; Woodfield et al., Citation2006), family obligations (Moore et al., Citation2008) and language barriers (Paisey & Paisey, Citation2004). Less valid excuses include sleeping late (Massingham & Herrington, Citation2006) and social, recreational, and leisure activities (Longhurst, Citation1999; Moore et al., Citation2008).
According to Kottasz (Citation2005), motivation is an important construct in the study of absence that has been studied extensively in the educational literature. The motivation of students who want to learn is much different from those who have to learn. Having the desire to learn is a sufficient reason for students to attend. Lukkarinen et al. (Citation2016) suggest that other factors such as the university culture, workload, teaching methods, and the instructor can influence attendance.
2.4. Attendance at Qatar University
Class participation and attendance are important elements of every student’s learning experience at QU, and the student is expected to attend all classes. Keeping track of student attendance and observation of student performance in class are the responsibilities of the instructor. According to the Qatar University Undergraduate Catalog, a student should not miss more than 25% of the classes, except the College of Medicine, where students are expected not to exceed 10% of absence during any given semester. Those exceeding this limit will receive a failing grade, regardless of their performance. The instructor will determine the validity of an excuse for being absent. A student who misses more than 25% of classes with a valid excuse approved by the instructor will be allowed to withdraw from the course.
2.5. Demographic factors and impact on academic performance
The literature illustrates that specific factors of age, gender, nationality, and high school significantly influence student performance and satisfaction in school or university (Green & Celkan, Citation2011; Nawa et al., Citation2020; Schreiber et al., Citation2017). Yousef (Citation2019) conducted research focused on the academic and demographic factors impacting student academic performance. The demographic and academic factors include age, gender, HSGPA, and major. These factors were analyzed for their relative impact on students’ performance graduating in statistics from the University of UAE. Findings indicated insignificant impacts of age, gender, and nationality on the bachelor’s degree’s performance.
On the other hand, HSGPA and high school major had a significant positive relationship with student’s performance in the statistics degree program. Alhajraf and Alasfour (Citation2014) in Kuwait examined 700 undergraduate students’ demographic and academic characteristics with academic performance. They included age, gender, nationality, and high school major in their study as potential academic performance determinants. Findings indicated that students’ age, gender, high school major, and HSGPA are significantly related to student academic performance. However, students’ nationality was found to have a weak impact on academic performance, as non-national students academically outperform national students. This result supports the findings of Bachan and Reilly (Citation2003) in a study that found a significant positive relationship between nationality and student performance. At the same time, Hartnett et al. (Citation2004) found that international students achieved superior performance in accounting than the resident students in Australia. In addition to examining the impact of student demographic factors on their academic performance. They attributed the difference in performances to international students’ greater motivation to succeed in their mission, overseas student networks at the university and/or other coping techniques actively adopted to improve their performance.
3. Methodology
3.1. Objectives for this study
This study investigates the impact of HSGPA, attendance in DFW (grades D, F or withdrawal from the course) courses, and socio-demographic factors on student’s academic performance in DFW courses. More specifically, the study aims to answer the following questions:
Does attendance in a DFW course determine how well a student would perform in the same course? (H01)
Does HSGPA predict how well a student would perform in a DFW course? (H02)
Do the socio-demographic factors about the students enrolled in a DFW course impact student performance in the same course? (H04)
Are there associations between the HSGPA, attendance in a DFW course, and demographic factors on this course’s performance? (H03 & H05)
3.2. Methodology and data
The data set implemented in this research was collected across four academic semesters, starting from Spring 2014 through Fall 2016 (excluding summer semesters). A simple random sample (without replacement) for student records was acquired from QU through official data acquisition from the affiliated institution of courses that meet pre-specified enrollment, DFW percentage, and attendance criteria. Therefore, the sampling frame comprises a list of courses that consist of the largest number of enrollments in which student attendance provided and exceeded an institutionally approved cutoff value of 35% that classify the students with DFW grades. The total number of the randomly chosen sample reached is 969 undergraduate students classified into first-year, sophomore, junior and senior, and enrolled in 48 majors offered by the nine colleges of QU. The classification of majors was collapsed into two sectors, namely, Humanities, Arts and Social Sciences (HASS) and Science, Technology, Engineering, and Mathematics (STEM), following the mapping of Turner and Brass (Citation2014) report. As illustrated in , HASS disciplines constitute the largest component of all undergraduate students, and this remains the same over the grades breakdown of ABC and DFW.
Table 1. Demographic characteristics of the students’ breakdown of ABC and DFW grades
In short, data collection and analysis are passed through multiple stages summarized in . The following three sections are organized as follows:
Part 1 gives a general overview of the factors examined to evaluate their relationship with the letter grades (DFW and ABC) in each of the sampled courses.
Parts 2 and 3 introduce statistical procedures to examine the associations and statistical significance between the demographic factors and college performance (i.e., letter grades in each course across the four semesters) to validate the research hypotheses.
Figure 1. Summary of data handling and analysis
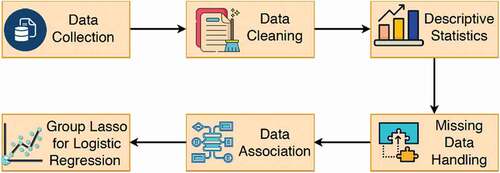
It is worth noting that this study concentrates on the effect of one variable on another to understand the pairwise correlation between the independent variables and to ensure that there is no multicollinearity within the statistical model.
3.3. Demographic characteristics and the likelihood of getting a DFW grade
Academic performance is represented by the end of semester letter-grade received in each course in the sample. Among the whole sample, the highest proportion of students in the sample got DFW grade (33.8%), followed by C (26.7%) and B (26.0%) grades. The minority of the students received an A grade (13.4%). This grade categorization is then split into two subsamples, ABC and DFW, for further analysis and examining the changes over the two subsamples. Across all students, first-year students made up half of the sample, and nationals are the majority. Seniors model the smallest number in the whole sample (1.9%) because the sample courses are general, fundamental, and build basic skills for newly admitted students. shows that student distribution based on their nationality and language of instruction (Arabic/English) is different from the ABC and DFW subsamples. According to this, the ABC group has an approximately equal number of nationals (51.6%) and non-national (48.4%) students, while the vast majority of students who are assigned under the DFW subsample are nationals (70.4%). On the other hand, the distribution of gender is identical for both ABC and DFW subsamples. On the whole, females made up the majority. Also, students in HASS majors (63.4%) are roughly twice the STEM majors’ students (36.6%). For better visualization and understanding, HSGPA and attendance were categorized into seven and six levels, respectively. Half of the students got a GPA that ranges between 85% and 95% in high-school, where 23.9% of them got 85%—90% and 26.0% got 90%—95%. Out of the 641 students with ABC grades, 27.1% attended more than 95% of the classes. However, 22.3% out of 328 DFW students attended less than 75% of the classes. Overall students, 42.2% attended more than 90% of the classes.
Findings in indicate that students who got high grades in high school and attended more classes have the least probability of getting DFW. For instance, students who receive 90% or more at high-school and attend 87% of classes have a probability of 0.2 of getting DFW. The chance of receiving a DFW is 80% for students attending less than 25% of the classes and receive a GPA of 90% or more in high-school.
Figure 2. Effect of attendance and HS-GPA on the likelihood of DFW
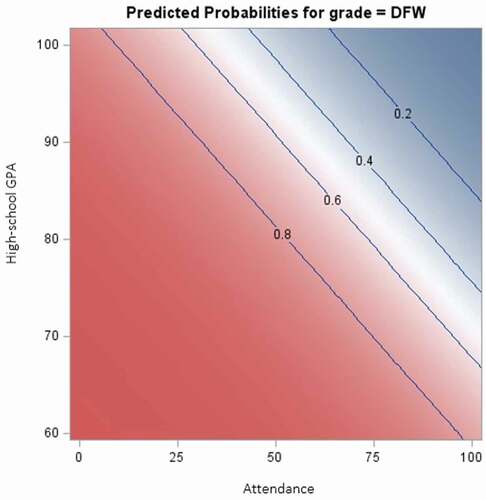
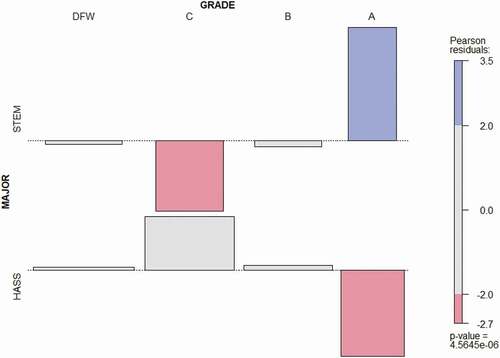
Figure 3. Association plot of major*grade
Most statistical procedures presume that all the variables are complete in the dataset; however, in social science surveys or research, datasets always encounter respondents who do not deliberately or randomly participate in specific questions.
Before deciding the appropriate technique for handling shortfalls, one must examine the data for missing values using descriptive and formal evaluations to explore any substantial patterns. It turns out that three variables have missing values as follows:
Major, missing 4 values amounting to 0.4%.
HSGPA, missing 10 values amounting to 1%.
Total enrolled terms, missing 23 values amounting to 2.4%, which sums up to 37 missing values in the whole dataset.
According to Allison (Citation2009), conventional missing data handling techniques work properly with the strongest assumption, namely, missing completely at random (MCAR), while novel techniques can handle both missing at random (MAR) and not missing at random (NMAR) mechanisms. Li (Citation2013) explains that Little’s MCAR test for multivariate quantitative data provides a Chi-square test to measure the significant difference between the means of missing data patterns. Results show that the associated Chi-square test does not provide sufficient results to reject the null hypothesis, . Therefore, the data are missing completely at random (MCAR). Li (Citation2013) states that complete-case analysis is adequate when the MCAR assumption is met. However, Allison (Citation2009) declares that complete-case analysis (i.e., listwise deletion) will sufficiently provide unbiased parameter estimates and are quite robust to violations of MCAR for independent variables in logistic regression modeling analysis. In the following two sections, missing data are handled using listwise deletion because it is an appropriate technique that holds multiple advantages over the other conventional methodologies.
3.4. Associations in multi-way tables
We address the dependency relationship between the pivotal categorical characteristics included in the dataset, namely, attendance, HSGPA, major, nationality, and letter grades, in terms of two-way and three-way contingency tables. The Chi-square test is one of the standard measures that judge whether two or more categorical variables are independent (Verma & Abdel-Salam, Citation2019). However, Pearson and Likelihood- ratio Chi-square measurements have some limitations in that:
They solely provide the degree of association between variables and are inadequate in describing the nature of the association between variables.
They ignore the ordering information of categorical variables. In other words, ordinal categorical variables are treated as nominal (Agresti, Citation2007).
Class attendance in QU is an essential element, and it ensures that the instructors track student absence and performance. The 2018–2019 QU undergraduate student catalog suggests an association between student attendance and their grade by specifying rules and limits for student absence. Accordingly, students exceeding the absence limit (25% or 10% for Medical Doctor Track) with no absence excuse will receive a failing grade (FB), regardless of their performance. From the statistical perspective, shows that students who attend 95% or more of classes tend to get higher grades, while half of the students who exceeded 25% got DFW grades.
Table 2. Attendance * grade two-way contingency table
Considering the second limitation of the Chi-square tests provided above, and because the association is measured between one and/or two ordinal characteristics, then Mantel-Haenszel statistic (Ordinal test statistic) provides greater power over Pearson or the Likelihood-ratio Chi-square tests. This type of statistic applies to the Pearson correlation and measures the degree of linear trend association among the levels of the variables (two-way cross tabulation approach) through the following test statistic.
where n represents the number of observations in the dataset (after omitting the missing values) and r stands for the Pearson correlation. Large values of contradict the null hypothesis
and a perfect association is indicated by . On the other hand, independence is distinguished when the Mantel-Haenszel statistic equals zero (Slavkovic, Citation2018).
summarizes the Mantel-Haenszel statistic and its accompanying p-value to emphasize the degree of association between each pair of characteristics. Therefore, each test statistic has p-value of less than 0.05 (significance level), which suggests statistical evidence of correlation, regardless of small absolute values of r, which is not very useful in describing such type of association.
Table 3. Measure of associations (Two-way tables)
Large Mantel-Haenszel statistics and gamma measurements indicate positive moderate to a high association between all pairs of characteristics except Major*Grade, where gamma value reflects a small negative association.
The p-value of Major*Grade association is too small to conclude that the two variables are not independent. Nevertheless, to understand more about the association between these dependent variables, an association plot that uses Pearson Residuals is utilized to provide good visualization for the deviations from independence. The major contribution to the non-significance of the null hypothesis occurs only in the tiles for A grade given STEM majors, for C grade given STEM majors, and for grade A given HASS majors because their absolute Pearson residual values are greater than 2. This explains the small value of and Gamma.
Regarding HSGPA, students who got 70% or less in high-school are more likely to get DFW in their college courses with a probability of 75%. While, among those students who received 70%-85% in high school, their likelihood of getting DFW ranges from 45% to 57.7%. Besides, more than half of the A students got 95% or more in high school. From the nationality perspective, nationals are twice as likely to get DFW grades as non-national students. Specifically, 56.8% of non-nationals obtain A and B grades in their courses.
The three-way association between the characteristics mentioned above in pairs is a cross-classification of counts and percentages of three aggregated categorical characteristics in partial tables. This can be addressed by studying the association in a multivariate analysis conditional to fixing the control variable at some level (Agresti, Citation2007). To illustrate this, the first association in studies the effect of attendance on the student grades, treating HSGPA as a control variable.
Table 4. Measure of associations (Three-way tables)
The Generalized Cochran-Mantel-Haenszel (GCMH) values from are greater than zero, and their p-values are less than the significance limit (), concluding that variables included in the four associations are dependent (i.e., rejecting the null hypothesis of conditional independence).
3.5. Group lasso for binary logistic regression
A binary logistic regression is used to fit the response variable, namely letter grade, against all the explanatory variables, namely, demographic characteristics, as in . From the pairwise correlation measured above, the plausible interactions between the demographic characteristics included in will be included in the regression model. Before running the regression analysis, a balanced format from the dataset is created where a simple random sampling is used to get an equal proportion from the two groups of the response variable. The balancing step is essential for the classification accuracy of the ABC and DFW classes. Data is then randomly split into training and validation sets containing 66.3% and 33.7% of the original balanced data, respectively. Findings indicate that 76.3% of observations are correctly classified in the training set and 75.5% in the validation set. Thus, the training dataset has slightly higher accuracy than the validation set.
Logistic regression combined with subset selection procedure will have low bias but high variance in estimating the regression coefficients, especially when the number of explanatory variables is greater than or equal to the sample size. An alternative method that improves the Logistic regression fit combined with a subset selection procedure is a shrinkage method that regularizes the coefficient estimates to give a unique solution (James et al., Citation2017). In logit regression models, when the explanatory variables are mixed between categorical and continuous, former variables should be recoded to dummy variables, which result in sparse, high-dimensional, and correlated variables. Therefore, the group-lasso penalty for model selection and the shrinkage estimation method can handle the multicollinearity problem and overcome the partial selection of dummy variables when using the lasso technique by selecting pre-assigned groups of variables. Each group consists of multiple dummy variables that represent a corresponding categorical, explanatory variable (Choi et al., Citation2012; Meier et al., Citation2008). In general, the advantages of the group-lasso penalty method over the conventional logistic regression with a subset selection technique are as follows:
Subset selection methods use a subset of the predictor variables and fit them with a regression model, but the shrinkage method (group-lasso) fits the model containing all the explanatory variables.
Shrinking the coefficient estimate to zero as in group-lasso significantly reduces the variance.
Subset selection sometimes is computationally infeasible, while group-lasso is not, because it fits a single model, which in turn performs faster.
Below are the operational steps adopted in this study, which follow the Yang and Zou (Citation2014) algorithm for fitting a logistic regression using the group-lasso approach.
The tuning parameter (λ) in group-lasso is the shrinkage amount determining which variables consideration is the best. Choosing the optimal tuning parameter is critical because as λ increases, the coefficient estimates’ bias increases, and their variance decreases. Cross-validation provides a way to select the best tuning parameter to balance the bias-variance trade-off. In the analysis, five-fold cross-validation determines the largest λ, where the error is within one standard error of the minimal cross-validation (λ = 0.0158).
After expanding the six categorical demographic characteristics (course language, gender, nationality, major, class, and academic standing) into dummy variables, nine categorical explanatory variables enter the fitted model and the standardized numerical demographics (attendance, HSGPA, and total enrolled terms). The results from the modeling analysis declare that out of 21 explanatory variables and two-way interactions between them (18 groups), the course language, academic standing, attendance, HSGPA, major, nationality, total enrolled terms, attendance*HSGPA, attendance*nationality, and HSGPA*major are statistically significant (p-value < 0.05) and are related to the response variable. Thus, we can assume that these characteristics and the significant interactions are relevant to assess whether a new sample will get ABC or DFW.
4. Summary of results and analysis
Results from the two-way contingency table, Mantel-Haenszel statistic, and group-lasso validate the significance of the first alternative hypothesis of the study, yielding a negative relationship between class attendance and the probability of getting DFW. One standardized unit increase in attendance will decrease the likelihood of getting a DFW with an odds ratio of 0.651. Also, there is a strong negative relationship, Gamma = 0.545, between high-school performance and the probability of getting a DFW. This proves the second alternative hypothesis
, where one standardized unit increase in HSGPA will decrease the probability of getting DFW with an odds ratio of 0.237. GCMH statistic and the logistic regression by group-lasso results show that the interaction between attendance and highschool performance significantly affects the lettergrade in the DFW courses (odds ratio = 1.013), supporting the third alternative hypothesis
.
There is a significant statistical relationship between course language and the likelihood of getting DFW. Students in Arabic courses are 2.847 more likely to get DFW at the end of the course than students in English-taught courses. Moreover, students on Academic Probation Dismissal (odds ratio = 31.284) and Good Standing (odds ratio = 7.663) are more likely to get DFW grades than students on the Vice-President’s List. Regarding nationality, non-nationals are less likely to get DFW with an odds ratio 0.928, in contrast to nationals. HASS students are 0.553 times less likely to get DFW in comparison to students in STEM majors. With the concern of the completed earned semesters, one standardized unit increase in the total earned semesters will increase DFW’s likelihood, with an odds ratio of 1.044. Overall, statistically, the fourth and fifth
hypotheses are failed to reject. The results found through modeling all the demographics and interactions simultaneously (group-lasso) ensure the findings of multi-way associations and conclude that the two-way interactions nationality attendance and major HSGPA are significant.
5. Discussion and future studies
Results in this study showed that the increase in attendance would decrease the likelihood of getting DFW. Academic performance is generally perceived to be a direct reflection of student attendance in college. Attendance generally enhances the learning process through direct interaction with instructors and fellow students. Those who advocate for compulsory attendance think that classroom attendance positively correlates with academic performance (Pani & Kishore, Citation2016). Rodgers (Citation2001) argued that students who have had significantly missed their classes have also been known to underperform academically. He equated this underperformance to a loss of one letter grade within students. Regardless of other variables that could primarily impact a student’s academic performance, such as a student’s capabilities and competencies, attending classes is also a contributive predictor of a student’s academic success (Dollinger et al., Citation2008). Given the above studies and the findings from the current research, it can be concluded that attendance is an important predictor of a student’s academic performance in their courses. It is worth mentioning that the relationship between the two variables is not a cause-and-effect relationship (Guleker & Keci, Citation2014; Schmulian & Coetzee, Citation2011).
Findings indicated a strong negative relationship between high-school performance and the probability of getting DFW. Studies have shown a significant association between high school achievements and university performance (Angrist et al., Citation2013; Betts & Morell, Citation1999; Cohn et al., Citation2004; Jones, Citation1987). Predictors such as GPA or a students’ standing in a class are crucial towards understanding academic performance in higher education (Singh & Maloney, Citation2019). Win and Miller (Citation2005) found that students’ high school grades affected their university performance, regardless of personal circumstances. In effect, Belfield and Crosta (Citation2012) found HSGPA to be the most key predictor of university achievement, asserting that “the relationship between HSGPA and college GPA is so powerful that it would seem more important for colleges to fully consider this measure in deciding on placement” (Belfield & Crosta, Citation2012, p. 39). Likewise, Atkinson and Geiser (Citation2009) state that, “irrespective of the quality or type of school attended, cumulative grade point average (GPA) in academic subjects in high school has proven to be the best overall predictor of student performance in college.” Snyder et al. (Citation2002) found in a study on 666 students that students’ academic performance at the end of the first year in college is related to high school academic performance. Our results support the above studies in that high school’s academic performance is a foundation for their performance in a higher educational institute.
The results of this study indicated a significant relationship between course language, academic standing, nationality, major, and total earned terms and the likelihood of getting DFW. Yousef (Citation2013) conducted a study in a private higher education institution in the GCC concluded that all of the above variables impacted the students’ academic performance. Harb and El-Shaarawi (Citation2007) also inferred that student performance was most affected by their English language competency. Singh and Maloney (Citation2019) argued that students’ academic performance in university could be predicted using HSGPA. However, they suggested that there could be some room for minor observational errors in this context. Olani (Citation2017) reported findings from Ethiopia that support the inference that students’ pre-college academic performances are strong predictors of GPA at the university level. Alghamdi and Al-Hattami (Citation2014) studied students’ HSGPA in Saudi Arabian universities and reported that “HSGPA significantly predicts students’ college performance whereas General Aptitude Test scores are not a significant predictor of college performance at the humanities colleges” (p. 1). However, regarding non-humanity colleges, admission test scores and the weighted scores used in the study were also significant predictors of students’ college success.
This study demonstrates that students who desire to succeed in their academic endeavors should attend class. Although many other factors influence academic performance, attending class is one of the easiest factors that students can control (Gump, Citation2005), and it is worth emphasizing its importance. However, it is important to emphasize and provide opportunities for students to develop the skills that can be used to maximize the benefits of attending class, such as asking questions and note-taking strategies. Also, these findings support the research that indicates that high HSGPA has predictive power for gauging first-year student undergraduate performance and insight into making accurate course placement decisions that could increase the likelihood of students succeeding in college courses.
These findings offer researchers promptings to examine dimensions of class attendance, such as the specific classroom engagement behaviors and cognitive strategies of high-performing students as predictors of academic performance. Additional research that examines specific language proficiency skills and particular academic areas such as the humanities and mathematics could be worthwhile. Finally, studies that examine students’ self-efficacy, metacognitive skills, and learning styles could be useful predictors of academic performance.
Additional information
Funding
Notes on contributors
Michael H. Romanowski
All researchers are currently teaching and researching at Qatar University, Doha, Qatar. This research study is led by Dr. Khalifa Al Hazaa, Director of Student Experience Department at Qatar University, and colleagues from the Student Affairs Office. These include Dr. Abdel-Salam G. Abdel-Salam, Associate Professor of Statistics and Head of Student Data Management; Radwa Ismail a graduate student; Dr. Chithira Johnson, Head, Student Success & Planning and Coordination; Rusol Al-Tameemi, a Graduate Assistant; and Ahmed BenSaid a Senior Student Success Specialist. Also, the team includes Professor Michael H. Romanowski from the Educational Research Center in the College of Education, Dr. Mohamed Ben Haj Rhouma and Head of the Department of Mathematics in the Foundation program at Qatar University, and Amal Elatawneh, Academic Projects Manager in the Office of Vice President for Academic Affairs. As a group, the authors have numerous publications in international journals that address educational issues in K-12 schools and higher education institutions in Qatar.
References
- Agresti, A. (2007). An introduction to categorical data analysis. John Wiley & Sons.
- Akumu, O. P. (2018). Does higher education loan amount affect students’ class attendance? Evidence from privately sponsored undergraduate students in Kenyan public universities. International Journal of Educational Research Review, 3(1), 41–19. https://doi.org/https://doi.org/10.24331/ijere.375830
- Alghamdi, A. K. H., & Al-Hattami, A. A. (2014). The accuracy of predicting university students’ academic success. Saudi Educational and Psychological Association, 9, 1–8. https://www.researchgate.net/profile/Abdulghani-Al-Hattami/publication/270647067_The_Accuracy_of_Predicting_University_Students'_Academic_Success/links/54b175040cf220c63cd052f8/The-Accuracy-of-Predicting-University-Students-Academic-Success.pdf
- Alhajraf, N. M., & Alasfour, A. M. (2014). The impact of demographic and academic characteristics on academic performance. International Business Research, 7(4), 92–100. https://doi.org/https://doi.org/10.5539/ibr.v7n4p92
- Norhidayah, A., Jusoff, K., Ali, S., Mokhtar, N., & Salamat, A. S. A. (2009). The factors influencing students’ performance at Universiti Teknologi MARA Kedah, Malaysia. Management Science and Engineering, 3(4), 81–90. https://www.researchgate.net/publication/43245445_The_Factors_Influencing_Students'_Performance_at_Universiti_Teknologi_MARA_Kedah_Malaysia
- Allensworth, E. M., & Clark, K. (2020). High School GPAs and ACT scores as predictors of college completion: Examining assumptions about consistency across high schools. Educational Researcher, 49(3), 198–211. https://doi.org/https://doi.org/10.3102/0013189X20902110
- Allison, P. D. (2009). Missing data. In R. E. Millsap & A. Maydeu-Olivares (Eds.), The SAGE handbook of quantitative methods in psychology (pp. 72–89). Sage Publications Inc.
- Al-Shammari, Z. N. (2016). Enhancing higher education student attendance through classroom management. Cogent Education, 3(1), 1–11. https://doi.org/https://doi.org/10.1080/2331186X.2016.1210488
- Al-Sheeb, B. A., Hamouda, A. M., & Abdella, G. M. (2019). Modeling of student academic achievement in engineering education using cognitive and non-cognitive factors. Journal of Applied Research in Higher Education, 11(2), 178–198. https://doi.org/https://doi.org/10.1108/JARHE-10-2017-0120
- Angrist, J. D., Pathak, P. A., & Walters, C. R. (2013). Explaining charter school effectiveness. American Economic Journal: Applied Economics, 5(4), 1–27. https://doi.org/http://dx.doi.org/10.1257/app.5.4.1
- Atkinson, R. C., & Geiser, S. (2009). Reflections on a century of college admissions tests. Educational Researcher, 38(9), 665–676. https://doi.org/https://doi.org/10.3102/0013189X09351981
- Bachan, R., & Reilly, B. (2003). A comparison of academic performance in A-level economics between two years. International Review of Economics Education, 2(1), 8–24. https://doi.org/https://doi.org/10.1016/S1477-3880(15)30154-7
- Belfield, C. R., & Crosta, P. M. (2012). Predicting success in college: The importance of placement of tests and high school transcripts. CCRC Working Paper No. 42, Teachers College, Columbia University.
- Betts, J. R., & Morell, D. (1999). The determinants of undergraduate GPA: The relative importance of family background, high school resources, and peer group effects. The Journal of Human Resources, 34(2), 268–293. https://doi.org/https://doi.org/10.2307/146346
- Choi, Y., Park, R., & Seo, M. (2012). Lasso on categorical data. 1–6. http://cs229.stanford.edu/proj2012/ChoiParkSeo-LassoInCategoricalData.pdf
- Cleary-Holdforth, J. (2007). Student non-attendance in higher education: A phenomenon of student apathy or poor pedagogy. Dublin Institute of Technology, 5(1). Article 2. doi:https://doi.org/10.21427/D71T7F
- Cohn, E., Cohn, S., Balch, D. C., & Bradley, J. (2004). Determinants of undergraduate GPAs: SAT scores, high school GPA and high school rank. Economics of Education Review, 23(6), 577–586. https://doi.org/https://doi.org/10.1016/j.econedurev.2004.01.001
- Dollinger, S. J., Matyja, A. M., & Huber, J. L. (2008). Which factors best account for academic success: Those which college students can control or those they cannot? Journal of Research in Personality, 42(4), 872–885. https://doi.org/https://doi.org/10.1016/j.jrp.2007.11.007
- Fadelelmoula, T. E. (2018). The impact of class attendance on student performance. International Research Journal of Medicine and Medical Sciences, 6(2), 47–49. https://doi.org/https://doi.org/10.30918/IRJMMS.62.18.021
- Farrington, C. A., Roderick, M., Allensworth, E., Nagaoka, J., Keyes, T. S., Johnson, D. W., & Beechum, N. O. (2012). Teaching adolescents to become learners: The role of non-cognitive factors in shaping school performance—A critical literature review. University of Chicago, Consortium on Chicago School Research. http://eric.ed.gov/?id=ED542543
- French, M. T., Homer, J. F., Popovici, I., & Robins, P. K. (2015). What you do in high school matters: High school GPA, educational attainment, and labor market earnings as a young adult. Eastern Economic Journal, 41(3), 370–386. https://doi.org/https://doi.org/10.1057/eej.2014.22
- Geiser, S., & Santelices, V. M. (2007). Validity of high school grades in predicting student success beyond the freshman year. U.C. Berkeley: Cneter for Studies in Higher Education. https://files.eric.ed.gov/fulltext/ED502858.pdf
- Geiser, S., & Studley, R. (2003). UC and the SAT: Predictive validity and differential impact of the SAT I and the SAT II at the University of California. Educational Assessment, 8(1), 1–26. https://doi.org/https://doi.org/10.1207/S15326977EA0801_01
- Gipson, J. (2016). Predicting academic success for students of color within STEM majors. Journal for Multicultural Education, 10(2), 124–134. https://doi.org/https://doi.org/10.1108/JME-12-2015-0044
- Green, L., & Celkan, G. (2011). Student demographic characteristics and how they relate to student achievement. Procedia - Social and Behavioral Sciences, 15, 341–345. https://doi.org/https://doi.org/10.1016/j.sbspro.2011.03.098
- Guleker, R., & Keci, J. (2014). The effect of attendance on academic performance. Mediterranean Journal of Social Sciences, 5(23), 961. DOI:https://doi.org/10.5901/mjss.2014.v5n23p961
- Gump, S. E. (2005). The cost of cutting class: Attendance as a predictor of success. College Teaching, 53(1), 21–26. https://doi.org/https://doi.org/10.3200/CTCH.53.1.21-26
- Harb, N., & El-Shaarawi, A. (2007). Factors affecting business students’ performance: The case of students in United Arab Emirates. Journal of Education for Business, 82(5), 282–290. https://doi.org/https://doi.org/10.3200/JOEB.82.5.282-290
- Hartnett, N., Römcke, J., & Yap, C. (2004). Student performance in tertiary-level accounting: An international student focus. Accounting and Finance, 44(2), 163–185. https://doi.org/https://doi.org/10.1111/j.1467-629X.2004.00104.x
- Hodara, M., & Lewis, K. (2017). How well does high school grade point average predict college performance by student urbanicity and timing of college entry? US Department of Education, Institute of Education Sciences, National Center for Education Evaluation and Regional Assistance, Regional Educational Laboratory Northwest. https://ies.ed.gov/ncee/edlabs/projects/project.asp?projectID=4546
- Islam, M. M., & Al-Ghassani, A. (2015). Predicting College math success: Do high school performance and gender matter? Evidence from Sultan Qaboos University in Oman. International Journal of Higher Education, 4(2), 67–80. https://doi.org/https://doi.org/10.5430/ijhe.v4n2p67
- James, G., Witten, D., Hastie, T., & Tibshirani, R. (2017). An introduction to statistical learning: With applications in R. Springer.
- Jones, L. V. (1987). The influence on mathematics test scores, by ethnicity and sex, of prior achievement and high school mathematics courses. Journal for Research in Mathematics Education, 18(3), 180–186. https://doi.org/https://doi.org/10.2307/749055
- Kassarnig, V., Bjerre-Nielsen, A., Mones, E., Lehmann, S., & Lassen, D. D. (2017). Class attendance, peer similarity, and academic performance in a large field study. PLOS ONE, 12(11), e0187078. https://doi.org/https://doi.org/10.1371/journal.pone.0187078
- Kirby, A., & McElroy, B. (2003). The effect of attendance on grade for first year economics students in University College Cork. The Economic and Social Review, 34, 311–326. http://hdl.handle.net/2262/61584
- Kottasz, R. (2005). Reasons for students’ non-attendance at lectures and tutorials: An analysis. Investigations in University Teaching and Learning, 2(2), 5–16. https://core.ac.uk/download/pdf/36771681.pdf
- Landin, M., & Pérez, J. (2014). Class attendance and academic achievement of pharmacy students in a European University. Currents in Pharmacy Teaching and Learning, 7(1), 78–83. https://doi.org/https://doi.org/10.1016/j.cptl.2014.09.013
- Li, C. (2013). Littles test of missing completely at random. The Stata Journal: Promoting Communications on Statistics and Stata, 13(4), 795–809. https://doi.org/https://doi.org/10.1177/1536867x1301300407
- Longhurst, R. J. (1999). Why aren’t they here? Student absenteeism in a further education college. Journal of Further & Higher Education, 23(1), 61–80. https://doi.org/https://doi.org/10.1080/0309877990230106
- Lukkarinen, A., Koivukangas, P., & Seppälä, T. (2016). Relationship between class attendance and student performance. Procedia - Social and Behavioral Sciences, 228, 341–347. https://doi.org/https://doi.org/10.1016/j.sbspro.2016.07.051
- Massingham, P., & Herrington, T. (2006). Does attendance matter? An examination of student attitudes, participation, performance and attendance. Journal of University Teaching and Learning Practice, 3(2), 82–103. https://ro.uow.edu.au/jutlp/vol3/iss2/3
- Meier, L., Geer, S. V., & Bühlmann, P. (2008). The group lasso for logistic regression. Journal of the Royal Statistical Society: Series B (Statistical Methodology), 70(1), 53–71. https://doi.org/https://doi.org/10.1111/j.1467-9868.2007.00627.x
- Moore, S., Armstrong, C., & Pearson, J. (2008). Lecture absenteeism among students in higher education: A valuable route to understanding student motivation. Journal of Higher Education Policy and Management, 30(1)), 15–24. https://doi.org/https://doi.org/10.1080/13600800701457848
- Mushtaq, K., Hussain, M., Afzal, M., & Gilani, S. A. (2019). Factors affecting the academic performance of undergraduate student nurses. National Journal of Health Sciences, 4(2), 71–79. https://doi.org/https://doi.org/10.21089/njhs.42.0071
- Nawa, N., Numasawa, M., Nakagawa, M., Sunaga, M., Fujiwara, T., Tanaka, Y., Kinoshita, A., & Andrew, R.,, . (2020). Associations between demographic factors and the academic trajectories of medical students in Japan. Plos One, 15(5), 1–12. https://doi.org/https://doi.org/10.1371/journal.pone.0233371.
- Olani, A. (2017). Predicting first year university students’ academic success. Electronic Journal of Research in Education Psychology, 7(19). https://doi.org/https://doi.org/10.25115/ejrep.v7i19.1351
- Oztekin, A. (2016). A hybrid data analytic approach to predict college graduation status and its determinative factors. Industrial Management & Data Systems, 116(8), 1678–1699. https://doi.org/https://doi.org/10.1108/IMDS-09-2015-0363
- Paisey, C., & Paisey, N. J. (2004). Student attendance in an accounting module – Reasons for non-attendance and the effect on academic performance at a Scottish University. Accounting Education, 13(sup1), 39–53. https://doi.org/https://doi.org/10.1080/0963928042000310788
- Pani, P. K., & Kishore, P. (2016). Absenteeism and performance in a quantitative module A quantile regression analysis. Journal of Applied Research in Higher Education, 8(3), 376–389. https://doi.org/https://doi.org/10.1108/JARHE-05-2014-0054
- Platt, L., Turocy, P., & Mc Glumphy, B. (2001). Preadmission criteria as predictors of academic success in entry-level athletic training and other allied health educational programs. Journal of Athletic Training, 36(2), 4–141. https://www.ncbi.nlm.nih.gov/pmc/articles/PMC155524
- Richardson, M., Abraham, C., & Bond, R. (2012). Psychological correlates of university students’ academic performance: A systematic review and meta-analysis. Psychological Bulletin, 138(2), 353–387. https://doi.org/https://doi.org/10.1037/a0026838
- Roberts, J. A., Olcott, A. N., McLean, N. M., Baker, G. S., & Möller, A. (2018). Demonstrating the impact of classroom transformation on the inequality in DFW rates (“D” or “F” grade or withdraw) for first-time freshmen, females, and underrepresented minorities through a decadal study of introductory geology courses. Journal of Geoscience Education, 66(4), 304–318. https://doi.org/https://doi.org/10.1080/10899995.2018.1510235
- Rochelle, C. F., & Dotterweich, D. (2007). Student success in business statistics. Journal of Economics and Finance Education, 6(1), 19–24. https://www.economics-finance.org/jefe/econ/Rochellepaper.pdf
- Rodgers, J. R. (2001). A panel-data study of the effect of student attendance on university performance. Australian Journal of Education, 45(3), 284–295. https://doi.org/https://doi.org/10.1177/000494410104500306
- Romer, D. (1993). Do students go to class? Should they? Journal of Economic Perspectives, 7(3), 167–174. https://doi.org/https://doi.org/10.1257/jep.7.3.167
- Sanchez, M., London, R., & Castrechini, S. (2015). The dynamics of chronic absence and student achievement. Education Policy Analysis Archives, 24(112), 1–31. https://doi.org/http://doi.org/10.14507/epaa.24.2741
- Sawyer, R. (2010). Usefulness of high school average transcript and ACT scores in making college admission decisions. ACT Research Report Series 2010-2012.
- Sawyer, R. (2013). Beyond correlations: Usefulness of high school GPA and test scores in making college admissions decisions. Applied Measurement in Education, 26(2), 89–112. https://doi.org/https://doi.org/10.1080/08957347.2013.765433
- Schmulian, A., & Coetzee, S. (2011). Class absenteeism: Reasons for non-attendance and the effect on academic performance. Accounting Research Journal, 24(2), 178–194. https://doi.org/https://doi.org/10.1108/10309611111163718
- Schreiber, D., Agomate, J., & Oddi, B. (2017). The impact of demographic influences on academic performance and student satisfaction with learning as related to self-esteem, selfefficacy and cultural adaptability within the context of the military. International Journal of Learning, Teaching and Educational Research, 16(4), 67–90. https://www.ijlter.org/index.php/ijlter/article/download/903/pdf
- Silvestri, L. (2003). The effect of attendance on undergraduate methods course grades. Education, 123(3), 483–486. https://link.gale.com/apps/doc/A100806937/AONE?u=anon~cec3783b&sid=googleScholar&xid=e86829f7
- Singh, K., & Maloney, T. (2019). Using validated measures of high school academic achievement to predict university success. New Zealand Economic Papers, 53(1), 89–106. https://doi.org/https://doi.org/10.1080/00779954.2017.1419502
- Slavkovic, A. (2018). Lesson 4.1.1: Measure of linear trends [Online statistical program]. Penn State University: Eberly College of Sciences. https://online.stat.psu.edu/stat504/node/91
- Snyder, V., Hackett, R. K., & Stewart, M. (2002). Predicting academic performance and retention of private university freshmen in need of development education [Paper presentation]. The Annual Meeting of the American Educational Research Association, New Orleans, April.
- Soland, J., Jensen, N., Keys, T. D., Bi, S. Z., & Wolk, E. (2019). Are test and academic disengagement related? Implications for measurement and practice. Educational Assessment, 24(2), 119–134. https://doi.org/https://doi.org/10.1080/10627197.2019.1575723
- Stanca, L. (2006). The effects of attendance on academic performance: Panel data evidence for introductory microeconomics. Journal of Economic Education, 37(3), 251–266. https://doi.org/https://doi.org/10.3200/JECE.37.3.251-266
- Sulphey, M. M., Al-Kahtani, N. S., & Syed, A. M. (2018). Relationship between admission grades and academic achievement. The International Journal of Entrepreneurship and Sustainability Issues, 5(3), 648–658. https://doi.org/https://doi.org/10.9770/jesi.2018.5.3(17)
- Teixeira, A. A. C. (2016). The impact of class absenteeism on undergraduates’ academic performance: Evidence from an elite Economics school in Portugal. Innovations in Education and Teaching International, 53(2), 230–242. https://doi.org/https://doi.org/10.1080/14703297.2014.937730
- Turner, G., & Brass, K. (2014). Mapping the humanities, arts and social sciences in Australia. Australian Academy of the Humanities, (Canberra). https://www.humanities.org.au/issue-item/mapping-humanities-arts-social-sciences-australia/
- Verma, J. P., & Abdel-Salam, A. S. G. (2019). Testing statistical assumptions in research. John Wiley & Sons.
- Win, R., & Miller, P. W. (2005). The effects of individual and school factors on university students’ academic performance. The Australian Economic Review, 38(1), 1–18. https://doi.org/https://doi.org/10.1111/j.1467-8462.2005.00349.x
- Woodfield, R., Jessop, D., & McMillan, L. (2006). Gender differences in undergraduate attendance rates. Studies in Higher Education, 31(1), 1–22. https://doi.org/https://doi.org/10.1080/03075070500340127
- Xiang, M., & Hinchliffe, S. (2019). Determinants of students’ repeating the first college-level accounting course. In S. Hinchliffe & G. C. Thomas (Eds.), Advances in accounting education: Teaching and curriculum innovations (pp. 71–88). Emerald Publishing Limited.
- Yang, Y., & Zou, H. (2014). A fast unified algorithm for solving group-lasso. Penalized learning problems. Statistics and Computing, 25(6), 1129–1141. https://doi.org/https://doi.org/10.1007/s11222-014-9498-5
- Yousef, D. A. (2013). Predicting the performance of undergraduate business students in introductory quantitative methods courses. Quality Assurance in Education, 21(4), 359–371. https://doi.org/https://doi.org/10.1108/QAE-11-2012-0043
- Yousef, D. A. (2017). Factors influencing academic performance in quantitative courses among undergraduate business students of a public higher education institution. Journal of International Education in Business, 10(1), 12–30. https://doi.org/https://doi.org/10.1108/JIEB-07-2016-0016
- Yousef, D. A. (2019). Determinants of the academic performance of undergraduate students in statistics bachelor’s degree program: A study in an Arabic setting. Quality Assurance in Education, 27(1), 13–23. https://doi.org/https://doi.org/10.1108/QAE-12-2016-0087