
 ?Mathematical formulae have been encoded as MathML and are displayed in this HTML version using MathJax in order to improve their display. Uncheck the box to turn MathJax off. This feature requires Javascript. Click on a formula to zoom.
Abstract
The Math Kangaroo is one of the biggest international mathematics competitions. In Finland, the number of participants has been around 15,000 in recent years. In this research, we considered Finnish fourth to ninth graders’ performance in the Math Kangaroo Finland 2011, 2015 and 2019. We investigated the following problems: What kind of homogeneous subgroups contestants form based on their answer choices? Can misconceptions or answering choice strategies explain answer choices that were more popular than the correct answer? The subgroups obtained by LCA were described by contestants’ general answering strategies and number of correct answers. We also looked at those wrong answer choices which were more popular than the correct one. It turned out that a strategy called estimation was a possible reason for these. Furthermore, misconceptions were more common among fourth to seventh graders’ than older students and they mostly occurred in geometry.
1. Introduction
Finland has done well in various PISA evaluations. Success in TIMSS assessment has been a lot more modest. Andrews (Citation2015) points out that the lack of success in the TIMSS assessment reveals the lack of the kind of competence that is necessary in university study of mathematical disciplines. This difference between results in TIMSS and PISA has been investigated by Andrews et al. (Citation2014), who concluded that their observations go better together with the modest TIMSS success than the much better PISA results. The students entering elementary school are heterogeneous in their mathematical skills, but these differences disappear during the first 2 years (Metsämuuronen & Tuohilampi, Citation2014). Mathematical skills of ninth graders have been declining since 2001, and the achievement level has changed from normal distribution to low, average and high performers (Metsämuuronen & Nousiainen, Citation2021).
Since PISA and TIMSS measure very different aspects of understanding mathematics, and they give quite different information about the skills of Finnish students, it seems reasonable to compare with the results in yet another widely taken exam. One option is the Math Kangaroo competition. It is the biggest international mathematics competition in the world. For example, in 2019 there were over 6 million participants from 77 countries. According to the website of International organizer and designer of the Math Kangaroo competition, Kangourou sans Frontières, the competition is “Motivated by the importance of mathematics in the modern world, their passion is to spread the joy of mathematics, support mathematical education in school and promote a positive perception of mathematics in society” (Association Kangourou sans Frontières, Citation2022a). The Math Kangaroo Finland is organized by Maunula Secondary School and Helsinki School of Mathematics and the competition has gathered about 15,000 participants (Association Kangourou sans Frontières, Citation2022b; Kangaroo Finland, Citation2021a).
The Math Kangaroo Finland is a very suitable choice to consider results in another widely taken exam for several reasons. Even though it is a mathematics competition, it gathers about 15,000 participants in Finland a year (Association Kangourou sans Frontières, Citation2022b), which means that it is not only an elite competition but taken by a wider population. In our opinion, competition problems are a very nice mix of skills required in PISA and in TIMSS: while in PISA, the emphasis is on mathematical literacy, and in TIMSS, the emphasis is on mathematical core knowledge, the problems in Math Kangaroo require both. For example, in 2019 sixth and seventh graders were asked to solve the following problem:
“Jere took selfies with his 8 cousins. Each of his cousins is in two or three of these pictures. In each picture there are exactly 5 of his cousins. How many selfies did Jere take?
A) 7 B) 6 C) 5 D) 4 E) 3” (The Kangaroo Finland, Citation2021b.)
On way to solve the problem is to note that the total number of cousins in the pictures (counting with multiplicities) is divisible by five. Then, considering the potential sums and comparing it to how many cousins must be in two and how many in three pictures, it can be deduced that the correct answer is four. Hence, the problem requires the ability to interpret a real-life problem mathematically, indeed mathematical literacy, and solver benefits from knowing divisibility. Our perception is that the Math Kangaroo exercises are essentially never in the remember class in the Bloom’s taxonomy (Anderson & Krathwohl, Citation2001; Bloom et al., Citation1956), and very rarely in the understand class. Hence, by our consideration, these problems are based on higher classes in the taxonomy.
However, as the Math Kangaroo Finland is not a mandatory exam, it is plausible to believe that a large part of participants in Math Kangaroo have teachers who are enthusiastic about mathematics, which possibly affects the outcome.
Typically, Math Kangaroo problems are neither traditional school mathematics nor rigorous competition mathematics as we can see from the example above. It is not allowed to use a calculator. There are five series in Math Kangaroo: Mini-Ecolier (2. and 3. grades), Ecolier (4. and 5. grades), Benjamin (6. and 7. grades), Cadet (8. and 9. grades) and Student (high school). Math Kangaroo competition is free and open for all schools, and it is sufficient that one teacher enrolls the school in the competition. Math Kangaroo is held annually in March–April, and it is effortless to organize the competition since multiple-choice questions are easy to check (Association Kangourou sans Frontières, Citation2022a.).
In this research, we investigate the fourth to ninth graders in the Math Kangaroo Finland in 2011, 2015 and 2019. First, we consider, what kind of homogeneous subgroups can be found based on contestants’ answer choices for the problems using a person-centered approach, the latent class analysis. Then, we consider problems for which at least two different groups answered incorrectly with at least two different ways and how misconceptions or ways to answer can describe the differences of the homogeneous groups. We call these problems wrongly answered group characterizing problems. Lastly, we investigate possible misconceptions and answering choice strategies within the answer choices that were more popular than the correct one. In particular, our aim is to understand what kind of misconceptions these students have. We consider only wrongly solved problems since the Math Kangaroo Finland consists of multiple-choice questions and, hence, it is not possible to determine what kind of strategies students have used when they have solved the problem correctly. It is worth noticing that while understanding these misconceptions does not help to arrive at the correct answer without solving the problem, understanding these may help the teacher to better tackle the common misunderstandings.
2. On person-centered approach, misconceptions and answering choice strategies
2.1. On person-centered approach
Traditional analytical and variable-centered methods, such as regression analysis and factor analysis, do not always recognize heterogeneity within individuals (Hickendorff et al., Citation2018). Linear techniques used in these methods concentrate on the relations between variables (Bergman et al., Citation2003; Collins & Lanza, Citation2010; Muthén & Muthén, Citation2000) and assume that the individual differences are homogeneous (Collins & Lanza, Citation2010). This ignores heterogeneity between learners and is thus restricted to quantitative individual differences and cannot reveal qualitative differences (Hickendorff et al., Citation2018; Lanza & Cooper, Citation2016).
Since the aim in learning research is not to describe a single learner but general patterns of learning pathways, it is important to apply methods that identify them (Hickendorff et al., Citation2018). Person-centered approaches, such as cluster analysis, finite mixture analysis and latent class analysis, are methods that take the individual heterogeneity into account and hence provide a solution to the problem. The idea is to group individuals into categories where the categories are similar and differ from other categories (Bergman & Magnusson, Citation1997; Hickendorff et al., Citation2018; Muthén & Muthén, Citation2000). Latent class analysis provides a flexible tool “to analyze both qualitative and quantitative inter- and intraindividual differences simultaneously” (Hickendorff et al., Citation2018).
Person-centered approaches are used to examine individual differences in learning of mathematics as well as other disciplines. Flunger et al. (Citation2017) investigated students’ homework behavior using a person-centered approach. Investing effort and spending a lot of time on homework were found to be associated with high motivation and high conscientiousness. Lin et al. (Citation2018) conducted a latent profile analysis inferring three homogeneous latent classes to measure math self-efficacy. Their person-centered approach showed that students’ ethnicity and implicit theories of math ability predict the class membership (mastery/moderate/unconfident). In their case study, Delderfield and McHattie (Citation2018) offered findings through an application of a person-centered approach of delivering mathematics skills development.
2.2. On misconceptions
In addition to finding possible subgroups among Finnish students in the Math Kangaroo Finland, we investigate possible misconceptions in wrong answer choices that are more popular than the correct one. This is important because if we understand how misconceptions are related to each other, then we may be able to find different factors that affect student’s mathematical development (Bransford et al., Citation2000).
The definition of a mathematics misconception may slightly vary depending on the reference: Misconceptions are described to be conceptual misunderstandings (see, e.g., Durkin & Rittle-Johnson, Citation2015; Van Dooren et al., Citation2015), but also as any ”student’s conceptions that produce a systematic pattern of errors” (Smith et al., Citation1993, page 119). In this article, a misconception means a conceptual misunderstanding.
Misconceptions have usually been studied through different topics such as algebra and geometry (see Rakes & Ronau, Citation2019). The results have shown that misconceptions in rational numbers and/or probability may predict those in algebra and geometry (see, e.g., Fuson et al., Citation2005; Lamon, Citation2007; Moss, Citation2005) and that there may not be a hierarchical relationship between misconceptions and topics (see Rakes & Ronau, Citation2019). However, Rakes and Ronau (Citation2019) tried to find factors which may produce misconceptions, but which do not depend on topics. According to their research, misconceptions behind several knowledge structures (variable, measurement, spatial reasoning, additive/multiplicative structures, absolute/relative comparison) affect misconceptions in several topics and each topic in their research contains misconceptions from several knowledge structures. It has also to be emphasized that correct answers do not necessarily mean that there is no misconception (Lobato et al., Citation2010).
2.3. On answering choice strategy and preferred answering choices
In addition to studying misconceptions in problems where students in at least two different subgroups tend to give different wrong answers or in the wrong answer choices that are more popular than the correct one, we study possible answering choice strategies and preferred answer choices among them. By an answering choice strategy, we mean a way to choose an answer for a question especially when the way leads to an incorrect answer.
Studying answer choice strategies is important since solving a mathematical problem correctly typically includes selecting and applying suitable strategies flexibly (see, e.g., Siegler & Lemaire, Citation1997; Siegler & Shipley, Citation1995). However, it should be noted that the most efficient strategy may depend also on the problem solver, not only on the problem itself (Verschaffel et al., Citation2009).
Symmetric answer choices have been seen to be preferred in mathematics questions: Reber et al. (Citation2008) found that the symmetrical statements were thought to be true more often than asymmetrical ones, even though they were true equally often.
Different answering choice strategies have also been found when it is investigated how pressure affects performance. Stress factors or negative feelings have been seen to affect performance in mathematics (Ashcraft & Kirk, Citation2001; Vukovic et al., Citation2013). However, the results have not been unambiguous (see, e.g., Ng & Lee, Citation2010; Sorvo et al., Citation2017; Vukovic et al., Citation2013). One stress factor seems to be time pressure (Hunt & Sandhu, Citation2017; Sussman & Sekuler, Citation2022). It has been seen to affect the strategy to solve mathematical problems in (Campbell & Austin, Citation2002; Caviola et al., Citation2017; Chesney et al., Citation2013; Luwel & Verschaffel, Citation2003; McNeil et al., Citation2010; Schunn et al., Citation1997). Furthermore, Beilock and DeCaro (Citation2007) studied the performance of students under high social and monetary pressure. They compared how working memory affected the solving strategies. They noticed that the higher working memory a participant had, the less likely they were to use a shortcut in a low-pressure situation, while in a high-pressure situation, they could resort to shortcuts. Using shortcuts can be useful in solving different problems, but sometimes shortcuts lead to wrong conclusions.
Several websites and documents offer guidance and “educated guessing strategies” on how to answer multiple-choice questions. One example is an article by Lindner (Citation2020) on the website of the Western Illinois University. Stough (Citation1993) has collected different techniques which are often found helpful. For example, long choices have often been seen to be the correct answer.
The following 10 strategies and signals to correctness are used to solve mathematical problems, and they can also be identified from the answers in multiple-choice tests:
Add-all (Chesney et al., Citation2013; McNeil et al., Citation2010): An equation of type is solved by computing
Add-to-Equal Signs (Chesney et al., Citation2013; McNeil et al., Citation2010): An equation of type is solved by computing
Add-two (Chesney et al., Citation2013): An equation of type is solved by summing wrong two numbers. In the example, the solution would be
or
Carry (Chesney et al., Citation2013): An equation of type is solved by taking one of those terms from the left-hand side that do not appear on the right-hand side of the equation and claiming it to be the answer. In the example, the solution would be
or
Estimation (or guessing or using heuristics) (Beilock & DeCaro, Citation2007): The student uses previous associations or heuristics, which may lead to the correct answer. For example, if one needs to decide whether is divisible by
, the student may say yes, because all the numbers are even.
Length (Stough, Citation1993): A long answer choice often signals its correctness.
Mid-range answers (Stough, Citation1993): Mid-range answers are often correct.
Repeat (Chesney et al., Citation2013): An equation of type is solved by claiming that the answer is a term on the right-hand side. In the example, the solution would be
.
Use symmetry as a hint for a correct answer (Reber et al., Citation2008): Symmetrically written statements can be seen to be correct more often than asymmetrical ones, even if they are correct equally often.
Other: Other than retrieval/remembering, counting or transformation in (Campbell & Austin, Citation2002), other than Add-all, Add-to-Equal Signs, Add-Two, Carry, Repeat or a correct answer in (Chesney et al., Citation2013).
It should be noted that the previous list does not contain strategies that cannot be recognized in multiple-choice questions. For example, the most seriously studied multiple-choice test strategy seems to be that it is beneficial to change answers (see, e.g., Merry et al., Citation2021). However, in our study, it is not possible to consider this aspect since it is not known if the final answer is the initial one or not. See (Caviola et al., Citation2017) for the review of different answering choice strategies.
While it is sometimes difficult to recognize the strategy from multiple-choice answers, it is worthwhile to notice that even if explanations were required, the strategy that is being used, is not always understandable or even makes sense (Beilock & DeCaro, Citation2007).
3. Study aim and research questions
We consider the following three research questions:
(1) Are there some kind of similar groups among the students? What kind of groups are there?
The homogeneous groups obtained to answer question (1) lead to the following question:
(2) Do misconceptions described or answering choice strategies in Sections 2.3 and 2.3 describe the differences of the found groups when we consider wrongly answered group characterizing problems?
(3) Consider misconceptions and answering choice strategies in a more general setting: Can misconceptions or answering choice strategies in Sections 2.3 and 2.3 explain answer choices that were more popular than the correct answer?
4. Theoretical framework and method
4.1. Participants
We investigated three different series: Ecolier, Benjamin and Cadet. The participants are from the fourth grade to the ninth grade in the Finnish school system. The number of participants varied from 2,923 to 3,340 in Ecolier, from 5,019 to 6,394 in Benjamin and from 5,545 to 6,167 in Cadet (Kangaroo Finland, Citation2021b).
4.2. Data
We used statistics provided by Math Kangaroo Finland website (Kangaroo Finland, Citation2021b) which contains information about the competitions from 2011 to 2021. The archive contains each contestants’ choices for each question, their scores for each problem and the final score in the competition. In this study, we limited our consideration to years 2011, 2015 and 2019 since they contained complete data and all of the contestants did the competitions in paper which allowed them to choose multiple answer choices.
4.3. Method
4.3.1. Background on latent class analysis
To answer the first and the second question, we wanted to find homogeneous subgroups of contestants. We used a statistical tool, latent class analysis (LCA) (see, e.g., Goodman, Citation1974; Lazarsfeld, Citation1950; Lazarsfeld & Henry, Citation1968), to find these subgroups. LCA has been applied in several areas of educational research, also in mathematics education (see, e.g., Fan et al., Citation2019; Hickendorff et al., Citation2009; Linzer & Lewis, Citation2011; Swanson et al., Citation2018). It has been argued to be suitable for finding subgroups in this kind of analysis with presumably qualitative differences, data sets consisting of hundreds of participants and categorical variables (Hickendorff et al., Citation2009, Citation2018). The analysis can be used to determine subgroups based on the answers of a questionnaire (Collins & Lanza, Citation2010).
In LCA, homogeneous subgroups are called classes. The classes are wanted to be homogeneous and to differ from each other as much as possible (Hickendorff et al., Citation2018; Lanza & Cooper, Citation2016; Lazarsfeld, Citation1950). In LCA, this is done with the help of the following function : Let
where is the data as a vector,
is the number of classes,
is the probability of the class,
is the number of the items in data
and
is the conditional probability that an answer choice
belongs to class
(Hickendorff et al., Citation2010). At the beginning of LCA, the class-conditional probabilities, from which the terms
can be computed, are given by a user, or randomly generated by the algorithm based on the user’s choice. This model is then estimated using the expectation-maximization algorithm (EM) (Dempster et al., Citation1977). The goal is to maximize the so-called log-likelihood function which is computed from the given probabilities. This is done iteratively by replacing the old probabilities with the new, better ones. The process is repeated until the change of the log-likelihood function is small enough or the maximum number of iterations is obtained. After this, the obtained classes form the wanted division to subgroups (Linzer & Lewis, Citation2011.).
4.3.2. The latent class analysis in our setting
In the first research question, we studied hidden homogeneous subgroups of the contestants using LCA. We wanted to find classes based on students’ categorical answer choices (empty, A, B, C, D, E, choosing more than one option) to the problems.
The vector consists of answers to the questions and
is the number of the problems. We used poLCA package (Linzer & Lewis, Citation2011, Citation2013) in R version 4.1.2 to perform the basic LCA. Default parameters for tol, na.rm, probs.start, nrep and calc.se were used, and maxiter was first set to be 1,000 and then 5,000 since a thousand iterations caused the error”MAXIMUM LIKELIHOOD WAS NOT FOUND” in Ecolier 2015. It should be noted that 99.4–100% of the contestants were classified into similar classes with both 1,000 and 5,000 iterations in those competitions where it was possible to perform 1,000 iterations. The parameter nrep was set to be 10 to avoid the problem that poLCA produces a local maximum instead of a global one (Linzer & Lewis, Citation2011) and because poLCA may produce different results in different runs due to the randomness of the algorithm (Haughton et al., Citation2009).
We tested which number of classes produced the best possible result by varying their number throughout the interval 1–20. We did not consider a higher number of classes since almost all the suggested models had less than 20 classes (see Table ). Since Bayesian information criterion (BIC) (Schwartz, Citation1978) and Akaike information criterion (AIC) (Akaike, Citation1973) usually provide suitable estimates of the model in the case of basic LCA (Forster, Citation2000; Lin & Dayton, Citation1997; Linzer & Lewis, Citation2011; Nylund-Gibson et al., Citation2007), we considered the models with the lowest BIC and AIC.
Table 1. The best possible number of classes based on AIC and BIC, their AIC and BIC values and AvePPs
However, the best possible model does not necessarily mean that the model is good (Oberski, Citation2016). To determine how well the students belonged to the class they had the highest probability to belong, we computed average posterior probabilities (AvePP) for each class. Nagin (Citation2005) suggests that AvePP is at least 0.70 for all classes and hence we compared AvePPs to this value.
After finding the LCA classes, we considered wrongly answered group characterizing problems by first finding them and then considering different ways to get these wrong answer choices. This was our method to investigate the second research question.
4.3.3. Misconceptions and answering choice strategies
We classified various answers students gave in the competitions by trying to analyze which of the possible strategies could have led to the answer. We first went through the problems and tried to solve problems wrongly to obtain common wrong answers. In some cases, it was impossible to think how one might even arrive to some answer choices. After this, we classified these problems under different solution strategies based on what kind of strategies could be used in the solutions. All three authors did this classification, and then we accepted the strategy as a possible one only if at least two of us agreed that it was a likely strategy to arrive to a certain answer.
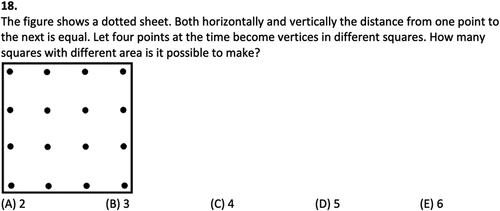
For example, in the following question (see Figure ), the correct answer was D with 10% of the participants choosing it. Every other choice was more popular. The most popular one was B with 31% of the participants choosing it. Choice B was classified as misconception and estimation, because it could be reached by simplifying the problem to a perhaps more familiar one of only counting squares of different sizes with sides parallel to the sides of the large square, hence estimation. On the other hand, a similar explanation also works for misconception, so that was the other classification.
Figure 1. Ecolier 2015, question 18.
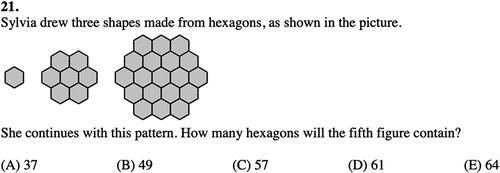
As another example, in the following question (see Figure ), the answer d was correct, and it was chosen by 19% of the participants. Answer A was more popular with 33% of the participants. Answer A is reached if one computes the fourth figure, instead of the fifth one. This mistake was classified as “other”, as it was not a consequence of any strategy.
Figure 2. Ecolier 2015, question 21.
5. Results
5.1. LCA: classes
Using LCA, we divided participants of each competition into different classes. The best possible number of classes varied from 9 to 14 using AIC and from 4 to 7 using BIC (see Table ). The best possible number of classes for Ecolier tended to be lower than for Benjamin and Cadet by both AIC and BIC. Further, based on BIC, each series had exactly 1 year in which the suggested number of classes is lower than in the other 2 years. Only in the case of Ecolier, the year giving the lowest number of classes by AIC coincided with the year giving the lowest number of classes by BIC.
All the AvePPs were at least 0.70 which is the boundary value suggested by Nagin (Citation2005). Since AvePPs were in general higher for classes with the lowest BIC than with the lowest AIC and the classes by BIC were clearer to interpret, these classes were looked at closely.
The classes obtained by BIC are described based on means, standard deviations and medians, obtained minimum and maximum numbers of the correct answers compared to the whole series, percentages of contestants answering correctly to some problems, leaving some of them empty and answering incorrectly to some, the most common answers for the problems (see Appendix A, Tables ) and proportions of each answer choice in the class (see Appendix A, Tables ). According to this analysis, the contestants belonged to different classes based on their number of correct answers and their answering strategy. Here answering strategy means how the contestants belonging to the class answered the questions in general, for example, did they tend to answer all the questions. Types of different classes are given in Table and used abbreviations are described below. The first part of the abbreviations corresponds to the answering strategy and the second part to the number of correct answers.
Table 2. Classes and obtained from LCA and their proportions. Please note that the percentages are rounded and hence the proportions of the classes do not always add up to 100%. The largest class in each competition is given in italic
It should be noted that the differences of the classes in the same competition can be described only by properties described in Table , there is no need to describe them by misconceptions or answering choice strategies described in Sections 2.3 and 2.3. The wrongly answered group characterizing problems do not generally divide classes that are otherwise similar. The only possible exception is Benjamin 2011 with classes JBs and NBs. In this case, both classes seem to have a misconception on how the number zero in the middle of an integer affects the product of two integers (see problem 11) but the misconception is different: adding at the end of the number (JBs, 11d) or in the middle (NBs, 11c). Further, they also use the estimation strategy in different ways in problem 12 but this is not an important qualitative difference.
“Paul wanted to multiply an integer by 301, but he forgot the zero and multiplied by 31 instead. The result he got was 372. (He did manage to multiply by 31 correctly!) What result was he supposed to get?
A) 3010 B) 3612 C) 3702 D) 3720 E) 30720”
(Benjamin 2011, problem 11, see The Kangaroo Finland, Citation2021b.)
Answering strategy N was the most common strategy except for Benjamin 2011 and Cadet 2011. Further, there was always a class NAc or NAs and a class NBs or NBc. The contestants in Ecolier belonged more often to classes applying answering strategy N (58–75% of participants) than in Benjamin (37–55%) and Cadet (29–54%).
In each competition, strategy J was applied in at least one class. In Cadet, the students in none of these classes performed above average, whereas in Benjamin 2011 and 2015 and Ecolier 2019, this kind of class exists.
Furthermore, older contestants were more likely to belong to the classes applying strategies F or Mi than younger ones. In classes applying strategy Mi, the number of correct answers was in general at least on the average level. As we can see also in Table , average-level classes are more common in Ecolier (21–54%) than in Benjamin (0–26%) and in Cadet (0–24%).
With the exception of year 2019, each competition had a class in which contestants chose more than one answer even though this led to a point deduction. These classes consisted of 4–6% of the contestants. In these classes, the diversity of the number of correct answers was often similar to the whole group.
5.2. On answer choices that were more common than the correct one
We found 17 answer choices that were more popular than the correct one in Ecolier, 16 in Benjamin and 25 in Cadet (see Table ).
Table 3. Answer choices that were more popular than the correct answer
Out of misconceptions and strategies described in Section 4.1 we identified the following four among wrong answer choices that were more common than the correct one: misconceptions, estimation, use symmetry as a hint of correct answer and choose a mid-range answer. In addition, we also identified that some errors were caused by miscalculations and some in category other (mistakes, guessing, not understanding the problem correctly or answer is taken from a picture which is not in scale). (See Figure .) Except for Cadet 2019 21E, all answer choices belonged to at least one category and some of them in more than one category.
Figure 3. Proportions of different categories of wrong answer choices that were more common than the correct one (number of answer choices/all answer choices that were more common than the correct one). One answer choice can belong to more than one category.
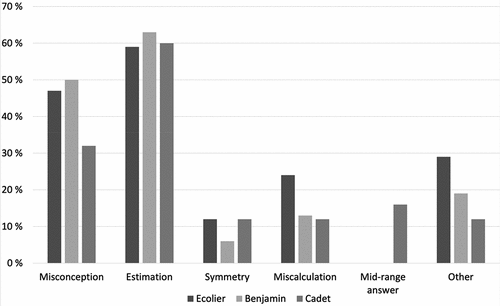
As can be seen in Figure , estimation was the most common wrong strategy and misconceptions and category other occurred more often in younger age groups than in eighth and ninth graders’ group. The misconceptions were mostly related to geometry, such as figuring 2D or 3D objects (see Table ). Except for one geometry misconception (area and perimeter), these misconceptions seem to be based on not figuring geometric objects correctly. However, it should be noted that the same answer choice may be classified into several categories. Miscalculations were more often behind a popular wrong answer choice among fourth and fifth graders than older students.
Table 4. Possible misconceptions in answer choices that were more popular than the correct answer. The problem and choise in question are indicated in brackets by year.ProblemCHOICE, so for example, 15.14C means year 2015, problem 14, choice C
6. Discussion
First, we divided contestants into different classes to investigate general learning patterns and to reveal personal differences (see Hickendorff et al., Citation2018; Lanza & Cooper, Citation2016). According to LCA and BIC, the contestants were divided to 4–7 classes based on their answering strategies and the number of correct answers (see Table ). The classes can be described by the general answering strategy and performance level of the students, especially not by the misconceptions or answering choice strategies described in Sections 2.3 and 2.3. One reason may be that estimation was found to be the used answering choice strategy in more than half of the choices that were more common than the correct one (see Figure ). Hence, different answer choice strategies may not make enough difference between students. However, it should be noted that it may be possible that there are several different ways to divide contestants meaningfully into different classes and these classifications may depend on the selected method.
The existence of classes NBs and NBc may be explained by the results that unskilled students are often, but not always, not aware of their lack of skills or lack of knowledge to estimate their performance (see Händel & Dresel, Citation2018; Kim et al., Citation2015; Kruger & Dunning, Citation1999; Urban & Urban, Citation2021). Hence, they may unwisely answer questions that they are unable to solve.
Further, older students were less likely to belong to a class applying strategy N than the younger ones. In Cadet, the contestants more likely belonged to a class applying strategy F or Mi than in Ecolier or Benjamin, and in most of these classes, the students in general had a higher number of correct answers than the rest of the population. Students’ awareness of their own skills may improve when they become older (see Urban & Urban, Citation2021); thus, students may be more capable of determining whether they are able to solve a problem correctly and hence skip some of the questions. On the other hand, in Cadet there was no class in which the students performed above average and applied strategy J, whereas in Ecolier and Benjamin, this kind of class exists. If the awareness of own skills raises, it should probably mean that especially the strongest contestants do not follow the question order when they answer the questions. Hence, they should apply strategy J which is advised to be a time wise strategy (see Scruggs & Mastropieri, Citation1986). One explanation could be that the contestants in Ecolier and Benjamin competitions were faster to solve the problems than in Cadet and hence there were more classes applying strategy F in Cadet. On the other hand, the average numbers and medians of correct answers were quite similar and at most 12 in each series (see Appendix A, Tables ) which does not support the idea that Cadet competition problems were more difficult.
Older contestants, indeed, those in Benjamin and Cadet, do not seem to form average-level classes as often as the youngest ones. This might mean that the difference between different ability levels rises during school years, which is supported by the result of Metsämuuronen and Nousiainen (Citation2021) showing that the Finnish ninth graders’ achievement level in mathematics is not distributed normally, but it is composed of three populations: low, average and high performers. However, our finding is not supported by the study of Metsämuuronen and Tuohilampi (Citation2014) according to which Finnish students’ abilities to solve mathematics problems differ a lot when they begin school, but these differences disappear during the first years. It might be that the average students do not tend to answer as similarly in Benjamin and in Cadet as they did in Ecolier and hence do not end up in the same classes. Also, the participation populations may be different, and hence the average classes are not that common in Benjamin and Cadet.
Since the AvePPS obtained by AIC were higher than the suggested value (see Nagin, Citation2005), it may be interesting to analyse what kind of classes those are.
Among answer choices that were more common than the correct one, estimation was most commonly identified to be behind the error (see Figure ). The phenomenon, that estimation is commonly behind erros, is in line with the research that intuitive approaches are used before more deliberate approaches especially in timed tests (see, e.g., De Neys, Citation2006) since estimation does not require thinking problem accurately. No answering choice strategies related to equations (add-all, add-to-equal signs, add two, carry, repeat) were found. The problems requiring equation solving often required interpretation of the problem, and the possible answer choices lead us to think that the errors occurred most often in this part of the problem solving, not in solving the actual equation.
Possible misconceptions were found in more answer choices that were more common than the correct one among younger students than older ones (see Figure ). Since out of eight different misconceptions, three (right-angled triangle, negative numbers, combinations) are related to topics that are studied in a more detailed way later in school (see Opetushallitus, Citation2004, Citation2014), this partly explains the high number of misconceptions in Ecolier.
Out of misconceptions,
of them were related to geometry (see Table ). However, according to Rakes and Ronau (Citation2019) misconceptions are generally caused by a misconception of underlining structure, not the topic itself. In this research, the possible underlining structure among most of the geometry misconceptionscan be not figuring the shapes and objects correctly. Similar misconceptions were also found by Özerem (Citation2012) and the suggestion was to use more visual objects and to emphasize more the similarities and differences of the objects.
Contrary to the previous research (see, e.g., Fuson et al., Citation2005; Lamon, Citation2007; Moss, Citation2005), we did not find any connection that misconception in rational numbers or probability causes misconceptions in geometry—neither in LCA analysis or in found misconceptions. This may not mean that this connection does not exist but tells of the lack of probability and rational number problems in the Math Kangaroo Finland competition. More precisely, there were only four problems including rational numbers (Ecolier 2011 problem 13, Benjamin 2015 problem 4 and Cadet 2011 problems 9 and 19) and one probability problem (Benjamin 2015 problem 11). Hence, it would be important to study more Finnish fourth to ninth graders’ misconceptions and their connections in rational numbers, probability and geometry.
It should also be noted that since misconceptions are often over- or under-generalizations (see Kalchman & Koedinger, Citation2005; Van Dooren et al., Citation2003), it may be possible that some misconceptions were put under category estimation. Multiple-choice questions possibly also hide some misconceptions. Further, we only studied possible misconceptions in wrong answer choices so that those occur in correct ones were not seen (see Lobato et al., Citation2010).
7. Conclusion
In this paper, we considered homogeneous subgroups of the contestants based on their answer choices in the Math Kangaroo Finland. The grades under the consideration were 4–9.
The homogeneous subgroups formed by using LCA can be described using only contestants’ general performance level and their answering strategies. All these subgroups, called classes, satisfied the boundary value for a reasonable classification given by Nagin (Citation2005).
We also considered possible misconceptions and answering choice strategies in answer choices that were more common than the correct one. The importance of studying them comes from the idea that understanding how misconceptions are related to each other, and then we may be able to find different factors that affect student’s mathematical development (Bransford et al., Citation2000). Since solving a mathematical problem correctly, typically includes selecting and applying suitable strategies flexibly (see, e.g., Siegler & Lemaire, Citation1997; Siegler & Shipley, Citation1995), studying answering choice strategies reveals information of an important aspect in mathematical problem solving, too.
The most common answer choice strategy was estimation. Misconceptions occurred more often in fourth to seventh graders’ age group than in the oldest group. Half of the misconceptions were related to geometry and those mainly figuring geometric objects. According to Özerem (Citation2012) using more visual objects and emphasizing more the similarities and differences of the objects may help with these. However, it may be possible that there are misconceptions behind correct answers and hence all misconceptions may not have been found (see Lobato et al., Citation2010).
The study starts the research of the Math Kangaroo Finland and provides information about contestants' answering strategies. It should be noted that participants may not represent the whole fourth to ninth graders’ population equally. More research would be needed especially considering other possible ways to divide contestants into homogeneous subgroups and possible reasons for misconceptions.
Acknowledgments
We would like to thank Professor Ismo Koponen for enlightening discussions and MSc Ville Tilvis for answering our questions related to Math Kangaroo Finland.
Disclosure statement
No potential conflict of interest was reported by the authors.
Additional information
Funding
References
- Akaike, H. (1973). Information theory and an extension of the maximum likelihood principle. In B. N. Petrov & F. Csaki (Eds.), Second international symposium on information theory. Budapest, Hungary (pp. 267–22). Akademiai Kiado.
- Anderson, L. W., & Krathwohl, D. R. (Eds.). (2001). A taxonomy for learning, teaching, and assessing: A revision of Bloom’s taxonomy of educational objectives. Longman.
- Andrews, P. (2015). Mathematics, PISA, and culture: An unpredictable relationship. Journal of Educational Change, 16(3), 251–280. https://doi.org/10.1007/s10833-015-9248-2
- Andrews, P., Ryve, A., Hemmi, K., & Sayers, J. (2014). PISA, TIMSS and Finnish mathematics teaching: An enigma in search of an explanation. Educational Studies in Mathematics, 87(1), 7–26. https://doi.org/10.1007/s10649-014-9545-3
- Ashcraft, M. H., & Kirk, E. P. (2001). The relationships among working memory, math anxiety, and performance. Journal of Experimental Psychology: General, 130(2), 224–237. https://doi.org/10.1037/0096-3445.130.2.224
- Association Kangourou sans Frontières. (2022a). Association website. Retrieved April 5, 2023, from http://www.aksf.org
- Association Kangourou sans Frontières. (2022b). Statistics: Finland. Retrieved April 5, 2023, from http://www.aksf.org/statistics.xhtml#FI
- Beilock, S. L., & DeCaro, M. S. (2007). From poor performance to success under stress: Working memory, strategy selection, and mathematical problem solving under pressure. Journal of Experimental Psychology: Learning, Memory & Cognition, 33(6), 983–998. https://doi.org/10.1037/0278-7393.33.6.983
- Bergman, L. R., & Magnusson, L. R. (1997). A person-oriented approach in research on developmental psychopathology. Development & Psychopathology, 9(2), 291–319. https://doi.org/10.1017/S095457949700206X
- Bergman, L. R., Magnusson, L. R., & El Khouri, B. M. (2003). Studying individual development in an interindividual context: A person-oriented approach. Lawrence Erlbaum Associates Publishers. https://doi.org/10.4324/9781410606822
- Bloom, B. S., Engelhart, M. D., Furst, E. J., Hill, W. H., & Krathwohl, D. R. (1956). Taxonomy of educational objectives: The classification of educational goals, Handbook I: Cognitive domain. David McKay Company.
- Bransford, J. D., Brown, A. L., & Cocking, R. R. (2000). How people learn: Brain, mind, experience, and school. National Academy Press.
- Campbell, J. I. D., & Austin, S. (2002). Effects of response time deadlines on adults’ strategy choices for simple addition. Memory & Cognition, 30(6), 988–994. https://doi.org/10.3758/BF03195782
- Caviola, S., Carey, E., Mammarella, I. C., & Szucs, D. (2017). Stress, time pressure, strategy selection and math anxiety in mathematics: A review of the literature. Frontiers in Psychology, 8, 1488. https://doi.org/10.3389/fpsyg.2017.01488
- Chesney, D. L., McNeil, N. M., Brockmole, J. R., & Kelley, K. (2013). An eye for relations: Eye-tracking indicates long-term negative effects of operational thinking on understanding of math equivalence. Memory & Cognition, 41(7), 1079–1095. https://doi.org/10.3758/s13421-013-0315-8
- Collins, L. M., & Lanza, S. T. (2010). Latent class and latent transition analysis: With applications in the social, behavioural, and health sciences. John Wiley. https://doi.org/10.1002/9780470567333
- Delderfield, R., & McHattie, H. (2018). The person-centred approach in maths skills development: Examining a case of good practice. Journal of Learning Development in Higher Education, 13(13). https://doi.org/10.47408/jldhe.v0i13.447
- Dempster, A. P., Laird, N. M., & Rubin, D. B. (1977). Maximum likelihood from Incomplete data via the EM algorithm. Journal of the Royal Statistical Society: Series B (Methodological), 39(1), 1–22. https://doi.org/10.1111/j.2517-6161.1977.tb01600.x
- De Neys, W. (2006). Automatic–heuristic and Executive–analytic processing during reasoning: Chronometric and Dual-Task Considerations. The Quarterly Journal of Experimental Psychology, 59(6), 1070–1100. https://doi.org/10.1080/02724980543000123
- Durkin, K., & Rittle-Johnson, B. (2015). Diagnosing misconceptions: Revealing changing decimal fraction knowledge. Learning & Instruction, 37, 21–29. https://doi.org/10.1016/j.learninstruc.2014.08.003
- Fan, X., Hambleton, R. K., & Zhang, M. (2019). Profiles of mathematics anxiety among 15-year-old students: A cross-cultural study using multi-group latent profile analysis. Frontiers in Psychology 10, 1–9. article 1217. https://doi.org/10.3389/fpsyg.2019.01217
- Flunger, B., Trautwein, U., Nagengast, B., Lüdtke, O., Niggli, A., & Schnyder, I. (2017). A person-centered approach to homework behavior: Students’ characteristics predict their homework learning type. Contemporary Educational Psychology, 48, 1–15. https://doi.org/10.1016/j.cedpsych.2016.07.002
- Forster, M. R. (2000). Key concepts in model selection: Performance and generalizability. Journal of Mathematical Psychology, 44(1), 205–231. https://doi.org/10.1006/jmps.1999.1284
- Fuson, K. C., Kalchman, M. C., & Bransford, J. D. (2005). Mathematical understanding: An introduction. In M. S. Donovan & J. D. Bransford (Eds.), How students learn: History, mathematics, and science in the classroom (pp. 217–256). National Academics Press.
- Goodman, L. A. (1974). Exploratory latent structure analysis using both identifiable and unidentifiable models. Biometrika, 61(2), 215–231. https://doi.org/10.1093/biomet/61.2.215
- Händel, M., & Dresel, M. (2018). Confidence in performance judgement accuracy: The unskilled and unaware effect revised. Metacognition and Learning, 13(3), 265–285. https://doi.org/10.1007/s11409-018-9185-6
- Haughton, D., Legrand, P., & Woolford, S. (2009). Review of three latent class cluster analysis packages: Latent gold, poLCA, and MCLUST. American Statistician, 63(1), 81–91. https://doi.org/10.1198/tast.2009.0016
- Hickendorff, M., Edelsbrunner, P. A., McMullen, J., Schneider, M., & Trezise, K. (2018). Informative tools for characterizing individual differences in learning: Latent class, latent profile, and latent transition analysis. Learning & Individual Differences, 66, 4–15. https://doi.org/10.1016/j.lindif.2017.11.001
- Hickendorff, M., Heiser, W. J., van Putten, C. M., & Verhelst, N. D. (2009). Solution strategies and achievement in Dutch complex arithmetic: Latent variable modeling of change. Psychometrika, 74(2), 331–350. https://doi.org/10.1007/s11336-008-9074-z
- Hickendorff, M., van Putten, C. M., Verhelst, N. D., & Heiser, W. J. (2010). Individual differences in strategy use on division problems: Mental versus written computation. Journal of Educational Psychology, 102(2), 438–452. https://doi.org/10.1037/a0018177
- Hunt, T. E., & Sandhu, K. K. (2017). Endogenous and exagenous time pressure: Interactions with mathematics anxiety in explaining arithmetic performance. International Journal of Educational Research, 82, 91–98. https://doi.org/10.1016/j.ijer.2017.01.005
- Kalchman, M. S., & Koedinger, K. R. (2005). Teaching and learning functions. In M. S. Donovan & J. D. Bransford (Eds.), How students learn: History, mathematics, and science in the classroom (pp. 351–396). National Academies Press.
- Kangaroo Finland, M. (2021a). International Maths Contest Kangaroo. Retrieved March 25, 2022, from https://kengurukilpailu.fi
- Kangaroo Finland, M. (2021b). Archive. Retrieved March 25, 2022, from https://kengurukilpailu.fi/home/archive/
- Kim, Y.-H., Chiu, C.-Y., & Bregant, J. (2015). Unskilled and Don’t want to be aware of it: The effect of self-relevance on the Unskilled and unaware phenomenon. PLoS ONE, 10(6), e0130309. https://doi.org/10.1371/journal.pone.0130309
- Kruger, J., & Dunning, D. (1999). Unskilled and unaware of it: How difficulties in recognizing one’s own incompetence lead to inflated self-assessments. Journal of Personality & Social Psychology, 77, 1121–1134. https://doi.org/10.1037/0022-3514.77.6.1121
- Lamon, S. J. (2007). Rational numbers and propotional reasoning. In F. K. Lester (Ed.), Second handbook of research on mathematics teaching and learning (pp. 629–667). National Council of Teachers of Mathematics.
- Lanza, S. T., & Cooper, B. R. (2016). Latent class analysis for developmental research. Child Development Perspectives, 10(1), 59–64. https://doi.org/10.1111/cdep.12163
- Lazarsfeld, P. F. (1950). The logical and mathematical foundation of latent structure analysis. In S. A. Stouffer, L. Guttman, E. A. Suchman, P. F. Lazarsfeld, S. A. Star, & J. A. Clausen (Eds.), Measurement and prediction (pp. 361–412). Princeton University Press.
- Lazarsfeld, P. F., & Henry, N. W. (1968). Latent structure analysis. Houghton-Mifflin.
- Lin, T. H., & Dayton, C. M. (1997). Model selection information criteria for non-nested latent class models. Journal of Educational and Behavioral Statistics, 22(3), 249–264. https://doi.org/10.3102/10769986022003249
- Lindner, R. W. (2020). Preparing for, and taking, a multiple choice exam: Some basic tips, tactics, and strategies, Western Illinois University. Retrieved February 16, 2023, from http://www.wiu.edu/coehs/teacher/advising/documents/ICTS_Preparing_for_mc_exam.pdf
- Lin, L., Lee, T., & Snyder, L. A. (2018). Math self-efficacy and STEM intentions: A person-centered approach. Frontiers in Psychology, 9. https://doi.org/10.3389/fpsyg.2018.02033
- Linzer, D. A., & Lewis, J. (2011). poLCA: An R package for polytomous variable latent class analysis. Journal of Statistical Software, 42(10), 1–29. https://doi.org/10.18637/jss.v042.i10
- Linzer, D. A., & Lewis, J. (2013). poLCA: Polytomous variable latent class analysis. R package version 1.4. Retrieved March 25, 2022, from http://dlinzer.github.com/poLCA
- Lobato, J., Ellis, A. B., Charles, R. I., & Zbiek, R. (2010). Developing essential understanding of ratios, proportions, and proportional reasoning for teaching mathematics: Grades 6–8. National Council of Teachers of Mathematics.
- Luwel, K., & Verschaffel, L. (2003). Adapting strategy choices to situational factors: The effect of time pressure on children’s numerosity judgement strategies. Psychologica Belgica, 43(4), 269–295. https://doi.org/10.5334/pb.1013
- McNeil, N. M., Rittle-Johnson, B., Hattikudur, S., & Petersen, L. A. (2010). Continuity in representation between children and adults: Arithmetic knowledge hinders undergraduates’ algebraic problem solving. Journal of Cognition and Development, 11, 437–457. https://doi.org/10.1080/15248372.2010.516421
- Merry, J. W., Elenchin, M. K., & Surma, R. N. (2021). Should students change their answers on multiple choice questions? Advances in Physiology Education, 45(1), 182–190. https://doi.org/10.1152/advan.00090.2020
- Metsämuuronen, J., & Nousiainen, S. (2021). Mathematics in the shadow of COVID-19 pandemic – achievement in mathematics at the end of 9th grade in spring 2021 (Tech. Rep.). PunaMusta Oy: Finnish Education Evaluation Centre (FINEEC). Publications 27:2021.
- Metsämuuronen, J., & Tuohilampi, L. (2014). Changes in achievement and in attitude toward mathematics of the Finnish children from grade 0 to 9 – a longitudinal study. Journal of Educational and Developmental Psychology, 4(2), 145–169. https://doi.org/10.5539/jedp.v4n2p145
- Moss, J. (2005). Pipes, tubes, and beakers: New approaches to teaching the rational-number system. In M. S. Donovan & J. D. Bransford (Eds.), How students learn: History, mathematics, and science in the classroom (pp. 309–350). National Academics Press.
- Muthén, B., & Muthén, L. K. (2000). Integrating person-centered and variable-centered analyses: Growth mixture modeling with latent trajectory classes. Alcoholism, Clinical and Experimental Research, 24(6), 882–891. https://doi.org/10.1111/j.1530-0277.2000.tb02070.x
- Nagin, D. S. (2005). Group-based modeling of development. Harvard University Press.
- Ng, E., & Lee, K. (2010). Children’s task performance under stress and non-stress conditions: A test of the processing efficiency theory. Cognition & Emotion, 24(7), 1229–1238. https://doi.org/10.1080/02699930903172328
- Nylund-Gibson, K. L., Asparouhov, T., & Muthén, B. (2007). Deciding on the number of classes in latent class analysis and growth mixture modeling. A monte carlo simulation study. Structural Equation Modeling, 14(4), 535–569. https://doi.org/10.1080/10705510701575396
- Oberski, D. (2016). Mixture models: Latent profile and latent class analysis. In J. Robertson & M. Kaptein (Eds.), Modern statistical methods for HCI. Human–computer interaction series (pp. 275–287). Springer International Publishing. https://doi.org/10.1007/978-3-319-26633-6_12
- Opetushallitus. (2004). Perusopetuksen opetussuunnitelman perusteet 2004. Retrieved June 1, 2023, from https://www.oph.fi/fi/
- Opetushallitus. (2014). Perusopetuksen opetussuunnitelman perusteet 2014. Retrieved June 1, 2023, from https://www.oph.fi/fi
- Özerem, A. (2012). Misconceptions in geometry and suggested solutions for seventh grade students. Procedia - Social & Behavioral Sciences, 55(5), 720–729. https://doi.org/10.1016/j.sbspro.2012.09.557
- Rakes, C. R., & Ronau, R. N. (2019). Rethinking mathematics misconceptions: Using knowledge structures to explain systematic errors within and across content domains. International Journal of Education in Mathematics, Science and Technology (IJEMST), 5(1), 1–21. https://doi.org/10.13016/M2NB41-XJTL
- Reber, R., Brun, M., & Mitterndorfer, K. (2008). The use of heuristics in intuitive mathematical judgement. Psychonomic Bulletin & Review, 15(6), 1174–1178. https://doi.org/10.3758/PBR.15.6.1174
- Schunn, C. D., Reder, L. M., Nhouyvanisvong, A., Richards, D. R., & Stroffolino, P. J. (1997). To calculate or not to calculate: A source activation confusion model of problem familiarity’s role in strategy selection. Journal of Experimental Psychology: Learning, Memory & Cognition, 23(1), 3–29. https://doi.org/10.1037/0278-7393.23.1.3
- Schwartz, G. (1978). Estimating the dimension of a model. Annals of Statistics, 6(2), 461–464. https://doi.org/10.1214/aos/1176344136
- Scruggs, T. E., & Mastropieri, M. A. (1986). Improving the test-taking skills of behaviorally disordered and learning disabled students. Exceptional Children, 53(1), 63–68. https://doi.org/10.1177/001440298605300107
- Siegler, R. S., & Lemaire, P. (1997). Older and younger adults’ strategy choices in multiplication: Testing predictions of ASCM using the choice/no-choice method. Journal of Experimental Psychology: General, 126(1), 71–92. https://doi.org/10.1037/0096-3445.126.1.71
- Siegler, R. S., & Shipley, C. (1995). Variation, selection, and cognitive change. In T. Simmon & G. Haldord (Eds.), Developing cognitive competence: New approaches to process modeling (pp. 31–76). Lawrence Erlbaum Associates.
- Smith, J. P., diSessa, A. A., & Roschelle, J. (1993). Misconceptions reconceived: A constructivist analysis of knowledge in transition. Learning of the Learning Sciences, 3(2), 115–163. https://doi.org/10.1207/s15327809jls0302_1
- Sorvo, R., Koponen, T., Viholainen, H., Aro, T., Räikkönen, E., Peura, P., Dowker, A., & Aro, M. (2017). Math anxiety and its relationship with basic arithmetic skills among primary school children. The British Journal of Educational Psychology, 87(3), 309–327. https://doi.org/10.1111/bjep.12151
- Stough, L. M. (1993). Research on multiple-choice questions: Implications for strategy instruction. Paper presented at the Annual Convention of the Council for Exceptional Children (71st, April 5-9, 1993).
- Sussman, R. F., & Sekuler, R. (2022). Feeling rushed? Perceived time pressure impacts executive function and stress. Acta Psychologica, 229, 103702. https://doi.org/10.1016/j.actpsy.2022.103702
- Swanson, H. L., Olide, A. F., & Kong, J. E. (2018). Latent class analysis of children with math difficulties and/or math learning disabilities: Are there cognitive differences? Journal of Educational Psychology, 110(7), 931–951. https://doi.org/10.1037/edu0000252
- Urban, M., & Urban, K. (2021). Unskilled but aware of it? Cluster analysis of creative metacognition from preschool age to early adulthood. The Journal of Creative Behavior, 55(4), 937–945. https://doi.org/10.1002/jocb.499
- Van Dooren, W., De Bock, D., Depaepe, F., Janssens, D., & Verschaffel, L. (2003). The illusion of linearity: Expanding the evidence towards probabilistic reasoning. Educational Studies in Mathematics, 53(2), 113–138. https://doi.org/10.1023/A:1025516816886
- Van Dooren, W., Lehtinen, E., & Verschaffel, L. (2015). Unraveling the gap between natural and rational numbers. Learning & Instruction, 37, 1–4. https://doi.org/10.1016/j.learninstruc.2015.01.001
- Verschaffel, L., Luwel, K., Torbeyns, J., & Van Dooren, W. (2009). Conceptualizing, investigating, and enhancing adaptive expertise in elementary mathematics education. European Journal of Psychology of Education, 24(3), 335–359. https://doi.org/10.1007/BF03174765
- Vukovic, R. K., Kieffer, M. J., Bailey, S. P., & Harari, R. R. (2013). Mathematics anxiety in young children: Concurrent and longitudinal associations with mathematical performance. Contemporary Educational Psychology, 38(1), 1–10. https://doi.org/10.1016/j.cedpsych.2012.09.001
Appendix A.
Tables containing information of LCA classes
Table A1. Means, standard deviations and medians of the number of correct answers and obtained minimum and maximum numbers of correct answers in Ecolier 2011, 2015 and 2019 and in each class. How many percents of contestant answered correctly and incorrectly to at least three problems and left at least three problems empty (mix %). The number of the classes and the size of each class. Please note that the percentages are rounded and hence the proportions of the classes do not always add up to 100%
Table A2. The most common answer choices for each question in Ecolier. A line (-) denotes an empty answer and x choosing more than one option. Correct answers are bolded
Table A3. Means, standard deviations and medians of the number of correct answers and obtained minimum and maximum numbers of correct answers in Benjamin 2011, 2015 and 2019 series and in each class. How many percents of contestant answered correctly and incorrectly to at least three problems and left more than two problems empty. The number of the classes and the size of each class
Table A4. The most common answer choices for each question in Benjamin. A line (-) denotes an empty answer and x choosing more than one option. Correct answers are bolded
Table A5. Means, standard deviations and medians of the number of correct answers and obtained minimum and maximum numbers of correct answers in Cadet 2011, 2015 and 2019 series and in each class. How many percents of contestant answered correctly and incorrectly to at least three problems and left more than two problems empty. The number of the classes and the size of each class. Please note that the percentages are rounded and hence the proportions of the classes do not always add up to 100%
Table A6. The most common answer choices for each question in Cadet. A line (-) denotes an empty answer and x choosing more than one option. Correct answers are bolded