
Abstract
Learning management systems (LMSs) are ubiquitous in higher education, yet few studies have examined changes in student engagement online with year level. Using data mining of LMSs, we examined the frequency and timing with which first, second, and third year science students accessed the various LMS resources. We compared online access with both attendance and performance. The findings demonstrated that students of all year levels showed a preference for lecture slides over recordings, although there was a marked increase in engagement with year level. For all students, the pattern of engagement with online resources was largely a function of motivation and exam anxiety—students accessed the LMS most frequently in the final three weeks of semester. Finally, attendance was predictive of performance only for first year students, with this demonstrating that approaches are required especially for these students to increase engagement. This study has shown that engagement can vary across year levels and should be considered when designing teaching and learning activities.
REVIEWING EDITOR:
Introduction
Learning management systems (LMSs), also referred to as virtual learning environments (VLEs), in combination with web-based lecture technologies (WBLT) have afforded significant and rapid change in the way universities approach teaching and learning. For example, most of Australia’s 43 universities have adopted LMSs, whilst in the US and the UK it is reported that 99% of universities and colleges have a LMS in place (Dahlstrom et al., Citation2014; UCISA, Citation2018). The adoption of digital platforms in the higher education system are driven both by student expectation and institutional strategies (O’Callaghan et al., Citation2017; UCISA, Citation2018; Walker et al., Citation2014). Learning management systems are proposed to enhance learning by enabling the provision of more flexible and blended-learning models, tailored learning, flexible teaching, and improved student outcomes at relatively low cost. Whilst there is an abundance of research reporting on correlations of student engagement and LMSs, case studies focussing on quantitative analysis of usage logs and student outcomes across years levels are underrepresented (O’Brien & Verma, Citation2019; Saunders & Hutt, Citation2015; Stewart et al., Citation2011). Examining student engagement and preferences for online learning resources is important for identifying the advantages and challenges associated with LMSs and to properly inform course design and implementation of technology-driven learning tools. Examining and analysing student activity within LMSs informs changes to improve student engagement and enhance the teaching and learning experience.
In a previous study, we examined student engagement with online learning resources in a single, first year course. We examined the frequency at which a variety of learning resources were accessed by analysing usage logs on a VLE platform, Blackboard. The results indicated limited student engagement with online learning resources, a significant preference of slides compared to recordings and a positive correlation between attendance at face-to-face lectures and performance (McKenna & Kopittke, Citation2018). Here we make a novel contribution to the understanding of online engagement in LMSs by examining and quantifying the effect of year level on student engagement with online learning resources. Within this context we address the following research questions (a) does online engagement change with year level? (b) does student preference of online learning resources change with year level? (c) do the patterns of behaviour examined in (a) and (b) differ between two campuses of the same university where the same courses were taught simultaneously by the same teaching staff? (d) is there a relationship between face-to-face attendance and performance? (e) is there a relationship with proportion of LMS resources accessed and performance? These questions were addressed using a data mining exercise, whereby usage logs of Blackboard were analysed. Data mining techniques are accurate in quantifying trends and patterns however we are limited in our certainty about what a student does with the learning resource after it is downloaded. Therefore, it is important to collect parallel data that may help explain and understand patterns of behaviour within Blackboard. In this study, we also compared usage logs with lecture attendance and student performance and analysed usage logs temporally over the Semester.
Review of literature
Student engagement is a critical factor in learning. The Australian Council for Educational Research defines engagement as ‘students’ involvement with activities and conditions likely to generate high-quality learning’ (Radloff, Citation2010, p. 3) whilst Krause and Coates define the term as ‘the quality of effort students themselves devote to educationally purposeful activities that contribute directly to desired outcomes’ (Krause & Coates, Citation2008, p. 493). It is worth acknowledging that, in the literature, engagement in academic settings arguably also refers to the older terminology of the devotion of time and energy, or motivation and involvement that students use in activities linked with learning (Astin, Citation1984; Bloom, Citation1974; Kuh et al., Citation1997). The factors influencing a student’s engagement are complex and varied (Coates, Citation2007; Kahn, Citation2014; Kahu, Citation2013). Furthermore, engagement itself is a multidimensional construct with behavioural, emotional, cognitive, and agentic dimensions (Sinatra et al., Citation2015). In this study we focused on a student behavioural aspect of engagement, using the frequency with which available online learning resources were accessed by students as a measure of engagement. In a large global review, Bond et al. (Citation2020), identified the behavioural dimension of engagement as a common theme in mapping student engagement in higher education. Additionally, we monitored attendance at face-to-face lectures. In the literature, the relationship between attendance and performance is inconclusive, however, face-to-face lectures remain an integral part of the student learning experience and their engagement with learning (Gosper et al., Citation2008; Grabe & Christopherson, Citation2008; Larkin, Citation2010; McCredden & Baldock, Citation2009). Furthermore, despite the prevalence of online teaching and learning, the face-to-face lecture remains a fundamental teaching tool in academia (Behr, Citation1988; Phillips, Citation2005; Schwerdt & Wuppermann, Citation2011).
Previous research, focusing on quantitative usage logs, demonstrates that student engagement with online resources is lower than anticipated, with many students not making use of the online resources available. For instance, Stewart et al. (Citation2011) found only 20–30% of their cohort accessing online resources outside of assessment periods and only ≤50% of students downloaded available lecture recordings in the studies of Leadbeater et al. (Citation2013) and Larkin (Citation2010). In a large multi-course analysis, Brennan et al. (Citation2019) established that by the penultimate week of semester, 30% of students had yet to go online. Only 61% of ‘outline’ notes, 19% of ‘complete’ notes, 3% of audio recording where used by a cohort of psychology students (Grabe & Christopherson, Citation2008). In studies undertaking cluster analysis of usage logs, 35% of students had significantly below average frequency of access to online lecture recordings (Inglis et al., Citation2011), and 32% of the study cohort were labelled ‘minimal online users’ in Li and Tsai (Citation2017). In the four courses analysed by O’Brien and Verma (Citation2019), 20–60% of students were classified as minimal users or absent online. The trends are similar in self-reporting studies, with 50% of students saying that they did not go online to access lecture recordings and 29% saying that they had not accessed a single recording by the end of semester in Yeung et al. (Citation2016).
The implications for student performance associated with a lack of engagement with online resources are potentially concerning and warrants further investigation. Using cluster analysis to define similar groupings of student behaviours, ‘high’ and ‘low’ frequency users of online lecture recordings did not differentiate in their performance (Brooks et al., Citation2014; Leadbeater et al., Citation2013). In contrast however, student academic performance has been positively correlated with the frequency of access of learning materials on LMS (Cerezo et al., Citation2016; Inglis et al., Citation2011; Larmuseau et al., Citation2018; Shah & Barkas, Citation2018).
It has been demonstrated that it is not only the frequency with which lecture recordings or WBLT are accessed but also the timing and the way they are used that has implications for performance. Students who viewed recordings throughout semester achieved the higher grades, whilst students who accessed them only during revision/examination periods had the poorest grades (Sarsfield & Conway, Citation2018). In a second year science course, substituting lecture recordings for attendance had a negative effect on performance (Edwards & Clinton, Citation2019).
Whilst there is a voluminous number of studies, with widely varying methodologies, examining online engagement with attendance and outcomes, within the literature, we found only limited studies examining changes in student engagement as a function of year level or campus location, using quantitative analysis. We consider this a gap in knowledge especially given the prevalence of online learning in the higher education sector. Evaluation of student learning within the online learning environment is required to ensure students are not disadvantaged as they progress through their university studies. If it is known how students engage with learning resources, the provisions of resources can be tailored to optimise learning outcomes. However, the existing publications on the topic are inconclusive, with year levels, programs, and university campus location apparently affecting student utilisation of learning resources (Marriott, Citation2002; Nordmann et al., Citation2019; Sarsfield & Conway, Citation2018). We hypothesised that online engagement would increase as a function of year level, based on the assumption that students at higher levels are undertaking more specialised courses that are directly related to their area of interest.
Context and methods
The courses
The study was conducted at The University of Queensland (Australia) using three undergraduate courses in the discipline of natural resource science. The first year course was taught on Campus B (a rural campus) in Semester Two whereas the second and third year courses were taught simultaneously at both Campus A (a city campus) and Campus B in Semester One. Data collection was completed in 2017. All three courses are core courses for students enrolled in the Bachelor of Agricultural Science, Bachelor of Applied Science, and Bachelor of Environmental Science/Management, with a limited number of students enrolled in the courses as an elective.
The first year course consisted of 308 enrolments of which 135 students consented to participate in the study. The first year course consisted of 3 h didactic lectures per week (13 week semester), 1 h tutorial per week, and a single day field trip. The second year course had 93 enrolments of which 49 consented to participate; 29 at Campus A, 20 at Campus B. The second year course consisted of a 3 h didactic lecture per week and a 3 h laboratory practical per week. The third year course had 46 students enrolled of which 23 consented to participate; 10 at Campus A, 13 at Campus B. The third year course follows the same format as the second year course, with a 3 h didactic lecture per week and a 3 h laboratory practical per week. All three courses are taught by the same teaching team, and the format of learning resources and assessment styles are comparable.
Course material
All three courses utilise the VLE platform, Blackboard, where learning resources are made available to all enrolled students. Each of the courses examined in the present study offered the same three styles of learning resources: lecture recordings, lecture notes, and lecture slides. Lecture notes are thorough, referenced writings on the topic of each lecture including figures, diagrams, and further reading. Lecture slides are the Microsoft PowerPoint slides which accompany the corresponding lecture, uploaded to Blackboard in PDF format. Both the lecture notes and lecture slides for all three courses were available to students for the entire duration of the semester. The lecture recordings comprise the PowerPoint slides, with a voice-over of the lecturer recorded live during the face-to-face lecture using Echo360 (Lectopia). Lecture recordings were uploaded to Blackboard within 24 h and remained available to students for the remainder of the semester. Thus, although the total number of files may differ between year levels as discussed below (), it is important to note that each type of resource follows the same format and style across all year levels.
Table 1. Total available online learning files for each year level and number of consenting students involved in the analysis.
All courses were taught over a 13-week semester. Immediately following the 13 weeks of teaching was a Revision week, followed by an Exam Week. Although all three courses had 3 h of lectures per week, there were the following exceptions. For the first year course, there were three guest lectures (1 h each) for which slides were provided but not notes, whilst Week 13 was a revision lecture only. For the second year course, there were no learning resources for Week 4 as these lectures were replaced by an online training exercise, whilst Week 13 was a revision lecture only with no lecture notes or lecture slides ( and ). For the third year course, there were no learning resources for Week 8 as this was a teaching-free week for all third year students within the Faculty, whilst there were no accompanying lecture notes available for Week 6 and 7 ( and ).
The lecture slides were consistently prepared such that each individual 1 h lecture had its own file. Thus, there were up to 39 individual lecture slide files per course over the 13 weeks of teaching. The final number however varies due to the exceptions discussed above ().
For the lecture notes, the first year course had a separate file for each of the 1 h lectures. For the second and third year courses the lecture notes were combined into modules (groups of lectures on a similar theme), and hence there were considerably fewer files available for download in both the second and third year courses (). Specifically, the second year course consists of five modules; Module one was covered in Weeks 1–3, Module two in Weeks 5–6, Module three in Weeks 7–8, Module four in Weeks 9–10, and Module five Weeks 11–12. The third year course consists of four modules, Module one was covered in Weeks 1–2, Module two in Weeks 3–4, Module three in Week 5 and 9, and Module four in Weeks 10–12.
Finally, for the lecture recordings, the number of files available depended upon the scheduling of the classes. Specifically, where the weekly lectures were scheduled as a single 3 h block, then this was recorded as a single file each week (yielding 13 files across the Semester). Where the 3 h of lectures was split into a 2 h block and a 1 h block, there were two lecture recording files available each week (yielding 26 files across the Semester) ().
Data collection and limitations
Observational data was used for this study by collating usage logs of Blackboard to examine student access to learning resources. Tracking data records an individual’s identification and a time stamp for each download, thus, a pattern of downloads across the semester can be established. Whilst a count is made every time a student clicks on a file link, there is no certainty about what the student does with the file once they have downloaded it, which is an inherent limitation of the present data collection method. We acknowledge that the first year students had a higher number of files available to download compared to second and third year students, potentially influencing the willingness of students to download files. Lecture attendance was recorded by student identification number on a role. Furthermore, we did not collect demographic data on enrolled students as this was not part of our human ethics approval, but rather, our focus was on examining behaviour with learning resources. Student’s enrolled in the courses were informed of the study via a Blackboard announcement (which was also forwarded to their student email address) and in the first lecture by way of Participation Information Sheet. Only those student’s that provided an optional Consent to Participate were included in this study. Participants were not incentivised, rewarded, or disadvantaged regarding their decision to participate. Ethical approval was obtained from the University before the commencement of the study. All data was kept anonymously and securely on the University’s research data management system.
Data analysis
Statistical analyses comparing the frequency of access to different types of learning resources (recordings, slides, and notes) between year levels were performed using R version 4.0.5 with a two-way analysis of variance (ANOVA). Performance was compared with attendance and total downloads of learning resources using R version 4.0.5 with linear regressions. Statistical analysis comparing total weekly downloads of all learning resources was performed using R version 4.0.5, with a two-way analysis of variance (ANOVA) using Poisson errors without interaction. Similarly, analysis was performed to determine differences between the use of lecture recordings as supplementary or substitutional, using R with a two-way analysis of variance (ANOVA) using Beta regression without interaction.
Results
Attendance at face-to-face lectures
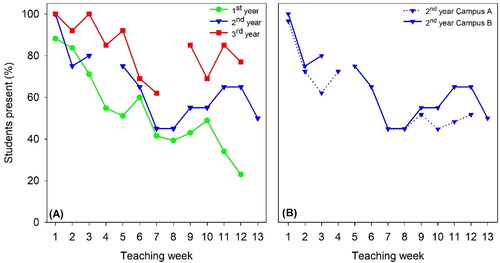
Student engagement was considered using attendance at face-to-face lectures and frequency of access to learning resources online. Overall, the proportion of students attending face-to-face lectures increased with year level. However, attendance at face-to-face lectures decreased as the semester progressed with this behaviour being evident across all year levels (). First year students had the lowest average attendance (53%), being lower than for second year students (60%) and third year students (76%). Towards the end of semester, in Weeks 11 and 12, attendance of the second and third year students increased. There was little difference in attendance rates for the second year students at the two different campuses, with average attendance being 49% at Campus A and 57% at Campus B (). For brevity, hereafter, we only include data for Campus B for the second year course as there were no notable differences between campus locations in both year levels.
Figure 1. (A) Student attendance at face-to-face lectures on Campus B over a 13 Week semester, 1st year, n = 135, 2nd year, n = 20 and 3rd year, n = 13. (B) Attendance of 2nd year students at each campus throughout the semester: Campus A, n = 29; Campus B, n = 20.
Changes in online engagement with year level
We analysed the overall use, or access frequency, of online resources as a proportion of total available online resources for each year level. For this, we examined which resources from each of the 13 weeks of teaching had been downloaded without considering when those resources had been downloaded. Duplicate downloads by unique individuals were excluded (in other words, if a student downloaded the same file twice, it was counted only once). Results revealed distinct preferences for the type of learning resource. Students at all year levels had a significant preference (p < 0.001) for written material (lecture slides or notes) compared to lecture recordings (). Next, we examined whether the extent to which the learning resources were accessed varied with year level. First year students were significantly (p < 0.001) less likely to engage with lecture recordings and lecture notes than were second and third year students (). There was no significant difference (p < 0.001) between year levels with regards to preference for lecture slides (, ). We also considered whether behaviour was influenced by campus. For second year students, learning resource preference was similar between different campuses (). Overall, access patterns for each year level, for each resource type, remained relatively constant until the end of semester when a slight upturn in access of recordings and slides was observed ().
Figure 2. (A–C) Frequency of downloads of each resource type available online as a percentage of total available resources each week, per year level at Campus B. (D–E) Proportion of learning resources downloaded by 2nd year students at each campus. Data show which resources were being downloaded, regardless of when they were downloaded.
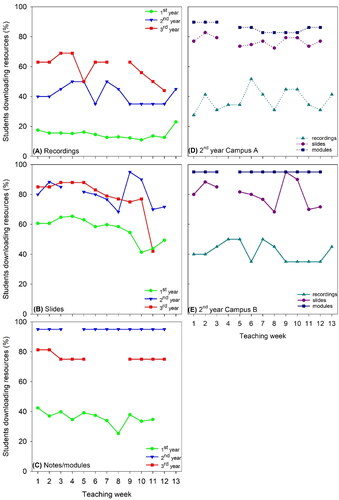
Table 2. Average number of learning resources downloaded by students as a percentage of total available resources for each year level at Campus B and a comparison of 2nd year students at Campus A.
Temporal changes in online engagement
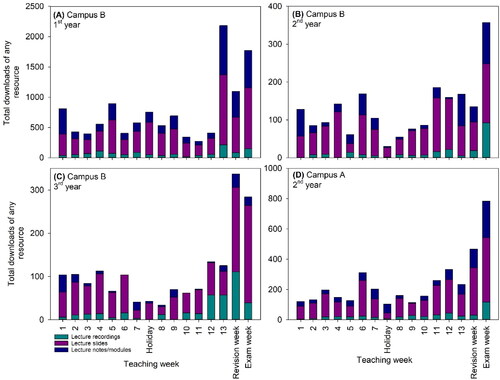
Next, we examined when learning resources were being accessed, most of which could be accessed at any point throughout the entire semester (). This analysis used the total number of downloads of each resource type and thus any duplicate downloads by unique individuals were incorporated. The absolute number of downloads vary with year level due to the different sample sizes of each year level cohort and the different numbers of resources available for each course (). We observed a significant increase in engagement with online learning resources in Week 13 and Exam Week, with this being independent of year level or campus (p < 0.05, ). The three week period of Week 13, Revision Week, and Exam Week accounted for 42% of all downloads by first year students (), 32% for the second year students at Campus B and 39% at Campus A () and 42% by the third year students at Campus B ().
Figure 3. (A–C) Weekly downloads by students at different year levels on Campus B. (B,D) Comparison between Campus A and Campus B downloads for 2nd year students. Data show when resources were being downloaded.
Relationship between attendance at face-to-face lectures and viewing lecture recordings
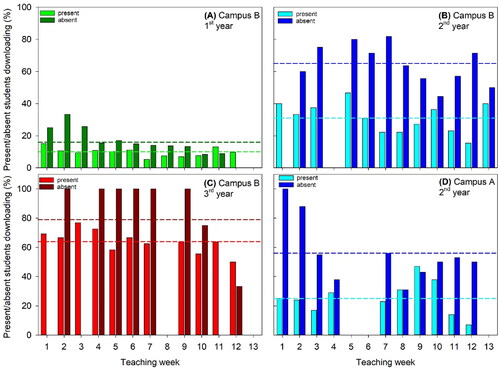
Given the low level of engagement with lecture recordings observed across year levels, we analysed if students were using the lecture recordings as a substitute for attending face-to-face lectures or if they were being downloaded supplementary to attendance. In all cohorts, lecture recordings were used predominantly as a substitute for missed face-to-face lectures (). Third year students used lecture recordings as supplementary to attending the face-to face lecture at significantly higher rates than first and second year students (p < 0.05). Of the third year students that attended the face-to face lecture, an average of 65% also viewed the recording. Furthermore, an average of 79% of absent third year students downloaded the lecture recording () which was significantly higher (p < 0.05) than absent first year students with an average of only 16% downloading the missed lecture (). In the second year cohort, lecture recordings were predominantly used as a substitute for a missed face-to-face lecture at both campuses at similar rates of absent students, 56% at Campus B and 65% at Campus A accessed the recording ().
Figure 4. (A–C) Use of lecture recordings as either a substitute for or supplementary to attendance at a face-to-face lecture for each year cohort at Campus B. (B,D) Comparison in use of lecture recordings between Campus A and Campus B 2nd year students. Dashed lines represent the average of each student type, absent or present.
Relationship between attendance, online engagement, and performance
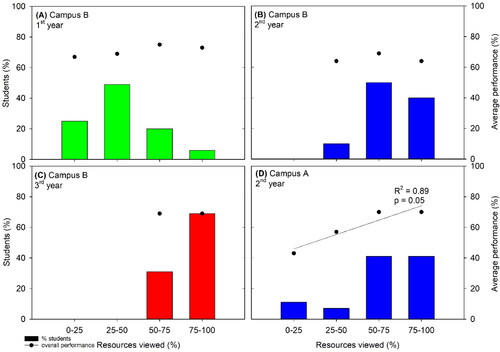
After analysing student attendance and online engagement in terms of frequency and timing, of access, we were interested in how this behaviour impacted upon overall student performance. Initially, we compared the number of resources viewed by individual students (as a proportion of total available resources, excluding duplicate downloads), with overall course performance (). The relationship between online engagement and performance was inconsistent, with a significant effect seen only in the second year cohort at Campus A (p = 0.05). The first year students accessing the greatest proportion of resources (75–100%) achieved an average performance of 73% whereas students accessing 0–25% of resources achieved an average of 67% (). Second year students at Campus B viewing 50–75% of resources achieved an overall performance of 69% compared to the other two clusters of students with an average performance of 64% whereas second year students at Campus A viewing 75–100% of resources achieved 27% higher than students accessing 0–25% of resources ().
Figure 5. (A–C) Relationship between numbers of downloads and overall course performance across year level cohorts at Campus B. (B,D) Comparison of downloads and performance of 2nd year students between Campus A and Campus B.
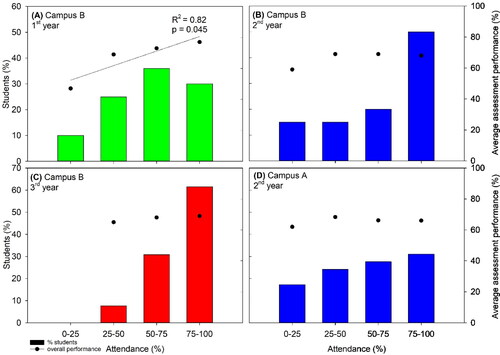
Finally, we analysed if attendance at face-to-face lectures influenced student performance in the courses. In all year levels, low rates of attendance resulted in lower performance compared to the higher rates of attendance (). The relationship between attendance and performance was significant for first year students (p = 0.045) but was not significant for the higher year levels (compare ). The performance of first year students attending most frequently (75–100% of lectures) was 77% whereas those attending least frequently (0–25% of lectures) achieved 47% (). Comparing second year students at different campuses, Campus B students attended face-to-face lectures more frequently, 50% attended 75–100% (compared to 31% at Campus A), yet course performance was similar with Campus A (), with an average performance of 66% at both campuses.
Figure 6. (A–C) Relationship between attendance and performance, across year level cohorts at Campus B. (B,D) Comparison of performance and attendance of 2nd year students between Campus A and Campus B.
Discussion
Patterns of behaviour: when, how often, and under what motivation are students engaged online?
By analysing the online behaviour of first, second, and third year natural resource science students, we first observed that students had a preference for the type of learning resources. Specifically, students consistently had a clear preference for written materials (i.e. slides and notes) over recordings. First year students accessed only 10% of the recordings available and third year students accessed 58% (). In comparison, slides were accessed 60% by first year students and ∼80% for both second the third year students (). Even when the frequency of access increased towards the end of semester, lecture recordings remained the least preferred learning resource. Secondly, we found that students’ engagement with online resources across the three year levels studied was largely a function of motivation and exam anxiety, demonstrated by the increased frequency of access toward the end of the semester and into the Revision and Examination Weeks. In this regard, similar patterns of engagement online have been demonstrated in other quantitative usage log studies. For example, usage was found to be closely associated with assessment and examination deadlines for both first and third year geography students (Stewart et al., Citation2011). Thirdly, we found that when first year students missed face-to-face lectures, they did not, to a large extent, utilise lecture recordings as a substitute (). Whilst the students in our study predominantly used lecture recordings to catch-up on a missed lecture (viz. supplementary), particularly for the second and third year students, overall adoption of viewing lecture recordings was low compared to the other learning resources ( and ). The lack of substituting a recording after a missed face-to-face lecture is commonly reported (Drouin, Citation2013; Nordmann et al., Citation2019; Sawon et al., Citation2012).
We also examined whether behaviour differed between year levels. Our data demonstrated a shift in behaviour from first year to third year, with third year students being more engaged with all forms of resources online and having the highest usage of lecture recordings as both a substitute and supplementary to attendance. In a similar study investigating differences across year levels, Nordmann et al. (Citation2019) found that students in higher year levels tended to use recordings at higher rates than lower year levels. In contrast, no distinct differences in usage logs were found between first and second year science students (Sarsfield & Conway, Citation2018). In a self-reporting study, Holbrook and Dupont (Citation2009) showed that first year students were more likely to use a podcast, and more likely to use it to catch up on a missed lecture than the third year students. However, they also found that the temptation to miss a lecture was greater for the first year students than for the third year students (Holbrook & Dupont, Citation2009). We propose that there is an effect of student self-efficacy, which inherently increases with time in a higher education environment and with maturity of learning, familiarity with VLEs, and progression through the common years into specialised years of a degree program. In this regard, O’Brien and Verma (Citation2019) found a variety of factors influenced online usage patterns of first year business students, in particular past academic performance, commuting distance, and gender and age interactions. Engagement with VLEs requires a student to be highly self-regulated and is related to students’ differences in approaches to learning (Bassili, Citation2006; Bos & Brand-Gruwel, Citation2016; Le et al., Citation2018), the decision of what to access and when lies with them, compared to a relatively simple decision of whether or not to attend a lecture. In fact, Dolnicar (Citation2005) described the motivation behind lecture attendance as a pragmatic approach because students reported attending lectures largely to determine what they were supposed to learn and to find out about assessment tasks. First year students’ inexperience results in low levels of engagement, but as students’ progress they become more aware of the resources available, are able to navigate Blackboard more efficiently and are more pragmatic in their approach to learning having developed greater self-efficacy.
Finally, we observed small differences in the patterns of behaviour between the two campuses. Average attendance by second year students differed between campuses but did not result in differences in performance ( and ). Second year students at Campus B used recordings as supplementary to attending face-to-face lectures more than students on Campus A (). Similarly, third year students’ attendance rates differed between the campuses however, small differences in overall performance were observed (data not shown). Students were separated by campus due to the Degree program in which they were enrolled, which had different entry level scores. Second year Campus A students are predominantly enrolled in Bachelor of Environmental Science or Bachelor of Environmental Management Campus B students are largely from the Bachelor of Agricultural Science programme. Thus, despite the students having differing backgrounds, there was minimal difference in patterns of online access observed between second year and third year students at the different campuses.
What is more important in determining performance, engagement at face-to-face lectures or online engagement?
Examining performance as a function of the proportion of online learning resources accessed by an individual, we found correlations with second and third year students at Campus A (). For first year students, however, it was apparent that attendance at face-to-face lectures was more predictive in explaining overall performance (). In other words, especially for students where the level of overall engagement was lower (first year students), those who had higher attendance at face-to-face lectures tended to perform better, whilst the proportion of online learning resources accessed was not strongly related to performance. However, the correlation between attendance at face-to-face lectures and performance was less pronounced for the higher-level students, possibly because these students had higher levels of motivation and hence were more engaged with the learning resources/activities. Indeed, first year students were the least engaged of the three year levels studied, having both the lowest average attendance and the lowest level of engagement online. First year students face the challenge of being new to the higher education environment, learning how to navigate VLEs as well as a host of other social and academic challenges. It is therefore perhaps not surprising that the first year students that seek out engagement at face-to-face lectures have a performance advantage over those who are less engaged. The results observed in the present study are similar to those reported previously. For example, Edwards and Clinton (Citation2019) found that attendance was more important in explaining student attainment, moreover, the availability of recordings negatively affected attendance. Interestingly, Edwards and Clinton (Citation2019) also demonstrated those students that viewed recordings more frequently do not achieve higher levels of attainment, a finding echoed in the present study. Stewart et al. (Citation2011) also demonstrated that attendance was more predicative of performance than Blackboard usage and that attendance was more significant for first years than it was third year students. It must be noted that we also observed a negative effect of attendance on performance for third year students on Campus A (data not shown). Our results indicate that one factor alone cannot explain student overall performance. The third year students were more engaged with lecture recordings and slides significantly more than first years (), and used recordings as a substitute and supplementary resource to face-to-face lectures more frequently than both first and second year students (). In the case of third year students, who are more experienced, specialised in their degree program, and have a higher level of self-efficacy, their engagement online may compensate for lower attendance at Campus A.
Although we did not observe a consistent correlation between online access and performance in the present study (), there are multiple factors that could contribute to this observation. For example, it is not only the frequency with which resources are accessed but also the timing and the motivation behind that access that influences performance. It has been shown that students who view recordings regularly throughout semester achieved higher grades than students who crammed only during revision and exam preparations (Sarsfield & Conway, Citation2018) and that more frequent viewing of recordings as a substitute for attendance does not improve performance (Edwards & Clinton, Citation2019; Inglis et al., Citation2011; Williams et al., Citation2012). In a fully online course, Boroujeni and Dillenbourg (Citation2019), found students with a repeating study pattern achieve better grades. In our data set it was apparent that there was another group of students accessing materials frequently that were also regularly present at lectures and tended to perform well on assessment tasks, demonstrating a conscientious student effect. Such factors would need to be considered to further examine the relationship between online access and performance.
The present study provides important information on how to potentially improve student learning, especially in lower-level courses where overall levels of engagement are lower. For such courses, our data suggest that attendance at face-to-face lectures is important. Furthermore, from the literature, it seems likely that it is the availability of lecture recordings that impacts negatively on attendance at face-to-face lectures (Edwards & Clinton, Citation2019; Grabe & Christopherson, Citation2008; James & Seary, Citation2019; Massingham & Herrington, Citation2006). Thus, it is possible, especially for lower-level courses, that removal of lecture recordings would increase attendance at face-to-face lectures and increase overall performance. In such a case, it would not be necessary to also remove lecture slides or notes. This is because Raver and Maydosz (Citation2010) have shown that the provision of notes regardless of timing (before or after lectures) increased student performance, whilst Worthington and Levasseur (Citation2015) showed that the provision of PowerPoint slides did not result in absenteeism and that there was no significant effect on performance between students who did or did not use slides. In the current study, students across all three year levels had a significant preferences for the slides and notes compared to the lecture recordings (), and these resources were more regularly accessed throughout semester (). Thus, it would appear possible that by removing lecture recordings, this would inconvenience relatively few students (given that it is consistently the least popular learning resource) whilst perhaps increasing attendance at face-to-face lectures, with this being associated with higher performance.
In this study, we focussed on a behavioural aspect of student engagement. We analysed the frequency and timing with which online resources were accessed as well as examining attendance and performance as simple measures of engagement. However, engagement is a complex construct, encompassing many internal and external drivers. We did not collect demographic data in this study, however it is possible that demographics could influence the relationships observed in our results, but literature shows inconsistent influence of gender, age, and background on utilisation of online learning resource. Whilst analysing usage logs demonstrates only the behavioural aspect of engagement, this is a common approach in the literature. In a review of 113 publications, Henrie et al. (Citation2015) found 77% used behavioural measures as a measure of engagement, predominantly as qualitative self-reporting data, as opposed to usage logs. In a global mapping review, 243 studies examined technology and student engagement (Bond et al., Citation2020). Fan et al. (Citation2021) analysed patterns of online behaviour in LMS’s of 5500 students over 23 courses at one Australian university. As is evident in the data collected in this study, technology itself does not generate additional pedagogic value, rather it offers logistical value and flexibility (Laurillard, Citation2009). Additionally, the adoption of VLEs can help lecturers refine learning materials and act as a scaffold for the design of learning materials (Hauge, Citation2014). Furthermore, analysing usage logs of online platforms can be a valuable resource for teaching staff, directing teaching and learning activities (Harrak et al., Citation2019). However, adopting a VLE platform and using it as a learning resource depository, simply because it exists or because it is mandated by the educational institution does not constitute good teaching and learning design. Just because it is there, does not mean students will engage with it. Engaging students and providing a sense of belonging is critical for retention and achievement in higher education (Ahn & Davis, Citation2023). The way in which we provide content may be just as important as the content itself. Recently, more directed effort has been focused on the importance of designing online resources correctly and understanding that there are several principals of multimedia learning within a pedagogical framework that need to be considered to enhance student engagement (Mayer, Citation2017; Meehan & McCallig, Citation2019).
Conclusions
The present study demonstrated that engagement both online and at face-to-face lectures increased with year level, with second and third year students being more engaged than first year students and that students of all year levels showed a significant preference for lecture slides over lecture recordings. Only 10% of the lecture recording were accessed by first year students compared to 58% by third year students whereas 60% of slides were accessed by first year students and ∼80% by both second and third year students. Students at all year levels engaged with online resources most frequently at the end of semester before final examinations, with the final three weeks of semester accounting for 42% of all downloads by first and third year students, and 32% of all downloads by second year students. Attendance at face-to-face lectures was predictive of performance for the first year students but not the second and third year students. Engagement online was positively correlated with performance for the second year students at Campus A. The data presented here indicate that lecture attendance and online engagement can vary across year levels and this needs to be considered in teaching and learning design and may explain the inconsistency in evidence between online engagement and performance within the literature.
Ethical approval
Ethics approval number 2016001870 was granted from The University of Queensland. Students enrolled in the courses were informed of the study via a Blackboard announcement (which was also forwarded to their student email address) and in the first lecture by way of Participation Information Sheet. Only those students that provided Consent to Participate were included in this study.
Acknowledgements
We thank Buddhi Dayananda (The University of Queensland) for statistical analysis of the data.
Disclosure statement
No potential conflict of interest was reported by the author(s).
Data availability statement
The authors had complete access to the data presented within the manuscript ‘Quantifying online engagement, lecture attendance and student achievement at three levels of undergraduate study’.
Additional information
Funding
References
- Ahn, M. Y., & Davis, H. H. (2023). Students’ sense of belonging and their socio-economic status in higher education: A quantitative approach. Teaching in Higher Education, 28(1), 136–149. https://doi.org/10.1080/13562517.2020.1778664
- Astin, A. W. (1984). Student involvement: A developmental theory for higher education. Journal of College Student Personnel, 25(4), 297–308. https://www.proquest.com/docview/195180247?accountid=14723
- Bassili, J. N. (2006). Promotion and prevention orientations in the choice to attend lectures or watch them online. Journal of Computer Assisted Learning, 22(6), 444–455. https://doi.org/10.1111/j.1365-2729.2006.00192.x
- Behr, A. (1988). Exploring the lecture method: An empirical study. Studies in Higher Education, 13(2), 189–200. https://doi.org/10.1080/03075078812331377866
- Bloom, B. S. (1974). Time and learning. American Psychologist, 29(9), 682–688. https://doi.org/10.1037/h0037632
- Bond, M., Buntins, K., Bedenlier, S., Zawacki-Richter, O., & Kerres, M. (2020). Mapping research in student engagement and educational technology in higher education: A systematic evidence map. International Journal of Educational Technology in Higher Education, 17(1), 1–30. https://doi.org/10.1186/s41239-019-0176-8
- Boroujeni, M. S., & Dillenbourg, P. (2019). Discovery and temporal analysis of MOOC study patterns. Journal of Learning Analytics, 6(1), 16–33. https://doi.org/10.18608/jla.2019.61.2
- Bos, N., & Brand-Gruwel, S. (2016). Student differences in regulation strategies and their use of learning resources: Implications for educational design. Proceedings of the Sixth International Conference on Learning Analytics & Knowledge. https://doi.org/10.1145/2883851.2883890
- Brennan, A., Sharma, A., & Munguia, P. (2019). Diversity of online behaviours associated with physical attendance in lectures. Journal of Learning Analytics, 6(1), 34–53. https://doi.org/10.18608/jla.2019.61.3
- Brooks, C., Erickson, G., Greer, J., & Gutwin, C. (2014). Modelling and quantifying the behaviours of students in lecture capture environments. Computers & Education, 75, 282–292. https://doi.org/10.1016/j.compedu.2014.03.002
- Cerezo, R., Sánchez-Santillán, M., Paule-Ruiz, M. P., & Núñez, J. C. (2016). Students’ LMS interaction patterns and their relationship with achievement: A case study in higher education. Computers & Education, 96, 42–54. https://doi.org/10.1016/j.compedu.2016.02.006
- Coates, H. (2007). A model of online and general campus‐based student engagement. Assessment & Evaluation in Higher Education, 32(2), 121–141. https://doi.org/10.1080/02602930600801878
- Dahlstrom, E., Brooks, D. C., & Bichsel, J. (2014). The current ecosystem of learning management systems in higher education: Student, faculty, and IT perspectives. https://library.educause.edu/resources/2014/9/the-current-ecosystem-of-learning-management-systems-in-higher-education-student-faculty-and-it-perspectives
- Dolnicar, S. (2005). Should we still lecture or just post examination questions on the web?: The nature of the shift towards pragmatism in undergraduate lecture attendance. Quality in Higher Education, 11(2), 103–115. https://doi.org/10.1080/13538320500175027
- Drouin, M. A. (2013). If you record it, some won’t come using lecture capture in introductory psychology. Teaching of Psychology, 41(1), 11–19. https://doi.org/10.1177/0098628313514172
- Edwards, M. R., & Clinton, M. E. (2019). A study exploring the impact of lecture capture availability and lecture capture usage on student attendance and attainment. Higher Education, 77(3), 403–421. https://doi.org/10.1007/s10734-018-0275-9
- Fan, S., Chen, L., Nair, M., Garg, S., Yeom, S., Kregor, G., Yang, Y., & Wang, Y. (2021). Revealing impact factors on student engagement: Learning analytics adoption in online and blended courses in higher education. Education Sciences, 11(10), 608.https://doi.org/10.3390/educsci11100608
- Gosper, M., Green, D., McNeill, M., Phillips, R., Preston, G., & Woo, K. (2008). The impact of web-based lecture technologies on current and future practices in learning and teaching. http://www.cpd.mq.edu.au/teaching/wblt/overview.htm
- Grabe, M., & Christopherson, K. (2008). Optional student use of online lecture resources: Resource preferences, performance and lecture attendance. Journal of Computer Assisted Learning, 24(1), 1–10. https://doi.org/10.1111/j.1365-2729.2007.00228.x
- Harrak, F., Bouchet, F., & Luengo, V. (2019). From student questions to student profiles in a blended learning environment. Journal of Learning Analytics, 6(1), 54–84. https://doi.org/10.18608/jla.2019.61.4
- Hauge, T. E. (2014). Uptake and use of technology: Bridging design for teaching and learning. Technology, Pedagogy and Education, 23(3), 311–323. https://doi.org/10.1080/1475939X.2014.942750
- Henrie, C. R., Halverson, L. R., & Graham, C. R. (2015). Measuring student engagement in technology-mediated learning: A review. Computers & Education, 90, 36–53. https://doi.org/10.1016/j.compedu.2015.09.005
- Holbrook, J., & Dupont, C. (2009). Profcasts and class attendance—Does year in program matter? Bioscience Education, 13(1), 1–4. https://doi.org/10.3108/beej.13.c2
- Inglis, M., Palipana, A., Trenholm, S., & Ward, J. (2011). Individual differences in students’ use of optional learning resources. Journal of Computer Assisted Learning, 27(6), 490–502. https://doi.org/10.1111/j.1365-2729.2011.00417.x
- James, T., & Seary, K. (2019). Why aren’t they attending class like they are supposed to? A review into students’ perception of the value of class attendance. Student Success, 10(1), 115–129. https://doi.org/10.5204/ssj.v10i1.1111
- Kahn, P. E. (2014). Theorising student engagement in higher education. British Educational Research Journal, 40(6), 1005–1018. https://doi.org/10.1002/berj.3121
- Kahu, E. R. (2013). Framing student engagement in higher education. Studies in Higher Education, 38(5), 758–773. https://doi.org/10.1080/03075079.2011.598505
- Krause, K. L., & Coates, H. (2008). Students’ engagement in first‐year university. Assessment & Evaluation in Higher Education, 33(5), 493–505. https://doi.org/10.1080/02602930701698892
- Kuh, G. D., Pace, C. R., & Vesper, N. (1997). The development of process indicators to estimate student gains associated with good practices in undergraduate education. Research in Higher Education, 38(4), 435–454. https://doi.org/10.1023/A:1024962526492
- Larkin, H. E. (2010). “But they won’t come to lectures …” The impact of audio recorded lectures on student experience and attendance. Australasian Journal of Educational Technology, 26(2), 238–249. https://doi.org/10.14742/ajet.1093
- Larmuseau, C., Evens, M., Elen, J., Van Den Noortgate, W., Desmet, P., & Depaepe, F. (2018). The relationship between acceptance, actual use of a virtual learning environment and performance: An ecological approach. Journal of Computers in Education, 5(1), 95–111. https://doi.org/10.1007/s40692-018-0098-9
- Laurillard, D. (2009). The pedagogical challenges to collaborative technologies. International Journal of Computer-Supported Collaborative Learning, 4(1), 5–20. https://doi.org/10.1007/s11412-008-9056-2
- Le, A., Cheng, C. K., & Joordens, S. (2018). Student personality characteristics differ in MOOCs versus blended-learning university courses. International Journal of Online Pedagogy and Course Design, 8(2), 16–28. https://doi.org/10.4018/IJOPCD.2018040102
- Leadbeater, W., Shuttleworth, T., Couperthwaite, J., & Nightingale, K. P. (2013). Evaluating the use and impact of lecture recording in undergraduates: Evidence for distinct approaches by different groups of students. Computers & Education, 61, 185–192. https://doi.org/10.1016/j.compedu.2012.09.011
- Li, L.-Y., & Tsai, C.-C. (2017). Accessing online learning material: Quantitative behavior patterns and their effects on motivation and learning performance. Computers & Education, 114, 286–297. https://doi.org/10.1016/j.compedu.2017.07.007
- Marriott, P. (2002). A longitudinal study of undergraduate accounting students’ learning style preferences at two UK universities. Accounting Education, 11(1), 43–62. https://doi.org/10.1080/09639280210153263
- Massingham, P., & Herrington, T. (2006). Does attendance matter? An examination of student attitudes, participation, performance and attendance. Journal of University Teaching and Learning Practice, 3(2), 20–42. https://doi.org/10.53761/1.3.2.3
- Mayer, R. E. (2017). Using multimedia for e‐learning. Journal of Computer Assisted Learning, 33(5), 403–423. https://doi.org/10.1111/jcal.12197
- McCredden, J., & Baldock, T. (2009, December). More than one pathway to success: Lecture attendance, lectopia viewing and exam performance in large engineering classes. 20th Australasian Association for Engineering Education Conference, University of Adelaide.
- McKenna, B. A., & Kopittke, P. M. (2018). Engagement and performance in a first year natural resource science course. Journal of Computer Assisted Learning, 34(3), 233–242.
- Meehan, M., & McCallig, J. (2019). Effects on learning of time spent by university students attending lectures and/or watching online videos. Journal of Computer Assisted Learning, 35(2), 283–293. https://doi.org/10.1111/jcal.12329
- Nordmann, E., Calder, C., Bishop, P., Irwin, A., & Comber, D. (2019). Turn up, tune in, don’t drop out: The relationship between lecture attendance, use of lecture recordings, and achievement at different levels of study. Higher Education, 77(6), 1065–1084. https://doi.org/10.1007/s10734-018-0320-8
- O’Brien, M., & Verma, R. (2019). How do first year students utilize different lecture resources? Higher Education, 77(1), 155–172. https://doi.org/10.1007/s10734-018-0250-5
- O’Callaghan, F. V., Neumann, D. L., Jones, L., & Creed, P. A. (2017). The use of lecture recordings in higher education: A review of institutional, student, and lecturer issues. Education and Information Technologies, 22(1), 399–415. https://doi.org/10.1007/s10639-015-9451-z
- Phillips, R. (2005). Challenging the primacy of lectures: The dissonance between theory and practice in university teaching. Journal of University Teaching & Learning Practice, 2(1), 2. https://doi.org/10.53761/1.2.1.2
- Radloff, A. (2010). Doing more for learning: Enhancing engagement and outcomes: Australasian Survey of Student Engagement: Australasian Student Engagement Report. https://research.acer.edu.au/ausse/12/
- Raver, S. A., & Maydosz, A. S. (2010). Impact of the provision and timing of instructor-provided notes on university students’ learning. Active Learning in Higher Education, 11(3), 189–200. https://doi.org/10.1177/1469787410379682
- Sarsfield, M., & Conway, J. (2018). What can we learn from learning analytics? A case study based on an analysis of student use of video recordings. Research in Learning Technology, 26. https://doi.org/10.25304/rlt.v26.2087
- Saunders, F. C., & Hutt, I. (2015). Enhancing large-class teaching: A systematic comparison of rich-media materials. Higher Education Research & Development, 34(6), 1233–1250. https://doi.org/10.1080/07294360.2014.911261
- Sawon, K., Pembroke, M., & Wille, P. (2012). An analysis of student characteristics and behaviour in relation to absence from lectures. Journal of Higher Education Policy and Management, 34(6), 575–586. https://doi.org/10.1080/1360080X.2012.716004
- Schwerdt, G., & Wuppermann, A. C. (2011). Sage on the stage: Is lecturing really all that bad? Education Next, 11(3), 62–67. https://d-nb.info/110039222X/34
- Shah, R. K., & Barkas, L. (2018). Analysing the impact of e-learning technology on students’ engagement, attendance and performance. Research in Learning Technology, 26. https://doi.org/10.25304/rlt.v26.2070
- Sinatra, G. M., Heddy, B. C., & Lombardi, D. (2015). The challenges of defining and measuring student engagement in science. Educational Psychologist, 50(1), 1–13. https://doi.org/10.1080/00461520.2014.1002924
- Stewart, M., Stott, T., & Nuttall, A. M. (2011). Student engagement patterns over the duration of level 1 and level 3 geography modules: Influences on student attendance, performance and use of online resources. Journal of Geography in Higher Education, 35(1), 47–65. https://doi.org/10.1080/03098265.2010.498880
- UCISA (2018). 2018 Report on the technology enhanced learning survey. https://www.ucisa.ac.uk/bestpractice/surveys/tel/TEL_survey_report_2018
- Walker, R., Voce, J., Nicholls, J., Swift, E., Ahmed, J., & Horrigan, V. (2014). 2014 Survey of technology enhanced learning for higher education in the UK. https://www.ucisa.ac.uk/bestpractice/surveys/tel/TEL_survey_report_2018
- Williams, A., Birch, E., & Hancock, P. (2012). The impact of online lecture recordings on student performance. Australasian Journal of Educational Technology, 28(2), 199–213. https://doi.org/10.14742/ajet.869
- Worthington, D. L., & Levasseur, D. G. (2015). To provide or not to provide course PowerPoint slides? The impact of instructor-provided slides upon student attendance and performance. Computers & Education, 85, 14–22. https://doi.org/10.1016/j.compedu.2015.02.002
- Yeung, A., Raju, S., & Sharma, M. D. (2016). Online lecture recordings and lecture attendance: Investigating student preferences in a large first year psychology course. Journal of Learning Design, 9(1), 55–71. https://doi.org/10.5204/jld.v9i1.243