
 ?Mathematical formulae have been encoded as MathML and are displayed in this HTML version using MathJax in order to improve their display. Uncheck the box to turn MathJax off. This feature requires Javascript. Click on a formula to zoom.
Abstract
Prior research shows that increased distance and decreased light result in less correct eyewitness identifications, yet their combined effect is not well understood. The aim of the present study was to establish the maximum distance in low lux (lx) where an eyewitness’s later identification in target present (TP) line-ups is no longer reliable. We randomized participants (N = 178) into one of three lx conditions (high:300 lx, medium:10 lx, low:0.7 lx) and presented them with eight targets (one at a time) at eight separate distances (6–20 m). Each target-presentation was followed by an 8-person simultaneous TP line-up (i.e., there was a .125 probability of choosing the target correctly by chance). We found that the rate of correct TP identifications decreased with increased distance in all lx conditions. At 20 m the rate of correct TP identifications was .53 in the high lx condition, .41 in the medium lx condition and .11 in the low lx condition. The generalizability of our findings to overall eyewitness accuracy is limited by the exclusion of target absent line-ups, yet our findings show that reliable and correct target present identifications are very unlikely following observations made in low lighting (0.7 lx) at 20 m.
PUBLIC INTEREST STATEMENT
Little is known about the impact of both decreased light and increased distance on eyewitness accuracy, yet crimes often take place in low-light conditions and are seen by witnesses at varying distances. In the present study, we presented participants with live people in viewing conditions ranging from low to high lighting and short to long distances. In all cases, we used eyewitness line-ups where the observed person was present. We found that increased distance and decreased light had a dramatic negative effect on eyewitness line-up identification accuracy. By 20 m in starlight conditions, accuracy rates were at chance level. In other words, our findings indicate that there are upper limits to eyewitness accuracy due to sub-optimal viewing conditions. This has broad-reaching implications for the use of eyewitness identifications in courts of law.
Declaration of Interest
The authors certify that there are no competing interests.
1. Introduction
Eyewitness identifications are prevalent in legal contexts but unfortunately often erroneous, which can result in tragic negative consequences (e.g., Brewer & Wells, Citation2011; Cutler, Penrod, & Dexter, Citation1990; Nash, Hanczakowski, & Mazzoni, Citation2015). In order to investigate factors influencing identification outcomes, it is common to make a distinction between system and estimator variables (Wells, Citation1978). System variables are factors that can be influenced while questioning an eyewitness, such as, leading questions (Loftus, Citation1975) and line-up instructions (Clark, Citation2005; Steblay, Dysart, Fulero, & Lindsay, Citation2003). Estimator variables refer to aspects that ultimately cannot be influenced after the witnessed event; that is, they are part of the eyewitness-situation in which the observation took place. Examples are weapon focus (e.g., Fawcett, Russell, Peace, & Christie, Citation2011), own-race bias (e.g., Lampinen, Roush, Erickson, Moore, & Race, Citation2015; Meissner & Brigham, Citation2001), exposure time (e.g., Bornstein, Deffenbacher, Penrod, & McGorty, Citation2012), and witness confidence (e.g., Penrod & Cutler, Citation1995; Sporer, Penrod, Read, & Cutler, Citation1995; Wixted & Wells, Citation2017).
1.1. The effect of distance and lighting on perception and eyewitness identification
Two fundamental estimator variables that have hitherto received little scrutiny are distance and light. Previous research shows that with increased distance between an eyewitness and a target or culprit, there is a decrease in the accuracy of later eyewitness identifications (Lampinen, Erickson, Moore, & Hittson, Citation2014; Lindsay, Semmler, Weber, Brewer, & Lindsay, Citation2008; Loftus & Harley, Citation2005; Nyman, Lampinen, Antfolk, Korkman, & Santtila, Citation2018). It has also been found that with decreased lighting (i.e., lux: lx), there is a similar decrease in the accuracy of later eyewitness identifications (Jong, Wagenaar, Wolters, & Verstijnen, Citation2005; Wagenaar & Van Der Schrier, Citation1996). The negative impact of distance on identification accuracy is due to the fact that as distance increases the image projected on the retina becomes smaller, a fact that has been well established in psychophysics (Fechner, Citation1860; McCready, Citation1985). In psychophysics, the size of the image on the retina is calculated based on what is called the visual angle, which is a function of the size of the object and the distance from the eye to the object (e.g., Lu & Dosher, Citation2014). If an object, as for example, a face, that is constant in size, is moved further away from the eye, the visual angle and, consequently, the face-image projected on the retina decreases.
Importantly, when the retinal image decreases so does visual acuity. Visual acuity is the ability to discern details in what is being observed, for example, to be able to distinguish between two lines (e.g., Lu & Dosher, Citation2014). If two lines are presented at a large enough distance, they will no longer be perceived as two separate lines, but instead as only one line or even just a dot. Similarly, if a person is standing at, for example, 1000 m from an eyewitness then the visual angle will be small. This, in turn, will create a small image on the retina and, therefore, visual acuity will be very low, making it extraordinarily unlikely that anyone could distinguish a person’s facial features.
Visual acuity is also negatively affected by reduced lighting (e.g., Ferwerda, Citation1998). Ophthalmologists measure visual acuity on a Snellen chart at a standardized distance of 6.1 m. Normal vision is classed as 20/20 vision (i.e., normal vision at 20 ft), which refers to a person’s visual acuity being equal to the average person’s ability at this distance (e.g., Bailey & Lovie-Kitchin, Citation2013). It has been reported that when adjusting lighting conditions from daylight to starlight conditions, visual acuity drops to nearly 20/300 (Ferwerda, Citation1998; Shlaer, Citation1937), the latter describing a visual acuity that is below what is considered as being legally blind in the US (i.e., 20/200; Varma et al., Citation2016). In other words, brighter lighting (i.e., photopic) conditions are associated with high visual acuity and dim lighting (i.e., scotopic) conditions with low visual acuity (Hiraoka, Hoshi, Okamoto, Okamoto, & Oshika, Citation2015; Tidbury, Czanner, & Newsham, Citation2016; Zele & Cao, Citation2015). In eyewitness research, when using images of faces and not live targets it has also been found that increased light aids facial recognition and encoding (DiNardo & Rainey, Citation1991; Jong et al., Citation2005; Wagenaar & Van Der Schrier, Citation1996). These facts are highly relevant to the field of eyewitness research, because roughly 50% of crime takes place after 8 p.m. (i.e., either during intermediary lighting conditions or during the night; Felson & Poulsen, Citation2003).
A limitation of many earlier studies is that they have investigated the effects of simulated distance or simulated lighting on identification accuracy of photographs. Only a few studies have investigated the effects of actual distance using live targets (Lampinen et al., Citation2014; Lindsay et al., Citation2008; Nyman et al., Citation2018), illustrating that, as with simulated distance, actual distance negatively impacts eyewitness identification accuracy. However, to date, no published studies have investigated the effect of actual lighting conditions or the combined effect of both actual distance and light on identification accuracy using live targets. Moreover, no previous studies have investigated possible distance and illumination thresholds, after which identification accuracy is at chance level. Only one previous study has broached the subject of thresholds within the field of eyewitness research by investigating the maximum distance threshold of reliable eyewitness identification under optimal lighting conditions (Nyman et al., Citation2018).
The importance of investigating distance and illumination thresholds is that they can potentially expose conditions where the use of a line-up is unwarranted because the line-up can no longer provide any information gain (Wells & Lindsay, Citation1980; Wells & Olson, Citation2002). Naturally, this applies only in those cases where distance and lighting conditions can objectively be defined. Furthermore, investigating distance and lighting may prove useful in assessing the impact of other estimate variables, such as, weapon focus (Fawcett et al., Citation2011) on identification accuracy under sub-optimal conditions. Many earlier studies are also based on videotaped or photographed targets (in contrast to live targets), which limits their ecological validity and generalizability (see, e.g., Pozzulo, Crescini, & Panton, Citation2008). There is also a good reason to expect an interactive effect of distance and light on identification accuracy, considering the inverse-square law of physics that illustrates that when the distance between a light source and an object is doubled then the illumination of that object is reduced to approximately one quarter (e.g., Dunham, Citation2015).
1.2. Confidence and response times
An investigation of sub-optimal conditions (i.e., low light and long distance) also makes it possible to investigate the relationship between accuracy, confidence, and response time in sub-optimal conditions. This is relevant because some have argued that if best practice identifcation procedurs are used and no feedback is given to the witness, then high confidence identifications will tend to be accurate, even if witnessing conditions (i.e., estimator variables) are poor (Brewer & Wells, Citation2006; Sauerland, Sagana, Sporer, & Wixted, Citation2018; Sauerland & Sporer, Citation2009; Semmler, Dunn, Mickes, & Wixted, Citation2018; Sporer, Citation1993; Weber, Brewer, Wells, Semmler, & Keast, Citation2004; Wixted & Wells, Citation2017). It has also been suggested that response times below 10–12 s are associated with accuracy (Dunning & Perretta, Citation2002), but it has also been found that there is a large degree of variation so is not possible to draw a clear boundary that discriminates between accurate or inaccurate decisions (Sauer, Brewer, & Wells, Citation2008; Weber et al., Citation2004).
1.3. The present study
The present study was designed to investigate the combined effect of lighting and distance on eyewitness target identifications (i.e., correct identification rate), and to establish an upper distance threshold in low lx conditions. With these aims in mind, we created a setup consisting of 3-lx conditions (low (0.7 lx) = starlight, medium (10 lx) = twilight, high (300 lx) = office space) and eight distances (6, 8, 10, 12, 14, 16, 18, and 20 m). During the experiment, we presented eight live targets, one at each distance, for 20–30 s and asked participants to identify the observed person from a target present eight-person simultaneous line-up. In other words, we employed an identification task (Duncan, Citation2006) where there was no option to reject the line-up. We measured response times and the level of confidence after each identification task.
The identification task (or multiple-choice task) that we employed differs from a response task where there are both target present and absent line-ups (regarding the identification task see e.g., Duncan, Citation2006). In eyewitness research, it is a common practice to use a decision task, where both target present and target absent line-ups are used in order to assess diagnostic accuracy or diagnosticity based on signal detection theory (e.g., Clark, Benjamin, Wixted, Mickes, & Gronlund, Citation2015; Clark & Godfrey, Citation2009). Diagnosticity denotes the likelihood that an identified person (from a line-up) is the actual person that was observed (Wells & Lindsay, Citation1980). In comparison with the decision task, the identification task has a lower ecological validity and generalizability (e.g., Duncan, Citation2006). However, we considered an identification task an adequate first step (considering the lack of earlier research) to investigate the combined effect of distance and light on correct identification rates.
The main hypotheses were that there would be negative main effects of both increased distance and decreased lighting on the rate of correct identifications. We hypothesized that the combined effect of low lighting and long distance would create an additive effect where the likelihood of choosing the right target would fall to chance level before 20 m in the low lighting condition. We also hypothesized that higher distance and lower lighting (i.e., sub-optimal conditions) would result in either a downshifting of confidence or a reduction in the confidence-accuracy relationship and that response times would become longer, and that variation would increase.
2. Method
2.1. Participants
One hundred and eighty-two university students/staff participated in the current study. Four participants were removed from the dataset due to problems with connectivity of the response tablets; n = 2) and previous participation (n = 2). The final dataset consisted of 178 participants. Of these, 129 participants (72%) identified themselves as women, 47 (26%) as men, one as “other”, and one left the choice blank. The mean age of participants was 24.5 years (SD = 6.4) and the ages ranged from 19 to 51. Furthermore, 158 participants (88%) reported their nationality as Finnish and 21 (12%) reported their nationality as “other”.
Participants were recruited through email, in person, or via pamphlets placed around the university campus. During recruitment, we informed potential participants of the possibility of receiving feedback at the end of the experiment regarding the number of correct or incorrect identifications they made. Participants also received a free lunch at the university canteen as compensation for their participation.
2.2. Ethics statement
The Ethical Committee of the Departments of Psychology and Logopedics at Åbo Akademi University has approved the current study, including all aspects of the data and photograph collection.
2.3. Stimuli
2.3.1. Fillers
To create line-ups for the experiment, we collected a database of filler photographs. Fillers were recruited, photographed, and filmed in person at multiple university locations. Fillers read and signed an informed consent form describing how the collected material would be used. Fillers were then asked to don a white t-shirt, to remove any jewelry, loosen their hair if it was long, and let it rest behind their shoulders. Photos were taken with the filler having a neutral expression and facing the camera, facing left (without moving their shoulders), facing right (without moving their shoulders), and facing the camera once more. Each of the three head positions were photographed at least two times and the entire sequence was also recorded as a video clip. The fillers received a lunch coupon for their participation.
2.3.2. Targets
All target individuals (targets) were recruited via email from a nearby university. We chose to recruit targets from another university in order to minimize the chance that study participants would be familiar with the targets. We only recruited ethnic Finns as targets. In our recruitment email, we explained that the targets should not have a beard or other distinctive facial features (e.g., facial piercings, very colorful hair), should be of average height and weight, and should be approximately 20–30 years old. Targets had to commit to full days of work (i.e., 6–8 h) for a number of days spread over two months. They also had to permit us to use their photographs in the experiment. In compensation for their participation, each target was paid an hourly salary. All targets read and signed informed consent forms prior to taking part in the experiment. The recruited targets used in the current setup were four female and four male undergraduate or PhD students, with a mean age of 22.9 (SD = 3.7) ranging from 19 to 30 years.
2.3.3. Line-ups
To create adequate photograph line-ups, each target was photographed using the same-standardized process as during the filler data collection. Photographs of all eight targets were then presented to nine test participants who were instructed to provide, in writing, a brief description of each target as if they were describing their appearance to a police officer. To create composite target descriptions, the first author constructed a list of features for each target based on the descriptions provided by the nine test subjects. The included features were gender, age, hair, skin, mouth, face, nose, ears, and eyes. Using these lists, the first author chose five fillers that matched the target as closely as possible. A six-person line-up was created for each target and these were then presented to eight new test participants who were asked to choose the person they thought best fitted the target description (no time limit). A Pearson’s chi-square test of the images selected revealed that one target and one filler were chosen above chance level. We, therefore, decided to add two more fillers to all line-ups (chosen by the first author). This resulted in line-ups comprising of eight photographs.
Additionally, to assess the fairness of the line-ups, we conducted a post-hoc test, where participants (n = 49, Mean age = 23.3, SD = 5.5, 29 females, 19 males, 1 “other”) were asked to select the photograph that best fit the same descriptions as during the pre-test line-up evaluation. The functional sizes and the results from the multiple Chi-Square tests are reported in Table . Our analyses revealed that five of the line-ups were unfairly biased towards the target, two were biased towards one of the fillers, and one was not biased (see Table ). There are four reasons the results from the post-test line-up evaluation might not be of a great concern for the current study: 1) the post-test line-up included no time limit and the details included many features (such as eye color) that were not actually observable for the experimental participants due to the distance and lighting conditions making the post-test not applicable to them. 2) There was no significant correlation between correct/incorrect identifications (i.e., the response variable) and the functional sizes of each target line-up (see Table ). 3) The targets were included as random factors in the multi-level analysis, which means that the differences in line-up fairness were part of the statistical model used. 4) The post-test evaluation revealed that some of the line-ups were biased towards the target, making the task easier for the participants. This indicates that the results may underestimate the negative effects of distance and light on the rate of correct identifications.
Table 1. Distribution of images selected during the post-test evaluation of target line-ups by target
Table 2. Frequencies of target and filler identifications by confidence groups and distance
2.4. Materials
2.4.1. Lighting materials and setup
For the manipulation of lighting in our experimental setup, we used a lux-meter and moveable lights and stands. The lux-meter used was a Trotec Lux-meter (BF06), and we used 3-lx conditions: 0.7 lx (accuracy of the Lux-meter: ± 0.035), 10 lx (± 0.5) and 300 lx (± 15), defined as the amount of lx that reached the face of a target. The lights were two Aputure Amaran (AL-528C Bi-Color LED-Lights). The color temperature used was 5500 K, which is white light and approximates daylight conditions equivalent to outdoor sunlight.
The space used for the experiment was a windowless corridor that was approximately 22 m long and 2-m wide, where all other lights were switched off. The light produced from the handheld tablets was reduced to 20% to minimize the contrast effect that could arise after viewing a target in the two lower lx conditions (i.e., the 0.7 lx and the 10 lx conditions). Lx conditions were held constant during a full day of testing, with the two last days as the only exceptions. These were split into two separate lx conditions to even out the number of participants tested in each lx condition.
2.5. Measures
2.5.1. Informed consent and demographic questions
We collected participants’ age, occupation, nationality, and the nationality of people with whom they had grown up. We also asked a question regarding previous participation in the experiment or stimuli evaluation, to ensure that participants had not seen the targets previously.
2.5.2. Visual acuity test
Prior to the experiment, we administered a visual acuity test to all participants. We used a self-monitoring visual acuity test that is freely available through the Google applications store (healthcare4mobileFootnote1) and has been used in previous research (e.g., Hwang & Peli, Citation2016; Motti, Vigouroux, & Gorce, Citation2015). We installed the application on the tablets and administered it by holding the tablets at arm’s length from the participants at eye level. The visual acuity test begins with asking the participant to close their right eye and then displays a letter (we chose to use the letter “C”) as a visual image. The letter C was shown on the screen page for approximately 3 s and after it disappeared, it was followed by a screen page containing four images of the letter C; all with the C-opening in different directions. Participants were instructed to choose, among the four images, the C-letter that corresponded to the preceding image. The size of the C-letter varied depending on the response of the participant (i.e., became smaller if preceded by a correct answer and larger if preceded by an incorrect answer). The test consisted of 10 question-rounds, after which the application would move on to test the other eye. The net result was a percentage of visual acuity for each eye.
2.5.3. Tablet software structure and included measures
All line-ups were entered into the software OpenSesame (Mathôt, Schreij, & Theeuwes, Citation2012) that was run on Lenovo Tab 2 android tablets during the experiment. All photographs in each line-up were displayed simultaneously on one page in two rows and four columns. Photograph positions were randomized for each trial. All line-ups were simultaneous, target present line-ups. After each line-up decision, the following questions were asked: 1) “How certain are you of your choice” (Alternatives: 0–100; 10-point increments), 2) “At what distance was the target relative to you?” (Alternatives: 1–26 m; 2-m increments), 3) “How old was the person you identified” (Alternatives: free text), 4) “Did you recognize the photograph of the person you selected from outside of this experiment?” (Alternatives: yes or no), 5) “Did you recognize any of the other photographs from outside of this experiment?” (Alternatives: yes or no). All line-up choices (i.e., photographs selected), including response times, were recorded on the tablet.
2.6. Procedure
Before taking part in the experiment, participants read and signed an informed consent including a full description of the experiment. After this, they answered demographic questions followed by the visual acuity test. Participants then completed a test round. The instructor then explained that there would be eight trials in the experiment. In each trial, a live target would be presented for approximately 20–30 s in the corridor. It was made clear that each target would always be presented in the exact same position at the other end of the corridor and that before each round the instructor would guide the participants to a new position, and that participants would be presented with a line-up and follow-up questions after each target presentation. If there were two participants in the same session, the test instructor asked both participants to turn and face in opposite directions before continuing. This was to ensure that the participants would not influence the other’s choice. Distance positions were counterbalanced to ensure that the order of distances and the order of targets presented were equal between participants. However, due to the complexity of the design, we were only able to achieve a counterbalancing of the number of observations per distances and per lx condition. We were not able to counterbalance the number of targets at each distance, meaning that the targets were presented the same number of times and in the same positions when comparing between lx conditions, but unequally balanced when comparing distance positions within the lx conditions. This was taken into account by using targets as a random intercept in the statistical model. Participants were asked to select the line-up photograph that best matched the live target they had just seen and, if uncertain, to make their best guess and report their level of confidence after each identification. Participants were not given the option to reject the line-up.
Throughout the experiment, the test instructor used a walkie-talkie in order to instruct the targets when to present themselves. Prior to each target entering the corridor, the test instructor asked participants to look straight down and once the target was in place to look up. The targets had been instructed to look straight towards the participant with a neutral expression and count silently to five, then turn their head to the left and count to five, then turn their head to the right and count to five, before finally looking straight towards the participant and count to five. The target then left the corridor.
2.7. Design
We employed a three by eight mixed design, with 3-lx conditions (between subject) and eight distances (within subject). The outcome variables were target identification, confidence, and response time. We also registered answers regarding distance estimates, age estimates of targets and recognition of any line-up photograph prior to the experiment.
3. Statistical analyses
Analyses were conducted using the R platform (R Core Team, Citation2016). The main analyses were conducted by fitting data as a multi-level regression in the lme4 package (Bates, Mächler, Bolker, & Walker, Citation2014). Figures were created using the sjplot and ggplot packages (Wickham, Citation2016;Lüdecke, Citation2019). For these analyses the following general formula, which fits random intercepts for participants and for targets, was used:
As a default, categorical variables are contrast coded in lme4, with the level with the lowest alphanumerical value as the reference group. The binary logistic regression analysis produces log odds values (see e.g., Sommet & Morselli, Citation2017). The log odds values can be used to calculate the probability of a response being 1 (i.e., a correct identification) using the probit function (exp(x)/(1+ exp(x)), where x is the log odds estimate of interest.
To also obtain ANOVA-type main effects, we used the afex package (Singmann, Bolker, & Westfall, Citation2019). To obtain p-values in the multi-level environment, we used the likelihood-ratio test (LRT), which produces a χ2-statistic. All tests were based on Type-III sums of squares. For Tukey post-hoc comparisons between levels, we used the multcomp package (Hothorn, Bretz, & Westfall, Citation2008).
3.1. Distance and light
For correct/incorrect responses, we used a multilevel binary logistic regression model. Lighting was treated as a categorical variable with three levels (low, medium, and high lx) and distance was treated as a continuous variable.
3.2. Confidence and response time
To investigate the effects of confidence under of sub-optimal conditions, we redefined confidence into two categories, low (0–80%) and high confidence (81–100%). This was done because it has been shown that high confidence is strongly associated with accuracy (for an overview see Wixted & Wells, Citation2017) and we were explicitly interested in the postdictive value of high confidence in optimal versus sub-optimal conditions. High confidence is often defined as 90–100% confidence (e.g., Wixted & Wells, Citation2017), but in the present study, we chose a more liberal definiton (i.e., 81–100%) due to our study including suboptimal viewing conditions which we expected to result in overall lower confidence levels.
We then ran a multilevel analysis where the two confidence groups and the 3-lx conditions were categorical predictors and the rate of correct identifications was the outcome variable. We also re-categorized the eight distances into two groups, short distance (6–12 m; optimal) and long distance (14–20 m; sub-optimal) to investigate the difference between optimal and sub-optimal conditions. We then ran a multilevel binary logistic regression analysis with the two confidence groups and the two distance groups as predictors and the rate of correct identifications was the outcome variable. Because our categorization of both confidence and distance into two groups was to some extent arbitrary, we have also included additional analysis where we treated confidence and distance as a continuous variable. This resulted in a multilevel binary logistic regression where confidence and distance were continuous predictors, the light was a categorical predictor, and correct/incorrect identification was the binary outcome variable.
To examine differences between response times in sub-optimal conditions, while at the same time producing results that would be comparable to previous research (Dunning & Perretta, Citation2002; Sauer et al., Citation2008; Weber et al., Citation2004), response time was categorized into three groups, 0–10 s, 11–15 s, and >15 s. Some authors suggest that the high variability of response times makes it impossible to define cut-offs associated with accuracy or inaccuracy (Sauer et al., Citation2008; Weber et al., Citation2004). However, some earlier results suggest that response times under 10–12 s are associated with higher accuracy (Dunning & Perretta, Citation2002). Our rationale for categorizing response time into three categories prior to analyses, was to investigate specifically the possibility of there being cut-offs below, around, and above 10–12 s.
We then ran two multilevel analyses, one with the new response time groups and light (low, medium, and high lx) as the predictors, the other with the new response time groups and the two new distance groups (6–12 m and 14–20). In both cases, the outcome variable was the rate of correct identifications. As with confidence, we have also included an additional analysis where we treated response time and distance as continuous variables.
4. Results
4.1. Descriptive results
The average results of the visual acuity test for the left eye was 86.0% (SD = 22.7), for the right eye 87.6% (SD = 19.8), the combined average for both eyes was 87.0% (SD = 17.2), the minimum was 79.8% (SD = 24.7), and the maximum was 94.2% (SD = 13.2). The mean age estimate was 23.5 years (SD = 2.9) and mean distance estimate was 13.2 m (SD = 6.0).
The 178 participants provided 1424 identifications. We excluded observations where participants reported being familiar with a photograph in a line-up. This resulted in the exclusion of 106 observations, leaving 1318 observations across 178 participants. Of the 1318 identifications, 741 (56%) were correct and 577 (44%) were incorrect. In the high lx condition (300 lx) there were 316 correct (76%) and 98 incorrect (24%), in the medium lx condition (10 lx) there were 248 correct (60%) and 163 incorrect (40%), and in the low lx condition (0.7 lx) there were 177 correct (36%) and 316 incorrect (64%) identifications. The average level of confidence was 57.8 (SD = 29.3). In the high lx condition, the average confidence was 71.0 (SD = 27.4), in the medium lx condition it was 64.6 (SD = 25.4), and in the low lx condition it was 41.1 (SD = 25.6). See Table for the frequencies of correct or incorrect identifications per confidence group, lx condition, and distance. The average response time was 16.2 s (SD = 8.5), in the high lx condition it was 14.9 s (SD = 8.2), in the medium lx condition it was 14.7 s (SD = 6.8), and in the low lx condition it was 18.6 (SD = 9.4). See Table for the actual-observed frequencies of correct or incorrect identifications per response time group, lx condition, and distance.
Table 3. Frequencies of target and filler identifications by response time groups and distance
Prior to the main analyses, we computed a correlation matrix for the following outcome variables: Identification, response time, confidence, lx, distance, target presentation order, and the participant measures of visual acuity for the left eye, the right eye, the average, and the minimum and the maximum visual acuity outcomes (see Table ). There was a significant positive correlation between the outcome variable response and confidence and lx. There was a significant negative correlation between the outcome variable and response time and distance. There was also a significant positive correlation between the response variable and the average and the maximum results from the visual acuity test (see Table ). However, the correlations were weak, indicating that visual acuity was not important to include in the subsequent analysis. By using participants as a random intercept in the regression models, we accounted for individual base-line differences in eyesight. There was no significant correlation between target presentation order and the outcome variable.
Table 4. Correlations between the outcome variable and the predictor variables
4.2. The effects of distance and lighting on the rate of correct identifications
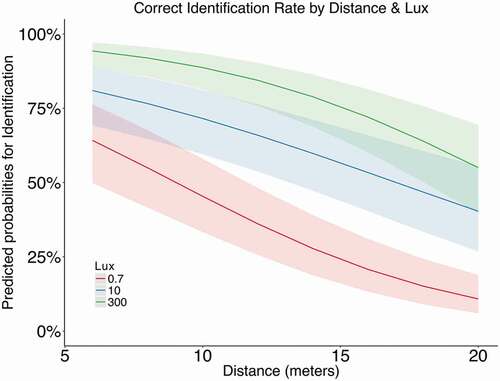
We then analyzed the effect of distance and lighting on correct identifications through a multilevel binary logistic regression. The results are presented in Table and Figure . There was a significant main effect of lx condition (χ2 (2) = 16.49, p < .001). A pairwise Tukey posthoc test for lx conditions revealed that there was a significant difference between the high and medium lx conditions (B = 1.69, SE= 0.58, p < .05), between the high and low lx conditions (B = 2.18, SE = 0.56, p < .001), but no significant difference between the medium and low lx conditions (B = 0.50, SE = 0.50, p > .05). There was also a significant effect of distance (χ2 (1) = 58.16, p < .001) but no interaction between lighting condition and distance on the rate of correct identifications (χ2 (2) = 3.43, p > .05). The results from the logistic regression showed that the likelihood of a correct identification in the high lx condition at 6 m was .94 and at 20 m it was .55, the likelihood of a correct identification in the medium lx at 6 m was .81 and at 20 m it was .40, and the likelihood of a correct identification in the low lx condition at 6 m was .64 and at 20 m it was .11 (see Table and Figure ).
Table 5. Correct identification rate by distance and lux
Figure 1. Correct Identification Rate = rate of correct target identifications; Lux = the lighting conditions manipulated during the experimental setup (low = 0.7 lx, medium = 10 lx, high = 300 lx). Distance = Distances used in the experimental setup (i.e., eight distances between 6 and 20 meters). The figure illustrates the predicted probability values for correct identifications by distance and by lx conditions with 95% confidence intervals of the predicted probability curves.
4.3. Confidence as a postdictive measure of the rate of correct identifications
Next, we analyzed the postdictive value of confidence on accuracy by using two multilevel binary logistic regressions. In the first analysis, lighting and confidence were used as predictors of the rate of correct identifications. The results are presented in Table and Figure . There was a significant main effect of lighting on the rate of correct identifications (χ2 (2) = 49.00, p < .001), showing the same effects of lighting on accuracy as in the main analysis. There was a main effect of confidence on the rate of correct identifications (χ2 (1) = 21.25, p < .001). A pairwise Tukey post-hoc test revealed that performance was better at high (vs. low) confidence (B = 2.23, SE = 0.54, p < .001). There was no interactive effect of lighting and confidence on the rate of correct identifications (χ2 (2) = 2.95, p > .05). In the second analysis, we used distance and confidence as predictors of the rate of correct identifications. The results are presented in Table and Figure . We found a significant main effect of distance (χ2 (1) = 33.62, p < .001), which also followed the same pattern as in the main analysis. We also found a main effect of confidence on the rate of correct identifications (χ2 (1) = 73.53, p < .001), where a post-hoc (Tukey) test revealed that the rate of correct identifications was better in the high (vs. low) confidence group (B = 2.27, SE = 0.30, p < .001). There was no interaction between distance and confidence on the rate of correct identifications (χ2 (1) = 0.14, p > .05). Lastly, we ran a complete model with distance and confidence as continuous predictors and light as a categorical predictor. As can be seen in Table there was a main effect of confidence, which supports our initial finding.
Table 6. Correct identification rate by confidence and lux
Table 7. Correct identification rate by confidence and distance
Table 8. Correct identification rate by confidence, light, and distance
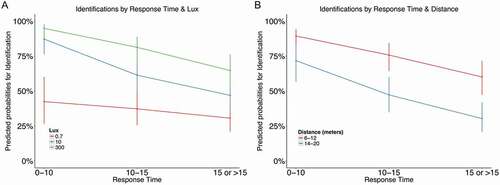
Figure 2. Identifications = correct target identifications; Lux = the lighting conditions manipulated during the experimental setup (low = 0.7 lx, medium = 10 lx, high = 300 lx). Confidence = Post-identification measure of participant confidence regarding the identification they made (confidence was measured between 0% and 100% and for the current analysis confidence was re-categorized into two groups: low confidence = 0–80% and high confidence = 81–100%); Distance = Distances used in the experimental setup (eight distances between 6 and 20 mwere used, but in the current analysis the distances were split into short distances = 6–12 m and long distances = 14–20 m). Panel A: the predicted probabilities (with 95% confidence intervals) for correct identifications by two confidence groups (low = 0–80% and high = 81–100%) and three conditions of lux (red line = 0.7 lx; blue line = 10 lx, green line = 300 lx), with 95% confidence intervals of the predicted probabilities. Panel B: the predicted probabilities (with 95% confidence intervals) for correct identifications by two confidence groups (low = 0–80% and high = 81–100%) and two distance groups (red line = 6–12 m; blue line = 14–20 m).

The results illustrate that high confidence is positively associated with higher accuracy, which appears to hold true in all three lighting condition as well as in shorter and longer distance conditions.
4.4. Response time as a postdictive measure of the rate of correct identifications
Next, we analyzed the postdictive value of response time on the rate of correct identifications by using two multilevel binary logistic regressions. We first analyzed the rate of correct identifications with lighting and response time as predictors. The results are presented in Table and Figure . There was a significant main effect of lighting (χ2 (2) = 51.83, p < .001), which followed the same pattern as the main analysis. There was no significant effect of response time (χ2 (2) = 3.08, p > .05). However, there was a significant interaction between response time and lighting on the rate of correct identifications (χ2 (4) = 15.17, p < .01), indicating that shorter response times are more indicative of higher accuracy when lighting is good (i.e., both the medium and high lx conditions) compared with low lighting (i.e., the low lx condition).
Table 9. Correct identification rate by response time and lux
Figure 3. Identifications = correct target identifications; Lux = the lighting conditions manipulated during the experimental setup (low = 0.7 lx, medium = 10 lx, high = 300 lx); Response time = Line-up response time that has been re-categorized into three groups (low = 0–10 s, medium = 11–15 s, high = > 15 s); Distance = Distances used in the experimental setup (eight distances between 6 and 20 m were used, but in the current analysis the distances were split into short distances = 6–12 m and long distances = 14–20 m). Panel A: the predicted probabilities (with 95% confidence intervals) for correct identifications by three response time groups (low = 0–10 s, medium = 11–15 s, high = > 15 s); and three conditions of lux (red line = 0.7 lx; blue line = 10 lx, green line = 300 lx), with 95% confidence intervals of the predicted probabilities. Panel B: the predicted probabilities (with 95% confidence intervals) for correct identifications three response time groups (low = 0–10 s, medium = 11–15 s, high = > 15 s) and two distance groups (red line = 6–12 m; blue line = 14–20 m.
In the second analysis, we used distance and response time as predictors of the rate of correct identifications. The results are presented in Table and Figure . Once again, there was a main effect of distance on the rate of correct identifications (χ2 (1) = 10.71, p < .01), mirroring the negative impact of higher distance found in the main analysis. There was also a main effect of response time on the rate of correct identifications (χ2 (2) = 38.19, p < .001). A pairwise Tukey post-hoc test revealed that longer response times were significantly less postdictive of high accuracy compared with medium response times (B = −0.73, SE = 0.24, p < .01). This was also true of long response times compared with short response times (B = −1.73, SE = 0.30, p < .001), and medium response times compared with short response times (B = −1.00, SE = 0.31, p < .01). There was no interactive effect between distance and response time on the rate of correct identifications (χ2 (2) = 0.01, p > .05). Lastly, we ran a complete model with distance and response time as continuous predictors and light as a categorical predictor. The results are presented in Table , where it can be seen that there was a main effect of response time but no interactive effects, which supports our initial findings.
Table 10. Correct identification rate by response time and distance
Table 11. Correct identification rate by the response time, light, and distance
The results illustrate that shorter response times were more strongly associated with the rate of correct identifications when lighting is good, and distances are shorter. In other words, the relationship between shorter response times and the rate of correct identifications appears to be dependent on the optimality of the viewing conditions. Shorter response times result in higher accuracy when viewing conditions are favorable.
5. Discussion
The current study was designed to investigate the combined effect of distance and lighting on an identification task in a live eyewitness identification paradigm. Our aim was to investigate the effect sub-optimal conditions (i.e. poorer lighting and increased distance) have on line-up choices. This is the first attempt at understanding how distance and light interactively affect eyewitness identifications of live targets. Our hypotheses and assumptions were based on earlier eyewitness research showing that lower lighting and increased distance negatively impact eyewitness accuracy (Jong et al., Citation2005; Lampinen et al., Citation2014; Lindsay et al., Citation2008; Loftus & Harley, Citation2005; Wagenaar & Van Der Schrier, Citation1996; Nyman et al., Citation2018). We also based our assumptions on earlier research concerning visual acuity (DiNardo & Rainey, Citation1991; Ferwerda, Citation1998; Hiraoka et al., Citation2015; Lu & Dosher, Citation2014; McCready, Citation1985; Tidbury et al., Citation2016; Zele & Cao, Citation2015).
5.1. Distance and lighting thresholds for reliable target identifications
Our data collection and subsequent analyses revealed that low lighting and increased distance have a dramatically negative impact on the rate of correct identifications. The results are the first indication that in low lighting conditions (i.e., 0.7 lux and comparable to starlight conditions) a likely upper distance threshold of reliable eyewitness identification is at 20 meters. Moreover, these findings were produced using an immediate recall task and a relatively long exposure time (i.e., 20–30 s), circumstances that are optimal compared to those likely in real-life situations. This implies that in a real-life scenario with a longer delay between witnessing a culprit and line-up presentation, the distance threshold is likely to be lower. Due to the somewhat unfair line-ups, which were to a large extent biased towards the targets, it is also possible that the current results are too conservative and that if the line-ups had not been biased, the task would have been more difficult and the upper distance threshold would have been found at a shorter distance.
5.2. Confidence and response times
Previous research indicates that there is an association between high confidence and identification accuracy (for an overview see, Wixted & Wells, Citation2017), and although some results suggest that the relationship will be negatively impacted by sub-optimal conditions (Deffenbacher, Citation2008), other suggest this not to be the case (Clark et al., Citation2015; Palmer, Brewer, Weber, & Nagesh, Citation2013; Semmler et al., Citation2018; Sporer et al., Citation1995; Wixted & Wells, Citation2017). The latter viewpoint is based on the notion that the relationship between confidence and accuracy will not deteriorate depending on external factors, assuming that the investigation is conducted under pristine conditions, but that sub-optimal conditions will naturally entail a lower average of confidence. In the present study, we found that average confidence was lower when lighting conditions were lower and when distance was longer. This meant that there was a lower frequency of high confidence correct identifications in the extreme end of the sub-optimal conditions (i.e., low light and long distance). Our analyses regarding the relationship between confidence and the rate of correct identifications revealed that there was a positive association in all conditions between high confidence and accuracy. The results indicate that participants modulated their level of confidence downwards under sub-optimal conditions and that high confidence appears to be associated with the rate of correct identifications even under sub-optimal conditions. With that said, we did find a number of incorrect high confidence identifications in all lighting conditions, indicating that there perhaps is a reason to question the extent to which confidence can be used as an indicator of the rate of correct identifications. Moreover, because we did not include a target absent condition and a designated innocent filler, we could not investigate the relationship between confidence and accuracy through a confidence-accuracy characteristic analysis (CAC; Mickes, Citation2015), which is arguably needed in order to make any definitive conclusions regarding the confidence-accuracy association under sub-optimal conditions.
There is also an ongoing debate regarding the postdictive value of line-up response times as of eyewitness identification accuracy. Some results have indicated that shorter response times (i.e. 10–12 s) are associated with identification accuracy (Dunning & Perretta, Citation2002) and other results have suggested that response times cannot discriminate between accurate or inaccurate decisions (Sauer et al., Citation2008; Weber et al., Citation2004). In the present study, response times were longest in the low lighting conditions and at the longest distances. The statistical analyses revealed that shorter response times were indicative of the rate of correct identifications in optimal conditions (i.e., higher lighting and shorter distance). This is an interesting addition to previous findings concerning the association between line-up response time and the rate of correct identifications, because it suggests that the postdictive value of response times may be contingent on the optimality of external viewing conditions. However, these results should be viewed as only preliminary findings and there is still a need to investigate the effects of distance and light on identification accuracy using both target present and absent line-ups, which would yield results more directly applicable to real-life settings.
5.3. Study implications
To the authors’ knowledge, the results presented in this paper are the first to illustrate the combined effect of real lighting and distance conditions, using live targets and an eyewitness identification task. These results are, therefore, directly generalizable to real-life events due to the fact that we used live targets and not simulated events, something that has been questioned in previous research (e.g., Pozzulo et al., Citation2008). Our results are also in line with earlier works, both simulated and actual, indicating that both lighting and distance are highly relevant factors in eyewitness research. Furthermore, we found that in the lowest lx condition and at the largest distance, accuracy fell to chance level, which we have defined as a distance threshold because accuracy was the same as blindly guessing. An important next step for future research is to investigate similar sub-optimal conditions using a decision task, in order to assess the diagnostic value of line-ups depending on the lighting and distances used. If line-ups in similar sub-optimal conditions (i.e., 20 meters in 0.7 lx lighting) give rise to a diagnostic value of 1 then there is no longer any information gained by using a line-ups in these conditions, rendering them useless from a judicial perspective (see Wells & Lindsay, Citation1980; Wells & Olson, Citation2002).
Nevertheless, the threshold established in the present study, illustrates the negative impact that distance and light can have on eyewitness accuracy. The significance of this is that it implies that other estimator variables could be affected to a high degree, as for example, in the case of weapon focus (Fawcett et al., Citation2011). It is highly probable that lighting and distance will play a role in the weapon focus effect, due to the combined effect these variables have on perception and attention. Therefore, the current results also indicate that it might be time to re-evaluate and systematically investigate the effect of other estimator variables after there has been an adequate investigation of different lighting and distance conditions on eyewitness accuracy. After all, if the results by Felson and Poulsen (Citation2003) still hold true, then approximately 50% of all crimes takes place in low lighting conditions. Moreover, information appears to be completely lacking regarding the distances between witnesses and culprits at varying crime scenes, yet it is not illogical to assume that there is a great variation between and within different types of crimes.
5.4. Limitations
The current study has a number of limitations. First, due to the complexity of our design (i.e., manipulating 3-lx conditions and eight distance conditions), and due to practical limitations, we opted to use an identification task and not a decision task (Duncan, Citation2006). Due to the absence of target absent line-ups, we were not able to assess the effect of distance and lighting on filler selection or the selection of a designated innocent in target-absent line-ups. This assessment would have enabled the calculation of diagnosticity (Wells & Lindsay, Citation1980). In other words, there is a limitation in the generalizability of the current results to real-life eyewitness conditions. The current results are, therefore, best interpreted as a first step in understanding how distance and lighting impact target selection only.
Secondly, the post-test revealed that only one line-up was unbiased, whereas two were biased towards fillers and five were biased towards the targets. This is a clear limitation. However, the post-test evaluation differed from the main experiment because evaluators were able to disregard line-up images due to, for example, the images not matching the eye color of the target description, a feature that was not relevant in the main experiment due to the distance to the targets. We, therefore, ran a correlation between the functional sizes of the line-ups and the outcome variables and found no significant correlations. Targets were also included as random factors in the statistical analyses. Nevertheless, assuming the line-ups were, as the post-test suggests, biased towards the targets, then this impacts the generalizability of the present results. This implies that the task was, in fact, easier than we wished it to be and implies that the observed accuracy levels are inflated. In other words, our results may be too conservative, and it could be that accuracy would have been lower at shorter distances if the line-ups had been less biased. This last point also relates to visual acuity, in that it suggests that external features, such as hairstyle, might have played a larger role in the identification of the targets rather than the minutiae of the facial identity.
5.5. Conclusions
Taking into account the limitations of the current design, we argue that the results represent an important first step in investigating the combined effect of lighting and distance on the rate of correct identifications in a realistic scenario. Furthermore, the novel finding of the current design is that the rate of correct identifications fell to chance level at 20 m in the 0.7 lx condition. These findings indicate that external factors such as lighting and distance are highly relevant in any investigation that utilizes a line-up identification task. Our results also illustrate that there is a clear need of additional research concerning distance and light as well as their interaction with other estimator variables. Based on our findings, we recommend that when lighting conditions are below 1 lx and the distance is 20 m or more, target identifications should be treated with the greatest of caution.
Acknowledgements
We wish to thank the undergraduate students who helped with the data collection, the photographs collection, and the double-checking of the data. These are Jenny Skrifvars, Emily von Julin, Lina Ahlgren, and Veronica Sui.
The underlying research materials for this article can be accessed at the Open Science Framework [https://osf.io/wnrhb/]
Additional information
Funding
Notes on contributors
Jan Antfolk
The authors of the current manuscript are collaborating in a project titled “Beyond Reasonable Doubt: Establishing Thresholds for Reliable Eyewitness Identification Evidence”, which has been funded by the Academy of Finland (2016-2019). Adjunct Professor Julia Korkman (Åbo Akademi University: ÅAU) is PI of the project and the other members of the research team include: Professor Pekka Santtila (NYU Shanghai), Professor James Michael Lampinen (University of Arkansas, USA), Assistant Professor Jan Antfolk (ÅAU), and PhD candidate Thomas J. Nyman (ÅAU).
The main aim of our project is to use ecological designs (i.e., live targets and real-life settings) in order to investigate (and establish) the limits of eyewitness accuracy and reliability. More specifically, we are interested in the limits of accuracy set by sub-optimal viewing conditions (i.e., increased distance and decreased lighting). The present manuscript is an integral part of our overarching goal.
Notes
Related Research Data
References
- Bailey, I. L., & Lovie-Kitchin, J. E. (2013). Visual acuity testing. From the laboratory to the clinic. Vision Research, 90, 2–23. doi:10.1016/j.visres.2013.05.004
- Bates, D., Mächler, M., Bolker, B., & Walker, S. (2014). Fitting linear mixed-effects models using lme4. 67(1). doi:10.18637/jss.v067.i01
- Bornstein, B. H., Deffenbacher, K. A., Penrod, S. D., & McGorty, E. K. (2012). Effects of exposure time and cognitive operations on facial identification accuracy: A meta-analysis of two variables associated with initial memory strength. Psychology, Crime & Law, 18(5), 473–490. doi:10.1080/1068316X.2010.508458
- Brewer, N., & Wells, G. L. (2006). The confidence-accuracy relationship in eyewitness identification: Effects of lineup instructions, filler similarity, and target-absent base rates. Journal of Experimental Psychology. Applied, 12(1), 11–30. doi:10.1037/1076-898X.12.1.11
- Brewer, N., & Wells, G. L. (2011). Eyewitness identification. Current Directions in Psychological Science, 20(1), 24–27. doi:10.1177/0963721410389169
- Clark, S. E. (2005). A re-examination of the effects of biased lineup instructions in eyewitness identification. Law and Human Behavior, 29, 575–604. doi:10.1007/s10979-005-7121-1
- Clark, S. E., Benjamin, A. S., Wixted, J. T., Mickes, L., & Gronlund, S. D. (2015). Eyewitness identification and the accuracy of the criminal justice system. Policy Insights from the Behavioral and Brain Sciences, 2(1), 175–186. doi:10.1177/2372732215602267
- Clark, S. E., & Godfrey, R. D. (2009). Eyewitness identification evidence and innocence risk. Psychonomic Bulletin & Review, 16(1), 22–42. doi:10.3758/PBR.16.1.22
- Cutler, B. L., Penrod, S. D., & Dexter, H. R. (1990). Juror sensitivity to eyewitness identification evidence. Law and Human Behavior, 14(2), 185–191. doi:10.1007/BF01062972
- Deffenbacher, K. A. (2008). Estimating the impact of estimator variables on eyewitness identification: A fruitful marriage of practical problem solving and psychological theorizing. Applied Cognitive Psychology, 22(6), 815–826. doi:10.1002/acp.1485
- DiNardo, L., & Rainey, D. (1991). The effects of illumination level and exposure time on facial recognition. The Psychological Record, 41(3), 329–334. doi:10.1007/BF03395115
- Duncan, M. J. (2006). A signal detection model of compound decision tasks (Tech. Rep. Np. No. TR2006-256). Toronto, ON: Defence Research and Development Canada.
- Dunham, R. E. (2015). Stage lighting: Fundamentals and applications. doi:10.4324/9781315662718. Retrieved from https://ebookcentral-proquest-com.ezproxy.vasa.abo.fi
- Dunning, D., & Perretta, S. (2002). Automaticity and eyewitness accuracy: A 10- to 12-second rule for distinguishing accurate from inaccurate positive identifications. Journal of Applied Psychology, 87(5), 951–962. doi:10.1037//0021-9010.87.5.951
- Fawcett, J. M., Russell, E. J., Peace, K. A., & Christie, J. (2011). Of guns and geese: A meta-analytic review of the ‘weapon focus’ literature. Psychology, Crime & Law, (February 2012), 1–32. doi:10.1080/1068316X.2011.599325
- Fechner, G. (1860). Elemente der Psychophysik. Elemente Dur Psychophysik, 572. doi:10.1111/j.2044-8317.1960.tb00033.x
- Felson, M., & Poulsen, E. (2003). Simple indicators of crime by time of day. International Journal of Forecasting, 19(4), 595–601. doi:10.1016/S0169-2070(03)00093-1
- Ferwerda, J. A. (1998). Fundamentals of spatial vision. Applications of Visual Perception in Computer Graphics, 140, 1–27.
- Hiraoka, T., Hoshi, S., Okamoto, Y., Okamoto, F., & Oshika, T. (2015). Mesopic functional visual acuity in normal subjects. PLoS ONE, 10(7), 1–10. doi:10.1371/journal.pone.0134505
- Hothorn, T., Bretz, F., & Westfall, P. (2008). Simultaneous inference in genneral parametric models. Biometrical Journal, 50(3), 346–363. doi:10.1002/bimj.200810425
- Hwang, A. D., & Peli, E. (2016). Positive and negative polarity contrast sensitivity measuring app. 1–6. doi:10.2352/ISSN.2470-1173.2016.16HVEI-122
- Jong, M. D., Wagenaar, W. A., Wolters, G., & Verstijnen, I. M. (2005). Familiar face recognition as a function of distance and illumination: A practical tool for use in the courtroom. Psychology, Crime & Law, 11(1), 87–97. doi:10.1080/10683160410001715123
- Lampinen, J. M., Erickson, W. B., Moore, K. N., & Hittson, A. (2014). Effects of distance on face recognition: Implications for eyewitness identification. Psychonomic Bulletin & Review, 1489–1494. doi:10.3758/s13423-014-0641-2
- Lampinen, J. M., Roush, A., Erickson, W. B., Moore, K. N., & Race, B. (2015). The effects of simulated distance on recognition of same race and other race faces. Visual Cognition, 6285(September), 1–21. doi:10.1080/13506285.2015.1084071
- Lindsay, R. C. L., Semmler, C., Weber, N., Brewer, N., & Lindsay, M. R. (2008). How variations in distance affect eyewitness reports and identification accuracy. Law and Human Behavior, 32(6), 526–535. doi:10.1007/s10979-008-9128-x
- Loftus, E. F. (1975). Leading questions and the eyewitness report. Cognitive Psychology, 7(4), 560–572. doi:10.1016/0010-0285(75)90023-7
- Loftus, G. R., & Harley, E. M. (2005). Why is it easier to identify someone close than far away? Psychonomic Bulletin & Review, 12(1), 43–65. doi:10.3758/BF03196348
- Lu, Z. L., & Dosher, B. (2014). Visual psychophysics: From laboratory to theory. Vol. 43. Perception. doi:10.1068/p4307rvw
- Lüdecke, D. (2019). sjPlot: Data Visualization for Statistics in Social Science. doi:10.5281/zenodo.1308157, R package version 2.6.3, https://CRAN.R-project.org/package=sjPlot.
- Mathôt, S., Schreij, D., & Theeuwes, J. (2012). OpenSesame: An open-source, graphical experiment builder for the social sciences. Behavior Research Methods, 44(2), 314–324. doi: 10.3758/s13428-011-0168-7
- McCready, D. (1985). On size, distance, and visual angle perception. Perception & Psychophysics, 37(4), 323–334. doi:10.3758/BF03211355
- Meissner, C. A., & Brigham, J. C. (2001). Thirty years of investigating the own-race bias in memory for faces: A meta-analytic review. Psychology, Public Policy, and Law, 7(1), 3–35. doi:10.1037/1076-8971.7.1.3
- Mickes, L. (2015). Receiver operating characteristic analysis and confidence-accuracy characteristic analysis in investigations of system variables and estimator variables that affect eyewitness memory. Journal of Applied Research in Memory and Cognition, 4(2), 93–102. doi:10.1016/j.jarmac.2015.01.003
- Motti, L. G., Vigouroux, N., & Gorce, P. (2015). Improving accessibility of tactile interaction for older users: Lowering accuracy requirements to support drag-and-drop interaction. Procedia Computer Science, 67(Dsai), 366–375. doi:10.1016/j.procs.2015.09.281
- Nash, R. A., Hanczakowski, M., & Mazzoni, G. (2015). Eyewitness testimony. International encyclopedia of the social & behavioral sciences (Vol. 8, Second ed.). Elsevier. doi:10.1016/B978-0-08-097086-8.51033-2
- Nyman, T. J., Lampinen, J. M., Antfolk, J., Korkman, J., & Santtila, P. (2018, May 4). The Distance Threshold (PRE-PRINT). doi:10.31234/osf.io/fcrxa
- Palmer, M. A., Brewer, N., Weber, N., & Nagesh, A. (2013). The confidence-accuracy relationship for eyewitness identification decisions: Effects of exposure duration, retention interval, and divided attention. Journal of Experimental Psychology: Applied, 19(1), 55–71. doi:10.1037/a0031602
- Penrod, S., & Cutler, B. (1995). Witness confidence and witness accuracy: Assessing their forensic relation. Psychology, Public Policy, and Law, 1, 817–845. doi:10.1037/1076-8971.1.4.817
- Pozzulo, J. D, Crescini, C., & Panton, T. (2008). Does methodology matter in eyewitness identification research?: The effect of live versus video exposure on eyewitness identification accuracy. International Journal of Law and Psychiatry, 31(5), 430–437. doi: 10.1016/j.ijlp.2008.08.006
- R Core Team. (2016). R development core team. R: A Language and Environment for Statistical Computing. Retrieved from https://www.r-project.org/
- Sauer, J. D., Brewer, N., & Wells, G. L. (2008). Is there a magical time boundary for diagnosing eyewitness identification accuracy in sequential line-ups? Legal and Criminological Psychology, 13(1), 123–135. doi:10.1348/135532506X159203
- Sauerland, M., Sagana, A., Sporer, S. L., & Wixted, J. T. (2018). Decision time and confidence predict choosers’ identification performance in photographic showups. PLoS ONE, 13(1), 1–12. doi:10.1371/journal.pone.0190416
- Sauerland, M., & Sporer, S. L. (2009). Fast and confident: Postdicting eyewitness identification accuracy in a field study. Journal of Experimental Psychology: Applied, 15(1), 46–62. doi:10.1037/a0014560
- Semmler, C., Dunn, J., Mickes, L., & Wixted, J. T. (2018). The role of estimator variables in eyewitness identification. Journal of Experimental Psychology: Applied. doi:10.1037/xap0000157
- Shlaer, S. (1937). The relation between visual acuity and illumination. Journal of General Physiology, 21(2), 165–188. doi:10.1085/jgp.21.2.165
- Singmann, H., Bolker, B., Westfall, J., & Aust, F. (2019). afex: Analysis of Factorial Experiments. R package version 0.23-0. Retrieved from https://CRAN.R-project.org/package=afex
- Sommet, N., & Morselli, D. (2017). Keep calm and learn multilevel logistic modeling: A simplified three-step procedure using stata, R, Mplus, and SPSS. International Review of Social Psychology, 30(1), 203–218. doi:10.5334/irsp.90
- Sporer, S. L. (1993). Eyewitness identification accuracy, confidence, and decision times in simultaneous and sequential lineups. Journal of Applied Psychology, 78(1), 22–33. doi:10.1037/0021-9010.78.1.22
- Sporer, S. L., Penrod, S. D., Read, J. D., & Cutler, B. L. (1995). Choosing, confidence, and accuracy: A meta-analysis of the confidence-accuracy relation in eyewitness identification studies. Psychological Bulletin, 118(3), 315–327. doi:10.1037/0033-2909.118.3.315
- Steblay, N., Dysart, J., Fulero, S., & Lindsay, R. C. L. (2003). Eyewitness accuracy rates in police showup and lineup presentations: A meta-analytic comparison. Law and Human Behavior, 27, 523–540. doi:10.1023/A:1025438223608
- Tidbury, L. P., Czanner, G., & Newsham, D. (2016). Fiat Lux: The effect of illuminance on acuity testing. Graefe’s Archive for Clinical and Experimental Ophthalmology, 254(6), 1091–1097. doi:10.1007/s00417-016-3329-7
- Varma, R., Vajaranant, T. S., Burkemper, B., Wu, S., Torres, M., Hsu, C., … McKean-Cowdin, R. (2016). Visual impairment and blindness in adults in the United States. JAMA Ophthalmology, 134(7), 802–809. doi:10.1001/jamaophthalmol.2016.1284
- Wagenaar, W. A., & Van Der Schrier, J. H. (1996). Face recognition as a function of distance and illumination: A practical tool for use in the courtroom. Psychology, Crime & Law, 2(4), 321–332. doi:10.1080/10683169608409787
- Weber, N., Brewer, N., Wells, G. L., Semmler, C., & Keast, A. (2004). Eyewitness identification accuracy and response latency: The unruly 10-12 second rule. Journal of Experimental Psychology. Applied, 10(3), 139–147. doi:10.1037/1076-898X.10.3.139
- Wells, G. L. (1978). Applied eyewitness-testimony research: System variables and estimator variables. Journal of Personality and Social Psychology, 36, 1546–1557. doi:10.1037/0022-3514.36.12.1546
- Wells, G. L., & Lindsay, R. C. (1980). On estimating the diagnosticity of eyewitness nonidentifications. Psychological Bulletin, 88(3), 776–784. doi:10.1037/0033-2909.88.3.776
- Wells, G. L., & Olson, E. A. (2002). Eyewitness identification: Information gain from incriminating and exonerating behaviors. Journal of Experimental Psychology: Applied, 8(3), 155–167. doi:10.1037/1076-898X.8.3.155
- Wickham, H. (2016). ggplot2: Elegant graphics for data analysis. New York, NY: Springer-Verlag. ISBN 978-3-319-24277-4. https://ggplot2.tidyverse.org
- Wixted, J. T., & Wells, G. L. (2017). The relationship between eyewitness confidence and identification accuracy: A new synthesis. Psychological Science in the Public Interest, 18(1), 10–65. doi:10.1177/1529100616686966
- Zele, A. J., & Cao, D. (2015). Vision under mesopic and scotopic illumination. Frontiers in Psychology, 6(JAN), 1–15. doi:10.3389/fpsyg.2015.00594