
 ?Mathematical formulae have been encoded as MathML and are displayed in this HTML version using MathJax in order to improve their display. Uncheck the box to turn MathJax off. This feature requires Javascript. Click on a formula to zoom.
Abstract
Rolling stock examination is performed to identify the defects during train movements at speeds <30 kmph. In this study, this process was automated using computer vision models. Parts on a moving train were segmented using four types of active contour-level set models: Chan–Vese (CV), CV-based morphological differential gradient (CV-MDG), CV with shape priors (CV-SP), and CV with shape invariance (CV-SI). CV level sets with shape invariance model enables the adjustment of contour according to scale, rotation, and location of the shape prior object in the rolling stock frame. Train rolling stock video data were captured at a high speed of 240 fps by using a sports action camera with 52° wide angle lenses. The level sets yielded optimal segmentation results compared with traditional segmentation methods. The performance indicators of segmented parts from the proposed four algorithms are structural similarity index measure and peak signal-to-noise ratio (in dB). A total of 10 parts were extracted from a bogie by using the proposed models and compared against the ground truth models to test the performance of the methods. The train had 15 passenger cars with 30 bogies. Furthermore, the models were tested under various lighting conditions for five trains. The CV shape invariance model yielded more efficient segmentations both qualitatively and quantitatively.
Public Interest Statement
Train rolling stock examination, monitors the undercarriage of a train coach when moving at <30 kmph. The monitoring is done manually at every train station to ensure the safety of the train and identify defects in the undercarriage. In this work we propose to digitize the whole process to assist the maintenance tasks during movement. The process is automated using a high speed camera and the corresponding algorithm. The high speed video is processed in frames. The algorithm extracts each rolling part using shape information of the individual part. Level set models of four varieties are tested in this work. We compare their performance using peak signal to noise ratio and structural similarity index measures. The results show 95% segmentation accuracy for level set supplied with adaptive shape information under various capturing conditions. Hence, in future computer vision models in rolling examination can change the process from manual to automation.
1. Introduction
According to the 2012 India Risk Survey, most train accidents occurred because of human mistakes and improper maintenance of rolling stock. More than 0.17 million people in India are employed in this sector. Most train accidents are caused by the following:
| (1) | Contact with exposed moving mechanical parts. | ||||
| (2) | Flying parts. | ||||
| (3) | Fire. | ||||
| (4) | Human mistakes. | ||||
In this study, we explored computer vision tools and algorithms for monitoring train rolling stock. The moving and rolling portions of a train are called rolling stock. Passenger trains are constantly monitored for defects during transit as a part of passenger safety. Railway boards across the world have established guidelines to identify a defective moving part that can cause extensive damage to the train.
In this decade, computer algorithms have been increasingly employed in human safety measures during transit. However, most studies have focused on airways, roadways, and waterways. Railroads also adopt extensive safety measures for passenger safety, which are based on decades-old promising and reliable technologies. Train rolling stock is crucial for railway passenger safety and is monitored 24 h a day by most railway boards across the world.
We proposed the use of computer vision models and algorithms to identify parts and classify defects during rolling examination tests. Therefore, we used a high-speed sports action camera to capture videos of rolling stock when the train was moving at 30 kmph near stations. The captured frames were treated with a virtual contrast enhancement module (Kishore & Prasad, Citation2015b) to improve their contrast. Parts of these frames were segmented to identify defects during transit. We proposed four algorithms for this analysis. We first used the Chan–Vese (CV) level set model on all frames of rolling stock and then proposed a new model of the CV level set model, which considerably improved segmentation time but could not enable us to localise the objects of interest in the rolling frames. Furthermore, shape prior models were extensively studied (Kishore & Prasad, Citation2015b). Although the shape of the part remains constant during transit, the moving train poses a challenge in locating the object of interest. Hence, the shape invariance shape prior algorithm was proposed. All four models have been discussed extensively in previous studies (Kishore & Prasad, Citation2015a) and briefly in Section 3 in this paper.
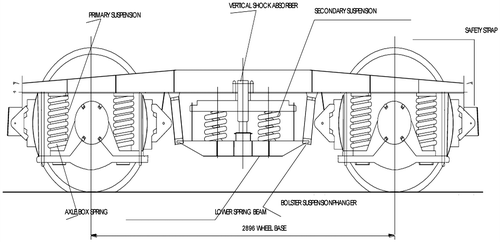
Fabbrica Italiana de Automobili Torino (FIAT) train bogies are largely used in Indian trains. The 3D model of a FIAT bogie is presented in Figure . Indian railways use approximately six operational models for 30% of the passenger trains. For the remaining 70%, the Indian railways use a different model known as the Integral Coach Factory (ICF) bogie (Figure ).
Figure 1. FIAT bogie of a train and its parts as defined in the Indian Railway Manual.
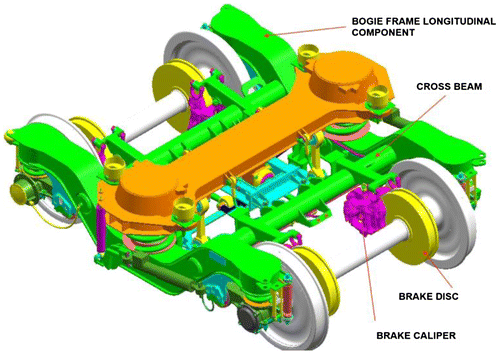
Figure 2. ICF bogie of a train and its parts as defined in the Indian Railway Manual.
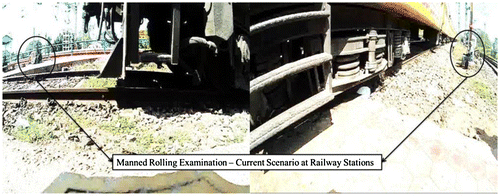
Trains travel on two bogies per coach, as shown in Figures and . Failure of the bogie or its parts during movement is harmful for the passengers and the railway organizations. Rolling stock examination (RSE) is conducted by the railways to ensure passenger safety. The inspection involves proficient visual and auditory human senses to classify defects through surveillance of a moving train. During surveillance, a train moves at approximately 30 kmph. The procedure followed by railway operators in most Asian countries is depicted in Figure .
Figure 3. Manned rolling examination with two persons stationed at either side of the moving train near a railway station.
The inspection results are recorded in an office spreadsheet, with data on defects and their concentrations at several locations along the train. These data are delivered to the railway maintenance workforce, who address the problems.
A team of six personnel per train is assigned for examination, with two personnel for monitoring and a third person for recording the defects on both ends of the station. Manned RSE has the following shortcomings:
| • | Human involvement—inaccuracy in detection. | ||||
| • | Personnel work load surges at peak hours, which may cause errors. | ||||
| • | Life-threatening defects addressed by the maintenance team at the next station. | ||||
| • | Weather dependency. | ||||
| • | High maintenance costs. | ||||
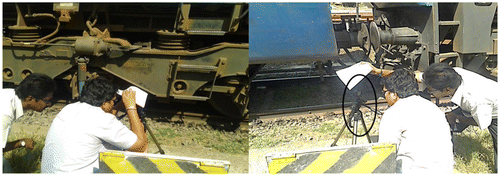
In this study, we employed computer vision algorithms for rolling stock segmentation during examination. Figure illustrates the procedure followed to create an on-field video database of rolling stock for examination by a group of Indian railway personnel.
Figure 4. Rolling examination by using high-speed sports action camera for video database creation.
2. Related work
Researchers in the literature have actually conducted studies on the application of computer vision in railway undercarriage health detection using multispectral imaging (Hart et al., Citation2008) and X-ray imaging (Rothschild & Grodzins, Citation2001). Machine vision has been employed in automobile (Kosmopoulos & Varvarigou, Citation2001), transportation (Milanés et al., Citation2012), structural (Fathi, Dai, & Lourakis, Citation2015), agricultural (Zhang & Li, Citation2014), and manufacturing (Yang, Zha, Gao, & He, Citation2016) industries for approximately past two decades. Specialised high-speed, hyperspectral, and laser cameras are used for capturing videos in industries. Bottling plants worldwide use high-speed action cameras that record at 5,000 fps for separating defective bottles from non-defective ones when they are travelling on a conveyer at 85 kmph.
Rail industries worldwide have been relatively slow in adapting computer vision for maintenance tasks. Rolling examination is performed for every passenger train in the Indian subcontinent to prevent accidents caused by bogie part failure during transit. Human efforts in identifying defects can be replaced with high-speed cameras and algorithms. However, the real challenge is designing solutions that yield excellent performance with respect to imposing constraints by the complexity of the problem.
The fuzzy-weighted logarithmic least squares method has been investigated for train RSE with machine vision. The video of the rolling stock captured using a regular camera at 30 fps was thresholded, and a fuzzy model based on the triangular fuzzy number was built. The segmented rolling parts were classified using the weighted logarithmic least square method. However, in the study on the model evaluation process (Wang, Xu, & Zhang, Citation2010), the accuracy of detection and performance of the algorithm under various natural circumstances were not discussed.
Embedded-system-based intelligent monitoring of rolling stock for safety enhancement in rail transit is a constrained solution proposed in Mor-Yaroslavtsev and Levchenkov (Citation2011). This study reviewed models for assessing rolling stock failure with observable parameters for failure during train movement in real time. An artificial immune algorithm facilitates the detection and prediction of the health of rolling stock on the basis of the data collected from a set of sensors attached to the rolling stock. However, signal noise from the sensors in transit is a major problem in this approach.
Most industrial safety measures in the current scenario are based on maintenance cost cutting. In this regard, Yun, Han, and Park (Citation2012) described preventive maintenance forecasting to reduce the budget distribution for RSE. The authors employed heuristic search algorithms such as genetic algorithm and simulated annealing to detect optimal maintenance breaks for rolling stock life span maximization. Subsequently, extensions were added to calculate the optimum number of spares required during maintenance cycles and their long-term market availability. However, automation of this entire process could have changed the course of rolling stock maintenance.
Developers in Lewis, Maddison, and Stewart (Citation2014) investigated wireless monitoring of rolling stock with extensive reviews and analyses that revealed potentially equivalent advantages of the prior models for vibration analysis. The authors proposed a standardised framework for rolling examination by using a multi-hop mesh network. The network provides temporary and semi-permanent observable functions of rolling stock by using localised network processing with energy harvesting power management through a wireless mechanism. Accordingly, the methods complement each other efficiently; however, the entire essence of RSE could not be captured.
In a recent study, researchers focused on thickness measurement of lining-type brakes by using computer vision for automated rolling stock monitoring. To define the circular outline of a disk lining brake, points of interest were detected using the Hough transform, and the brake edge was examined for anomalies in the region of interest. Furthermore, the authors presented a mechanism for testing the algorithm in real time by setting up cameras on tracks under the moving bogies. By using the proposed system, the thickness of the lining-type brake was experimentally measured as 1.15 mm with precision at a distance of 1.0 m from the camera (Boullie & Brun, Citation2000). Similar methods and systems have being employed for brake and wheel systems of bogies (Kim & Kim, Citation2009; Sato, Nishii, & Adachi, Citation1992) by using computer vision and pattern classification for extracting and categorising brake shoe defects in real time by using high-speed cameras installed on tracks.
The experimental module Technicatome developed as a demonstrator for RATP (a Parisian subway company) on the basis of interconnected digital systems was reported in (Hwang, Park, & Kim, Citation2010). This demonstrator is currently in operation on an MF 88 train set to the long existing and still operated with conventional relay-based systems.
Thus, few methods for RSE have been proposed, and their reliability is questionable because they fail to represent the RSE. The present study improved these proposed methods by installing a high-speed camera on the sides of the tracks for RSE. According to the Indian railway manual (http://www.intlrailsafety.com), approximately 10 crucial things should be tested during an RSE: part breakages, hanging parts, dragging parts, pushing parts, missing screws, brake linings, suspensions, holding pins, axel boxes on wheels, wheel movement on rails, and flat tyre. In this study, we simulated bogie part extraction and defect identification by capturing high-speed videos of moving trains.
Segmentation of the captured high-speed bogie video provides a 2D view of each rolling stock component. The main contributions of our study are as follows:
| (1) | We proposed a new approach for focused object extraction from a densely packed object background with similar characteristics by using weighted shape prior active contours. | ||||
| (2) | Individual rigid objects in the moving bogie were segmented using a single shape model, which was challenging because the shape of the parts varied from end to end because of view variance induced by the fixed camera angle. | ||||
| (3) | Cluttered and hidden bogie parts during motion were captured using a single shape prior model by introducing the shape invariance concept. | ||||
| (4) | Defective parts were successfully segmented using non-defective shape priors through weight vector modification. | ||||
The remainder of the paper is organised as follows: Weighted shape priors with active contours are presented in Section 3. Section 4 presents the results of the experiments with various train models and defects. Finally, related outcomes and conclusions are presented in Section 5.
3. Active contour level sets for high-speed video frame segmentation
3.1. Active contours: Basic theory
Terzopoulos, Platt, Barr, and Fleischer (Citation1987) first introduced active contour models to segment images for shape modelling. The active contour equation termed snake was introduced by Kass, Witkin, and Terzopoulos (Citation1988). Let be visible and constrained 2D shape space containing a set of positive real numbers. The subspace object is
, which forms a subset of image S ⊂ F. The active segmentation energy function is as follows:
(1)
(1)
where ES is the snake of the energy, Einternal is the internal energy of the snake, and is the image energy.
The position of the snake on the image is characterised by(2)
(2)
and the internal energy Einternal of the snake curve due to bending and represent the image forces that push the deformable curve towards the image boundaries. The Einternal is defined as follows:
(3)
(3)
where ω′(s) is first-order derivative of ω(s), which tracks to changing the curve length, and α(s) is the degree of constriction in all directions. Similarly, ω″(s) is the second-order derivative of ω(s) with respect to change in the snake curve s and β(s) normalises the snake boundary in the direction of the moment of curvature. The external image force model is defined as follows:(4)
(4)
3.2. CV active contour model
The CV active contour model (Chan & Vese, Citation2001) is arithmetically expressed by minimizing the energy function as follows:(5)
(5)
where Θ is the initial contour and ΘI is the final contour shape to be determined. The determined contour provides an estimate of the object borders in an image to Φ(I) inside the contour Φ and another Φ(E) outside the contour. The CV active contour model of energy function is minimised using the piecewise linear Mumford–Shah (Mumford & Shah, Citation1989) function, which enables us to estimate the grey scale image F(x, y) by using a linear piecewise smoothing contour Θ.
The minimization solution is defined as follows:(6)
(6)
In Equation (6), the first term denotes the arc length , which guarantees the reliability of Θ during curve evolution, and l(Θ) is the contour perimeter. The second term in Equation (6) combines two integrals; the first integral forces the contour Θ towards the image objects, whereas the second integral guarantees the differentiability of the contour Θ. The internal(Θ) and external(Θ) represent the internal and external contours, respectively.
In Equation (6), the weights are positive real numbers ω1, ω2 ≥ 0. The solution for Equation (6) is obtained through Mumford–Shah distance formulation with a piecewise smoothness function as follows:(7)
(7)
Compared with the CV model, the Mumford–Shah model comprises an additional term incorporating the area function, and Φ takes two values corresponding to the mean of pixels inside and outside Θ.
(8)
(8)
The Θ values on image F(x, y) can be determined using the CV model with the energy model as follows:(9)
(9)
The first two relations are regularizing factors for contour length and area for controlling the contour size regulated by parameters ω1 > 0, ω2 > 0 and ν > 0 and are user dependent. The last two terms enable us to adapt the model Θ(x, y) for objects in the image I(x, y). Equation (9) formulates a global minimizing problem for image segmentation.
By solving the minimization problem in Equation (9) by using the level set models in (Jiang & Lan, Citation2006), it can be restructured in terms of level set function Θ(x, y) as follows:(10)
(10)
where M(Θ) is the Heaviside function. The level set function and Euler–Lagrange (Chan & Vese, Citation2001) equations are used to solve the minimization to determine Θ(x, y) of the level set function, which is updated iteratively by using the gradient descent method.(11)
(11)
where x and y denote the pixel’s locations on the image, δ(Θ) is the delta function, and Φ(I) and Φ(E) are updated iteratively by using the following equations:(12)
(12)
(13)
(13)
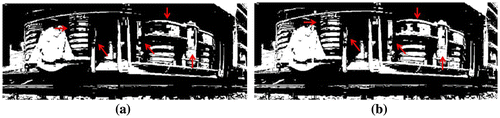
This is the first model for segmenting rolling stock that allows a full segmentation of the rolling frames, as shown in Figure (a). Approximately 750 iterations are performed per video frame with a 760 × 1,080 resolution. Time is critical in such tasks, and the binary image still lacks clarity regarding the individual parts in the bogie. Next, we employed a method that was used to improve the speed and segmentation quality of ultrasound medical images in Kishore, Sastry, and Rahman (Citation2016).
Figure 5. (a) Segmentation with CV model (Chan & Vese, Citation2001) and (b) Segmentation with CV with morphological differential gradient model.
3.3. CV level set model with morphological differential gradient
The previously discussed CV level set model used image gradient (IG) to recognise object borders, thus making it a region-based edge detection framework. Inaccurate segmentations on the field rolling stock image frames with rapid brightness variations obtained using CV model provides unclear object boundaries. As highlighted in (Huang, Bai, & Li, Citation2014), the computation time for obtaining an optimal curve for on-field rolling stock frame segmentation is challenging. The initial contour spreads on the entire image for faster segmentation.
Although the CV method is efficient for various segmentation problems, we proposed to fine-tune the CV model’s IG [i.e. the last term in (11)] with a morphological gradient difference (MDG) term. For edge mapping, the IG transforms into MDG by using the difference in morphological gradients. For the video frame Ixy:D → ℜ2 in space D, the morphological operator’s dilation and erosion for the grey scale image with a line structuring element comprising m rows and n columns Lmn:D → ℜ2, m, n = {−M, …, M} are defined as follows:(14)
(14)
(15)
(15)
where M denotes the size of the line structuring element Lmn. A set of four line orientations with single adjacent overlapping pixels produces the structuring element Lmn. The morphological gradient operators are ∇d and ∇e for dilation and erosion, respectively. The last term in Equation (11)
is modified into the MGD term
. This minor change in calculating image energy can be clearly observed in Figure (b).
The arrows in the regions in Figure (a) and (b) denote the IG in regular CV and MDG in adjusted CV-MDG showing edge enhancement. Moreover, the CV-MDG performed at a 44% higher speed than traditional CV models for rolling stock segmentation.
Nevertheless, the maintenance crew still experience difficulty in identifying parts and extracting each part for examination. Although the model enabled to improve the quality and speed of regional segmentation, it is still unsuitable for vision-based RSE. The following two models employ a part-by-part extraction approach for examining and identifying defects by using additional information in the form of shape priors.
3.4. CV-shape prior level set model (CV-SP)
By incorporating the shape prior model proposed in (Cremers, Osher, & Soatto, Citation2006) into the CV (no in previous) level set in Equation (10), the energy function of the shape prior can be expressed as follows:(16)
(16)
The principal term is the data term from the CV level set in (10) and the second term is the shape prior energy, which is defined as follows:(17)
(17)
where is the shape prior term dependent on the image position. For multiple shape priors, the shape energy term is given by
(18)
(18)
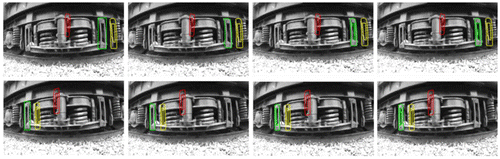
To produce significant segmentations by using Equation (18), the number of shape priors must be low; however, capturing the statistical structure of different shapes in the observational space with this small set is difficult. In this study, we focused mainly on single object extractions with single shape priors by simulating Equation (16). Figure presents the level set evolution on a frame of rolling stock. The shape prior was fixed for this particular frame of the bogie. Changes in the shape of the part caused by position changes will affect the segmentation outputs.
Figure 6. Curve evolution for fixed shape prior level set.
3.5. CV shape prior level set model with shape invariance model (CV-SI)
A shape prior model for level set as a learning basis focuses on segmenting a particular bogie part and is useful in the post-processing recognition process. Cremers, Sochen, and Schnörr (Citation2006) introduced the signed distance function for shape-encoded level sets. To establish a unique relationship between the surrounding level set ϕ and a pre-defined shape model φShape, we assumed that ,
, and
everywhere else. This signed distance function can be defined using many methods (Laadhari, Saramito, & Misbah, Citation2016; Sussman, Smereka, & Osher, Citation1994); however, we used the most widely applied method with constraints of scaling, rotation, and translational properties. In this paper, we propose the use of initial contour ϕ and shape prior φShape contour to compute the level set area difference, as discussed in (Charpiat, Faugeras, & Keriven, Citation2005).
(19)
(19)
The defined distance function exhibits image size independence, is non-negative and symmetric, and satisfies triangle inequality. In this study, we identified parts with only one shape prior for all the 20,000 frames. When the train moves to the left or right of the frame, the bogie moves laterally in only the x-direction. Moreover, the parts do not change their shape, except in the presence of defects. Translational invariance, scale invariance, and rotational invariance are the keys to shape invariance level set model. However, for rolling stock, the focus should be on the translational alignment of shape term before the application of level set function because of the lateral movement of train in only one direction.
The shape invariance of shape prior is preserved in most frames, except for minute and negligible changes in rotation because of camera shakes and small-scale changes caused by view variance. However, large translational changes in the part shape should be considered because its location is not constant in the frame. This can be easily handled by using the following:(20)
(20)
where sφ and tφ are the shape scale and translational values. Shape invariance is derived from the fractional evolving shape ϕ0, which is computed at the same location and scale as Θ. Local energy minimization between maximises the possibility of determining the correct shape in the cluttered backgrounds. The affine transformations are defined using current shape ϕ0. The curve evolution expression is obtained by applying the Euler–Lagrange equation in Equation (20) as follows:
(21)
(21)
where is the delta function and t is the artificial time step. Finally, incorporating the shape prior energy term in (20) and CV level set function in (10), the total energy function of the level set is given as follows:
(22)
(22)
where ζ controls the effect of shape prior energy on the image energy function. For single shape priors, the energy function used for algorithm development derived from evolution Equations (10) and (21) is given by(23)
(23)
where C+ and C− are updated iteratively at each discrete time step by using expressions similar to Equation (13). Figure presents the curve evolution of shape invariance level set function. As shown, the location, scale, and orientation of the spring in the image plane are different from the shape prior sub-space. The red contour is the shape prior model and the yellow contour represents the transformed shape prior. The green contour evolves on the image plane by detecting the object and moving towards it.
Figure 7. Curve evolution in shape invariance level set model.
4. Experimental results
The accuracy and speed of the aforementioned four models were extensively tested by conducting segmentation process of 10 parts under a moving bogie at 30 kmph. A high-speed sports action camera was used to capture the videos of bogies in transit at 240 fps to avoid motion blur. In addition, the camera was equipped with a wide angle lens to facilitate the recording of the entire bogie in one frame (Figure ). Four trains with the same configuration and parts were recorded at various time stamps. These passenger trains in India are approximately 15 compartments long and each compartment has 30 bogies (i.e. two per compartment). Each captured bogie occupied approximately 80 frames in a video sequence. Segmenting each part for assessment is the primary task in a computer-vision-based RSE. The output quality determines the assessment speed and accuracy in distinguishing defective parts from non-defective parts.
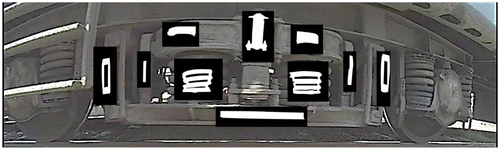
The experiments were exclusively conducted to estimate the speed and accuracy of the segmented output. Two methods of estimation are employed in computer vision problems: visual and analytical. Visual estimation of quality involves human judgement of the bogie part by monitoring the segmented part for a specific period. The responses help in judging the best algorithm for this purpose. Three railway staff were assigned to make judgments on the segmented outputs for the 10 parts. The 10 parts used for testing the algorithms for bogie segmentation are presented in Figure .
Figure 8. Ten bogie parts used for segmentation and testing the algorithms for segmentation.
For analytical testing of the performance of the algorithms, we proposed the use of the structural similarity index measure (SSIM) (Kishore et al., Citation2016) and peak signal-to-noise ratio (PSNR) (Kishore et al., Citation2016). Ground truth (GT) models (Figure ) were used as a reference for calculating SSIM and PSNR. The expressions for calculation with their names were provided in the references.
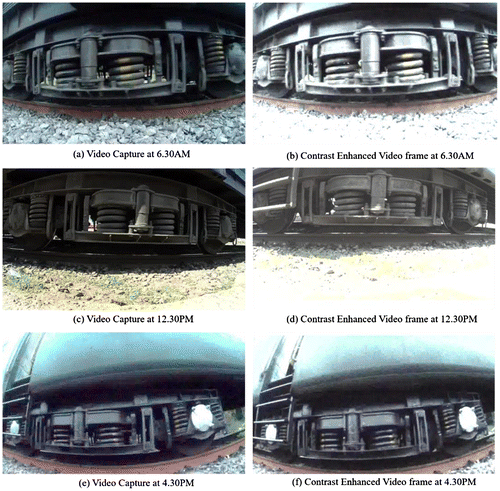
Video capturing in the natural environment with uncontrolled lighting induces brightness artefacts in the frames. The methods proposed in this paper depend on the brightness quotient of the image frame. The problem of brightness artefacts was rectified by using the brightness preserving contrast enhancement method described in Madhav, Pardhasaradhi, Manepalli, Kishore, and Pisipati (Citation2015). This method employs virtual image frames of different weights generated from a single frame and fuses them into a single frame by using wavelet transform. The image frames at different times enhanced using virtual contrast enhancement are presented in Figure . The contrast-enhanced frames were then input into the algorithms of CV, CV-MDG, and CV-SP. Notably, the performance of CV-SI was unchanged irrespective of frames with or without contrast enhancement.
Figure 9. Virtual image fusion-based contrast-enhanced frames of rolling stock.
First, the algorithms CV, CV-MDG, CV-SP, and CV-SI were visually tested. CV and CV-MDG were applied on the entire frame, whereas CV-SP and CV-SI were focused near the part of interest. In case of CV and CV-MGD, the parts were cut for comparison with the other two models. Figure presents the comparison of the 10 parts extracted from the four algorithms used for RSE.
Figure 10. Visual comparison of the four algorithms used for RSE.
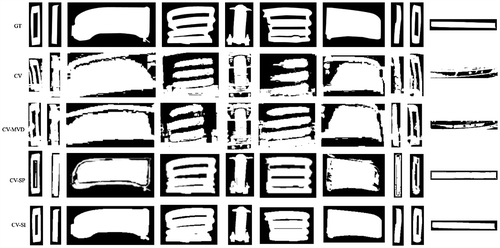
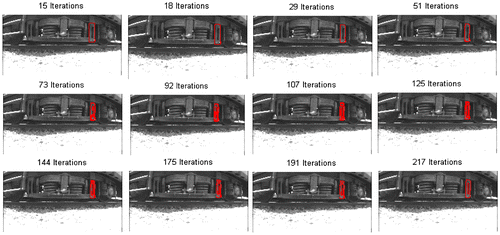
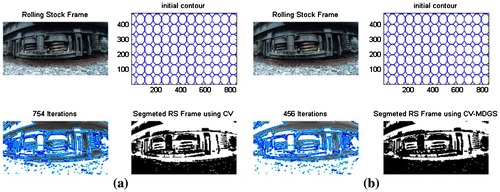
The first row illustrates the GT images of the parts extracted by an expert. Rows 2–5 present the results of parts segmented from CV, CV-MDG, CV-SP, and CV-SI algorithms. The last row images can be observed to be closely related to the GT images. The CV model is a global region-based segmentation algorithm that employs gradients to propel the initial contour towards the edges in the frame. CV-MGD employs MDG to move the contour around. We observed a clear reduction in the number of iterations between CV-MGD and CV. Figure presents the comparison of the number of iterations between the CV and CV-MDG models along with the initial contours used for segmentation. After multiple testing, we determined that the CV-MDG used approximately 44% less number of iterations compared with CV.
Figure 11. Number of iterations and initial contours for the (a) CV algorithm segmentation and (b) CV-MDG algorithm of a rolling bogie frame.
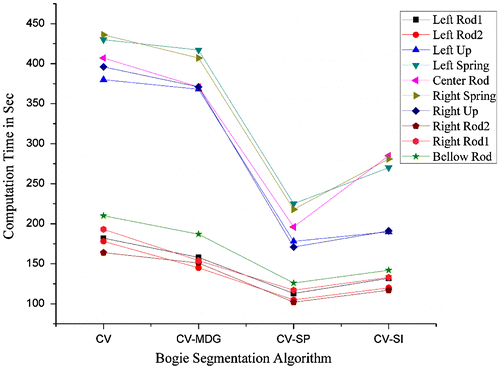
For CV-SP and CV-SI, the iterations were comparatively lesser because the initial contours were close to the object of interest. The average iterations for were 115 and 190 for CV-SP and CV-SI, respectively. The slight increase in iterations was because of the internal iterations used for compensating scale, rotation, and position variations between the initial segmentation result and GT shape prior. A plot of the average computation times against a set of 80 frames for 10 parts is presented in Figure . For CV and CV-MDG, the time was averaged on the basis of number of parts in the image frame. For simple bogie structures such as binding rods, the computation time was fairly less compared with complex structures such as springs. Although CV-SP was faster than all other algorithms, it failed to produce clearly segmented bogie parts.
Figure 12. Average computation times of segmenting algorithms for 10 bogie parts.
As discussed previously, analytical testing of the segmenting algorithms is necessary to determine the usefulness of the segmented parts for real-time use. Analytical testing involves comparing the segmented result with GT result by using a mathematical relationship between the pixels in the two images. SSIM yielded a score between 0 and 1, indicating a similarity between the estimated and actual values. A score of 0 denotes no similarity and 1 denotes complete similarity. The SSIM score indicates the quality of the output image compared with the GT images. The PSNR value in dB indicates a relationship between white and black pixels compared with GT images. PSNR ranged from 3 to 13 dB for all parts. The low value of PSNR is attributed to the small size of part images used for calculation.
Analytical test results obtained using the four segmenting algorithms for two simple [centre horizontal support beam (bellow rod) and right rod-1] and two complex (left spring and centre rod) structures in an 80-frame bogie video are presented in Figure . Algorithms are colour coded in all the plots. Each vertical column represents SSIM and PSNR for the four components. All the analytical parameters were calculated for 80 frames. The plots present SSIM and PSNR values per frame.
Figure 13. SSIM and PSNR for four parts by using four segmentation algorithms for 80 frames.
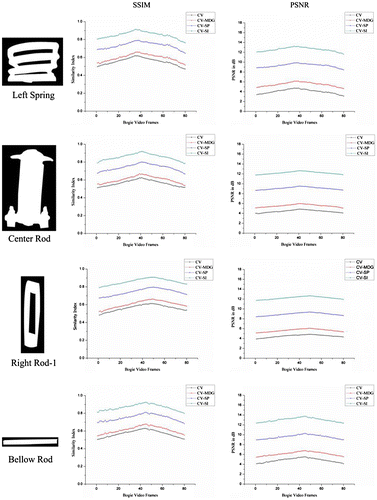
A loss in value was observed in the plots in the initial and final frames compared with the middle frames (Figure ). This was because of the reference frame used for extracting the GT part. All the middle frames were used for creating GT parts. The CV-SI performed more efficiently compared with the other three models. Of all the algorithms, the SSIM reached a score of 0.953 only for CV-SI. The PSNR for CV-SI was approximately 12.93 dB, which was the highest among the four segmenting algorithms. The high scores for CV-SI and CV-SP indicate the importance of additional information for level set propagation on the complex image plane. However, CV-SP did not exhibit precise control of shape prior with respect to image plane objects in terms of scale, position, and orientation.
Table presents the average values for all four algorithms with SSIM and PSNR for an entire train at four capturing times: Train-1: 12:00 pm, Train-2: 07:00 pm, Train-3: 06:00 am, and Train-4: 05:00 pm.
Table 1. Average values for all four algorithms with SSIM and PSNR
Table provides the average values of each part for the entire train. Each train consists of 15 coaches with 30 bogies. All the values were averaged per train. A comparison of the scores for the four segmentation algorithms revealed that the CV-SI was the most efficient model because it could control the subspace of the shape model. This control can be shifted to the image plane based on the complexity of the image plane. The complexity in segmentation is based on the object packing density and less intensity variation between objects in the frame. In this study, we demonstrated that level set-based shape prior models are an excellent choice for part extraction compared with other segmentation models. We used the latest segmentation models, live super pixels (Saranathan & Parente, Citation2016) and graph cuts (Mahapatra, Citation2017); however, we were unable to obtain favourable results. Moreover, super pixels based on some fixed pixel characteristics and graph cuts are manual procedures that involve the selection of foreground pixels.
5. Conclusion
We proposed a computerised technique for the examination of rail rolling stock. Level set segmentation was used in various formats to extract parts from the moving bogie. Video capturing using a high-speed camera results in less noise during frame recording. The CV, CV-MDG, CV-SP, and CV-SI were used for part extraction. A total of 10 parts were extracted from different trains under various ambient lighting conditions. Visual and analytical models were used for validating the results from the algorithms. SSIM and PSNR were calculated, and the most efficient algorithm at various conditions was determined on the basis of the SSIM and PSNR values. The CV-SI algorithm outperformed the other three algorithms, except in terms of computational speed because of multiple inter frame iterations. Thus, models based on the CV-SI algorithm will facilitate safer rail travel and proper monitoring of rolling stock under hostile conditions.
Additional information
Funding
Notes on contributors
Ch. Raghava Prasad
Ch. Raghava Prasad obtained his BTech, from Velagapudi Ramakrishna Siddhartha Engineering College in Vijayawada. And MTech from Vignan’s Foundation for Science, Technology & Research University in the specialization of embedded systems. He is having more than 5 years teaching experience and having eight international and national journals/conference papers. His research interested areas includes Image Processing and Video Processing.
P.V.V. Kishore
P.V.V. Kishore (MIEEE’07) received his PhD degree in Electronics and Communications Engineering from Andhra University College of Engineering in 2013. He received MTech from Cochin University of Science and Technology in the year 2003. He received BTech degree in Electronics and Communications Engineering from JNTU, Hyderabad in 2000. He is currently full professor and Image, Signal and Speech Processing Research Head at K L University, ECE Department. His research interests are Digital Signal and Image Processing, Artificial Intelligence and Human Object Interactions. He is currently a member of IEEE. He has published 70 research papers in various national and international journals and conferences including IEEE, Springer and Elsevier.
References
- Boullie, J.-B., & Brun, M. (2000). A new rolling stock architecture using safety computers and networks. Paper presented at the Proceedings International Conference on Dependable Systems and Networks, 2000 (DSN 2000), New York, NY.
- Chan, T. F., & Vese, L. A. (2001). Active contours without edges. IEEE Transactions on Image Processing, 10, 266–277.10.1109/83.902291
- Charpiat, G., Faugeras, O., & Keriven, R. (2005). Approximations of shape metrics and application to shape warping and empirical shape statistics. Foundations of Computational Mathematics, 5(1), 1–58.10.1007/s10208-003-0094-x
- Cremers, D., Osher, S. J., & Soatto, S. (2006). Kernel density estimation and intrinsic alignment for shape priors in level set segmentation. International Journal of Computer Vision, 69, 335–351.10.1007/s11263-006-7533-5
- Cremers, D., Sochen, N., & Schnörr, C. (2006). A multiphase dynamic labeling model for variational recognition-driven image segmentation. International Journal of Computer Vision, 66, 67–81.10.1007/s11263-005-3676-z
- Fathi, H., Dai, F., & Lourakis, M. (2015). Automated as-built 3D reconstruction of civil infrastructure using computer vision: Achievements, opportunities, and challenges. Advanced Engineering Informatics, 29, 149–161.10.1016/j.aei.2015.01.012
- Hart, J., Resendiz, E., Freid, B., Sawadisavi, S., Barkan, C., & Ahuja, N. (2008). Machine vision using multi-spectral imaging for undercarriage inspection of railroad equipment. Paper presented at the Proceedings of the 8th World Congress on Railway Research, Seoul.
- Huang, X., Bai, H., & Li, S. (2014). Automatic aerial image segmentation using a modified Chan–Vese algorithm. Paper presented at the 2014 9th IEEE Conference on Industrial Electronics and Applications, Hangzhou.
- Hwang, J., Park, H.-Y., & Kim, W.-Y. (2010). Thickness measuring method by image processing for lining-type brake of rolling stock. Paper presented at the 2010 2nd IEEE International Conference on Network Infrastructure and Digital Content, Beijing.
- Jiang, N. Z. X., & Lan, X. (2006). Advances in machine vision, image processing, and pattern analysis.
- Kass, M., Witkin, A., & Terzopoulos, D. (1988). Snakes: Active contour models. International Journal of Computer Vision, 1, 321–331.10.1007/BF00133570
- Kim, H., & Kim, W.-Y. (2009). Automated thickness measuring system for brake shoe of rolling stock. Paper presented at the 2009 Workshop on Applications of Computer Vision (WACV), Salt Lake City, UT.
- Kishore, P. V. V., & Prasad, C. R. (2015a). Train rolling stock segmentation with morphological differential gradient active contours. Paper presented at the 2015 International Conference on Advances in Computing, Communications and Informatics (ICACCI), Cochin.
- Kishore, P. V. V., & Prasad, C. R. (2015b). Shape prior active contours for computerized vision based train rolling stock parts segmentation. International Review on Computers and Software (I.RE.CO.S.), 10, 1233–1243.
- Kishore, P. V. V., Sastry, A., & Rahman, Z. U. (2016). Double technique for improving ultrasound medical images. Journal of Medical Imaging and Health Informatics, 6, 667–675.10.1166/jmihi.2016.1743
- Kosmopoulos, D., & Varvarigou, T. (2001). Automated inspection of gaps on the automobile production line through stereo vision and specular reflection. Computers in Industry, 46, 49–63.10.1016/S0166-3615(01)00113-0
- Laadhari, A., Saramito, P., & Misbah, C. (2016). An adaptive finite element method for the modeling of the equilibrium of red blood cells. International Journal for Numerical Methods in Fluids, 80, 397–428.10.1002/fld.v80.7
- Lewis, R., Maddison, S., & Stewart, E. (2014). An extensible framework architecture for wireless condition monitoring applications for railway rolling stock. Paper presented at the 6th IET Conference on Railway Condition Monitoring (RCM 2014), Birmimgham.
- Madhav, B., Pardhasaradhi, P., Manepalli, R., Kishore, P., & Pisipati, V. (2015). Image enhancement using virtual contrast image fusion on Fe3O4 and ZnO nanodispersed decyloxy benzoic acid. Liquid Crystals, 42, 1329–1336.10.1080/02678292.2015.1050704
- Mahapatra, D. (2017). Semi-supervised learning and graph cuts for consensus based medical image segmentation. Pattern Recognition, 63, 700–709.
- Milanés, V., Llorca, D. F., Villagrá, J., Pérez, J., Fernández, C., Parra, I., … Sotelo, M. A. (2012). Intelligent automatic overtaking system using vision for vehicle detection. Expert Systems with Applications, 39, 3362–3373.10.1016/j.eswa.2011.09.024
- Mor-Yaroslavtsev, A., & Levchenkov, A. (2011). Rolling stock location data analysis using an immune algorithm on an intelligent embedded device. Paper presented at the 2011 19th Telecommunications Forum (TELFOR), Belgrade.
- Mumford, D., & Shah, J. (1989). Optimal approximations by piecewise smooth functions and associated variational problems. Communications on Pure and Applied Mathematics, 42, 577–685.10.1002/(ISSN)1097-0312
- Rothschild, P., & Grodzins, L. (2001). X-ray back scatter imaging system for undercarriage inspection. Google Patents.
- Saranathan, A. M., & Parente, M. (2016). Uniformity-based superpixel segmentation of hyperspectral images. IEEE Transactions on Geoscience and Remote Sensing, 54, 1419–1430.10.1109/TGRS.2015.2480863
- Sato, H., Nishii, H., & Adachi, S. (1992). Automatic thickness measuring system by image processing for brake shoes of traveling rolling stock (Kawasaki Steel Technical Report, 27).
- Sussman, M., Smereka, P., & Osher, S. (1994). A level set approach for computing solutions to incompressible two-phase flow. Journal of Computational Physics, 114, 146–159.10.1006/jcph.1994.1155
- Terzopoulos, D., Platt, J., Barr, A., & Fleischer, K. (1987). Elastically deformable models. Paper presented at the ACM Siggraph Computer Graphics, New York, NY.
- Wang, L., Xu, Y., & Zhang, J. (2010). Importance analysis on components in railway rolling stock based on fuzzy weighted logarithmic least square method. Paper presented at the 2010 IEEE International Conference on Intelligent Computing and Intelligent Systems (ICIS), Xiamen.
- Yang, Y., Zha, Z.-J., Gao, M., & He, Z. (2016). A robust vision inspection system for detecting surface defects of film capacitors. Signal Processing, 124, 54–62.10.1016/j.sigpro.2015.10.028
- Yun, W. Y., Han, Y. J., & Park, G. (2012). Optimal preventive maintenance interval and spare parts number in a rolling stock system. Paper presented at the 2012 International Conference on Quality, Reliability, Risk, Maintenance, and Safety Engineering (ICQR2MSE), Chengdu.
- Zhang, H., & Li, D. (2014). Applications of computer vision techniques to cotton foreign matter inspection: A review. Computers and Electronics in Agriculture, 109, 59–70.10.1016/j.compag.2014.09.004