
 ?Mathematical formulae have been encoded as MathML and are displayed in this HTML version using MathJax in order to improve their display. Uncheck the box to turn MathJax off. This feature requires Javascript. Click on a formula to zoom.
Abstract
In this study, we investigate an integrated production-inventory system consisting of a single-vendor and single-buyer. The buyer manages its inventory level periodically at a certain period of time. We consider a fuzzy annual demand, imperfect production, inspection errors, partial backordering, and adjustable production rate in the proposed model. Additionally, it is assumed that the protection interval demand follows a normal distribution. The model contributes to the current literature by allowing the inclusion of fuzzy annual demand, adjustable production rate and imperfect production and inspection processes. Our objective is to optimize the number of deliveries from vendor to buyer, the buyer’s review period, and the vendor’s production rate, so that the joint expected total annual cost incurred has the minimum value. Furthermore, an iterative procedure is proposed to find the optimal solutions of the model. We also provide a numerical example and conduct a simple sensitivity analysis to illustrate the model’s behaviour and feasibility. The results from the sensitivity analysis show that the defective rate, type I inspection error, fuzzy annual demand, fixed production cost, variable production cost and setup cost give impacts to both the review period and production rate. Finally, it is concluded that the proposed model can be applied by managers or practitiones for managing inventories across the supply chain involving a vendor and a buyer.
Public Interest Statement
The proposed model is interesting for the practitioners working in a supply chain consisting of a vendor and a buyer. The model can help the practitioners to keep the inventories more efficiently by deciding the optimum review period, production rate and number of deliveries. The model considers a situation where demand is formulated using fuzzy and production rate is assumed to be adjusted flexibly. The vendor’s production process is imperfect and the buyer’s inspection process is not 100% error-free. The buyer uses periodic review to manage his inventory level. An algorithm is proposed to find the decision variables.
1. Introduction
During the recent years, the issue of coordination between vendor and buyer in managing inventories has become more and more important, accompanying the growth of supply chain management. Companies have realised that managing inventories across the entire supply chain through better collaboration are important activities for reducing total cost. The collaboration can be made by integrating the production decision of vendor and the ordering decision of buyer. It has been proven from previous studies that making both decisions jointly will result in a significant cost saving compared to an individual decision. In the literature, the determination of production batch and ordering quantity to consider the benefits of all stages related to the supply chain is called joint economic lot-sizing problem (JELP).
In most of the earlier literature dealing with JELP in a stochastic environment, researchers have considered the annual demand as a fixed constant. In reality, the demand may vary from time to time. The absence of historical data makes it difficult to estimate the probability distribution of the demand. When the demand has an unknown distribution due to lack of data, linguistic-type terms and statements are generally used to describe it (Kao & Hsu, Citation2002; Petrović, Petrović, & Vujošević, Citation1996). Some researchers, including Chang, Yao, and Ouyang (Citation2006), Lin (Citation2008), Garg (Citation2014), Soni and Joshi (Citation2015), Garg (Citation2015), Rong and Maiti (Citation2015) and Kumar and Goswami (Citation2015), developed single-echelon inventory models in a fuzzy-stochastic environment. Then the models were extended by researchers into fuzzy JELP under various assumptions. Taleizadeh, Niaki, and Wee (Citation2013) analysed fuzzy delay time and proposed a hybrid procedure to determine the optimal solutions of their proposed model. Priyan and Uthayakumar (Citation2014) investigated some fuzzy parameters, such as holding cost, hospital’s expiry rate, screening rate and selling price in a JELP under controllable lead time. Mahata (Citation2015) proposed a mathematical model for JELP consisting of a vendor and a buyer with fuzzy order quantity and fuzzy shortage quantity. The above papers, however, assumed that the items produced by the manufacturer are always in good conditions. In fact, the production system is imperfect. Thus, assuming that the items produced by the manufacturer are always perfect is a too restrictive assumption.
In real life, the production process may be imperfect and produces a certain number of defective items with a known probability. Some defective items produced are not successfully inspected by the manufacturer and passed on to the buyer, thereby causing reverse logistics from the buyer back to the manufacturer. A considerable amount of research has been carried out to address the problems of imperfect quality JELP. However, only few researchers have addressed the important issues of handling defects in a stochastic demand environment. Lin (Citation2013) proposed a stochastic JELP involving vendor and buyer in which the production process is imperfect. The buyer conducts a screening process for each incoming lot. Lo (Citation2013) proposed a collaborative business model for the vendor–buyer system under setup cost and lead time reductions. Dey and Giri (Citation2014) studied the effects of defective items and quality improvements in a stochastic vendor–buyer system. The vendor intends to invest some money for reducing the setup cost and lead time. In contrast to the above papers which used a continuous review policy, Lin (Citation2010) proposed an integrated vendor–buyer model under defective items, variable lead time, backorder price discount and periodic review policy. The previous models usually assume that the inspection process done by the buyer is 100% error-free. However, we often obtain a condition where an inspector may classify the defective items as non defective and vice versa. In this paper, we relax the assumption of perfect inspection and take into account the human error factor.
One major drawback of stochastic JELP is that most of the authors assumed that the production rate is set as a constant parameter rather than as a decision variable. Generally, the output of a production system may be influenced by adjusting the performance of production equipment or by inserting idle time between task elements. Thus, allowing the production rate to be adjusted flexibly will lead to some benefits, i.e. increasing system flexibility and reducing total cost. Here, we develop a model which considers the production rate as a variable rather than a constant, thereby causing the lead time to be dependent on both the lot size and production rate.
Based on the above description, it is known that JELP has been discussed in the literature. However, although a considerable number of research papers have already been published incorporating defective items, none has considered fuzzy demand, inspection errors and adjustable production rate simultaneously. This paper contributes to the current literature of JELP in the following ways. Firstly, we address the limitations of Lin’s (Citation2010) model by incorporating inspection errors, in which the review period, number of deliveries and production rate are viewed as decision variables. The protection interval demand is assumed to be normally distributed. We intend to study how the inspections errors can affect the review period and production rate. Secondly, we assume that demand is taken to be fuzzy in nature. We examine how fuzzy demand can affect inventory decisions, especially when the buyer adopts a periodic review policy rather than a continuous review policy. Third, the production rate is considered to be a variable rather than a constant. This assumption will give the vendor an opportunity to adjust its production rate to minimise cost. Furthermore, an iterative solution procedure is developed to determine the optimal values for the decision variables so that the joint total expected annual cost of the respective system is minimized. Finally, a numerical example and sensitivity analysis are presented to illustrate the behaviour of the proposed model.
2. Literature review
During the last decades, many researchers have developed a JELP under various assumptions. Goyal (Citation1976) was probably the first author who introduced the concept of integration between vendor and buyer in the supply chain. The vendor produces a batch of products in an infinite rate and then delivers it to the buyer on a lot-for-lot policy. Later, Banerjee (Citation1986) relaxed the assumption of an infinite production rate used by Goyal (Citation1976) and proposed a finite production rate. Although a significant cost saving can be obtained, however, the vendor always gets benefit while the buyer suffers loss. He proposed a benefit sharing scheme to entice the buyer to adopt an integrated model rather than individual model. Moreover, Goyal (Citation1988) extended Banerjee’s (Citation1986) model by demonstrating that producing a batch which is made of equal shipments generally resulted in lower cost, but the whole batch must be finished before the first shipment can be done. Furthermore, the basic JELP model has been extended into various cases, such as discount policy (Zhou & Wang, Citation2007), imperfect production process (Jaber, Bonney, & Guiffrida, Citation2010; Sana, Citation2011), multi-echelon (Leung, Citation2010; Seliaman & Ahmad, Citation2008), and vendor-managed inventory (Wong, Qi, & Leung, Citation2009; Zhang, Liang, Yu, & Yu, Citation2007).
A stochastic JELP has also received a great deal of attention. An integrated vendor–buyer model with stochastic demand, continuous review policy and variable lead time was firstly studied by Ben-Daya and Hariga (Citation2004). This model was then followed by various models, including, Glock (Citation2009, Citation2012), Jauhari and Pujawan (Citation2014) and Jauhari, Sejati, and Rosyidi (Citation2016). Glock (Citation2009) proposed an unequal shipment policy and showed that the model is better in reducing the total cost compared to the model which adopts an equal shipment policy. Glock (Citation2012) developed a JELP and proposed that the lead time of the first shipment should be calculated by considering production time and transportation time, while the lead time of the next shipment is only based on transportation time. The impact of adjustable production rate was then investigated by Jauhari and Pujawan (Citation2014), while a stochastic JELP under a situation in which the shipper offers freight discount to the buyer was studied by Jauhari, Fitriyani, and Aisyati (Citation2016). In addition, a few researchers investigated JELP under a periodic review policy. Lin and Lin (Citation2016) analysed a periodic review integrated inventory model in which the defective items are recoverable and the ordering cost can be reduced by a capital investment. Later, Tahami, Mirzazadeh, Arshadi-Khamseh, and Gholakami-Qadikolaei (Citation2016) studied the impact of inflationary condition on a JELP under a periodic review policy and imperfect production processes.
In most of aforesaid papers, the production process is assumed to be 100% perfect. In real life situations, however, defective items may be produced due to unreliable process and/or damage in transit. Thus, more researchers have continued to consider defective items in inventory management. Porteus (Citation1986) is among the first ones who investigated the relationship between product quality and lot sizing. Paknejad, Nasri, and Afflsco (Citation1995) proposed an EOQ model with stochastic demand and assumed that there is a random number of defective items. Salameh and Jaber (Citation2000) studied an EOQ model by assuming that each shipment contains some defective items. An inspection process was proposed to screen out the defective items from the lot and the defective items found by the inspector will be sold at a reduced price at the end of the inspection time. Wee, Yu, and Chen (Citation2007) proposed an EPQ model with shortage backordering. Bera, Mahapatra, and Maiti (Citation2009) studied a fuzzy inventory model under learning effect and imperfect production process. The topic of defective items has also been discussed in JELP. The first researcher who incorporated defective items in the vendor–buyer model was Huang (Citation2004). He used an equal shipment policy to deliver the products to the buyer and considered a uniform distribution for the percentage of defective items. Ouyang, Wu, and Ho (Citation2006) developed a vendor–buyer model and investigated situations where defect rate is formulated as a fixed constant and a triangular fuzzy number. There are other related studies such as Khan and Jaber (Citation2011), Alkhedher, Darwish, and Alenezi (Citation2013) and Paul, Wahab et al. Citation(2014). Subsequent studies on JELP were then conducted by incorporating inspection errors. Hsu and Hsu (Citation2012) investigated inspection errors in a two-echelon model involving a vendor and a buyer under deterministic demand. Khan, Jaber, and Ahmad (Citation2014) studied both inspection errors and learning effect in a deterministic vendor–buyer model. Although JELP under imperfect items and inspection errors has been discussed in published papers, however, most authors investigated it in a deterministic environment and neglected a situation in which demand is treated as stochastic.
Demand is another concern in inventory management that has been the focus of various studies. It is generally forecasted using expert opinions or is treated as a specific distribution based on historical data (Gallego & Moon, Citation1993). It is usually difficult for managers to set demand as crisp values due to lack of data, e.g. new product introduction and single period setting. Thus, fuzzy set theory is reasonable to be used to address inventory problems. With the introduction of fuzzy set theory by Zadeh (Citation1978), several inventory problems have been developed and solved with fuzzy demand. Vijayan and Kumaran (Citation2008) proposed inventory models with fuzzy stock-out periods and used the signed distance method for defuzzification. Liu (Citation2012) suggested a solution for the fuzzy production-marketing problem based on the extension principle method. Mahata and Goswami (Citation2013) employed two types of fuzzy numbers which were trapezoidal and triangular to develop inventory models for imperfect items and backorders. While some authors, including Gupta and Singh (Citation2013) and Priyan and Uthayakumar (Citation2016) developed JELP in a fuzzy environment. Gupta and Singh (Citation2013) proposed an integrated model of vendor–buyer and assumed that the variation rate of deterioration, inflation, variable holding cost, production and demand as fuzzy variables. They employed the extension principle to find the membership function of the total cost and used the centroid method to defuzzify the total cost. Furthermore, Priyan and Uthayakumar (Citation2016) developed a multi echelon inventory system with controllable lead time and fuzzy cost environment and used the signed distance method to defuzzify the total cost. Although numerous methods such as centroid method, signed distance method, extension principle method, graded mean integration representation method, etc. have been proposed in the fuzzy inventory literature, however, the issue of choosing the proper method in inventory models is still a subject of active studies. According to Yao and Lee (Citation1999) and Yao and Chiang (Citation2003), the signed distance method is better for defuzzification than any other methods. Thus, in this paper we adopt the signed distance defuzzification method to develop the proposed model. In contrast with previous studies that used a complicated computational process such as centroid method and graded mean integration representation, to handle triangular fuzzy numbers, here, we propose an effective algorithm which is developed under the concept of the signed distance method.
In addition, various types of solution methodologies have been suggested in the fuzzy inventory literature. The method most used by researchers in developing inventory models is classical derivation. Researchers such as, Hu, Zheng, Xu, Ji, and Guo (Citation2010), Chen and Ho (Citation2011), Kumar, Tiwari, and Goswami (Citation2016), Pal, Mahapatra, and Samanta (Citation2014, Citation2015) employed a classical derivation for obtaining the solutions of their proposed models. However, this solution approach cannot be used to solve large-scale and complicated mathematical models. Thus, researchers employed other types of solution approaches, such as genetic algorithm (Chakraborty, Jana, & Roy, Citation2015; Sadeghi & Niaki, Citation2015; Sadeghi, Sadeghi, & Niaki, Citation2014), generalized reduced gradient technique (Bag, Chakraborty, & Roy, Citation2009; Jana, Maity, Das, & Roy, Citation2013; Mandal, Maity, Mondal, & Maiti, Citation2010), geometric programming technique (Mahapatra, Mandal, & Samanta, Citation2011; Paul, Azeem et al., Citation2014; Samadi, Mirzazadeh, & Pedram, Citation2013) and karush-kuhn-tucher theorem (Maity, Citation2011; Soni & Patel, Citation2014) to obtain the solutions. Each solution approach appears to have some advantages as well as disadvantages. In each context, some approaches seem more appropriate than the others. In this paper, we propose an effective and efficient procedure based on the basic algorithm of Ben-Daya and Hariga (Citation2004) for solving the problem. This kind of procedure is powerful and widely used by many researchers (Glock, Citation2012; Hsiao, Citation2008; Jauhari, Fitriyani, et al., Citation2016; Kurdhi, Lestari, & Susanti, Citation2015) for determining the solutions of stochastic JELP.
The above discussion shows that JELP has been discussed in the past, but none has studied the impact of incorporating fuzzy demand, defective items, inspection errors, adjustable production rate and periodic review policy simultaneously. Thus, the interdependencies between these decision variables are not yet well understood. In this paper, a JELP consisting of a vendor and a buyer with imperfect items, inspection errors, stochastic demand, fuzzy annual demand, adjustable production rate and partial backorder is developed. Our study is different from the preceding studies in the following constructs: (1) the annual demand is assumed to be fuzzy while in the previous research, the annual demand is treated as constant, (2) both production process and inspection process are assumed to be imperfect while in the previous research, only one of them is assumed to be imperfect, (3) the production rate is controllable by decision makers while in the previous research, it is assumed to be a fixed constant, (4) a periodic review policy is adopted to manage the buyer’s inventory level while in published stochastic JELP, a continuous review policy is more often chosen by researchers, (5) shortages are assumed to be partially backordered while in most published research, they are considered to be fully backordered. For better understanding, a comparison of the proposed model with some of the related papers in the inventory literature is provided in Table .
Table 1. A comparison of the proposed model and some of the published stochastic JELPs
3. Notations and assumptions
3.1. Notations
The notations used to develop the model are listed below.
| D: | = | demand rate (units/year) |
| Cb: | = | unit purchasing cost ($/unit) |
| T: | = | review period (year) |
| F: | = | transportation cost ($/shipment) |
| b: | = | transportation time (year) |
| A: | = | ordering cost ($/order) |
| S: | = | setup cost ($/setup) |
| P: | = | production rate (units/year) |
| n: | = | number of deliveries |
| γ: | = | probability of defect |
| cab: | = | buyer’s cost of a post-sale defective item ($/unit) |
| ci: | = | inspection cost ($/unit) |
| cav: | = | vendor’s cost of a post-sale defective item ($/unit) |
| cr: | = | cost of false rejection of non-defective item ($/unit) |
| cw: | = | vendor’s warranty cost for producing defective item ($/unit) |
| e1: | = | probability of type I inspection error (classifying a non-defective item as defective) |
| e2: | = | probability of type II inspection error (classifying a defective item as non-defective) |
| a1: | = | fixed production cost ($) |
| a2: | = | variable production cost ($/unit) |
| π: | = | backorder cost ($/unit) |
| π0: | = | marginal profit ($/unit) |
| k: | = | safety factor |
| β: | = | backorder ratio |
| hb: | = | holding cost for buyer ($/unit/year) |
| hv: | = | holding cost for vendor ($/unit/year) |
| x: | = | demand during T period (unit) |
| y+: | = | maximum value of y and 0, i.e. y+ = max{y,0} |
| TCb: | = | total cost for buyer ($/year) |
| TCv: | = | total cost for vendor ($/year) |
| JTC: | = | joint total cost ($/year) |
3.2. Assumptions
The assumptions used to develop the model are:
| (1) | The system consists of only one vendor and one buyer with a single-product. | ||||
| (2) | The buyer uses periodic review to control the inventory level. | ||||
| (3) | The demand in the buyer side is assumed to be normally distributed with a mean D and standard deviation σ. | ||||
| (4) | The buyer orders DT units from the vendor and then the vendor manufactures nDT items with a finite production rate. The vendor incurs a setup cost S for each production run and the buyer incurs an ordering cost A for each order. The transportation cost F is charged to the buyer for each delivery of DT units. | ||||
| (5) | Each arriving shipment lot contains some defective items with a defective rate γ. Upon arrival of a shipment, all items will be screened by the buyer. | ||||
| (6) | The screening process is imperfect. The inspector may incorrectly classify the quality of the items. | ||||
| (7) | The shortage is assumed to be partially backordered. | ||||
| (8) | The vendor has an opportunity to adjust the production rate between Pmin and Pmax. | ||||
4. Model development
As mentioned in the above section, we intend to develop an integrated inventory model consisting of single-vendor and single-buyer with stochastic demand, imperfect items and inspection errors. The periodic review policy is adopted by the buyer to manage the inventory level. The costs considered in this model include holding cost, transportation cost, ordering cost, purchasing cost, inspection cost, production cost, setup cost, warranty cost, shortage cost, cost of type I error and post-sales failure cost (cost of type II error). Here, we briefly describe the development of the total cost for the buyer, vendor and the supply chain system, respectively.
4.1. Buyer’s total cost (TCb)
Buyer’s total cost consists of ordering cost, purchasing cost, transportation cost, holding cost, shortage cost, post-sales failure cost and inspection cost. Ordering cost can be calculated by multiplying the ordering cost per batch (A) and the order frequency (1/T). Purchasing cost can be formulated by multiplying the unit purchasing cost (Cb) and demand (D). Transportation cost can be formulated by multiplying the transportation cost per shipment (F) and the delivery frequency (1/T). The ordering cost, purchasing cost and transportation cost are shown in Equations (1)–(3), respectively.(1)
(1)
(2)
(2)
(3)
(3)
The lot received by the buyer contains non-defective products and defective products. The buyer holds an inspection process to categorize non-defective products and defective products. The inspection process is imperfect. There are two types of error that are type I error and type II error. The type I error is occurred by categorizing non-defective products as defective products while the type II error is occurred by categorizing defective products as non-defective products. Defective products that pass the inspection process can be sold to end customers. End customers who detect the quality problems will return the products to the buyer. All the items classified by the inspector as defective items and all the items returned from end customers are sent back to the vendor in a single batch. The vendor then gives a full price refund to the buyer for each item returned. Because of this, the vendor and the buyer endure a loss called post-sales failure cost. The holding cost consists of the costs for holding non-defective products and defective products that are found by the inspector as well as for returned products from end customers. We adopt the formulation from Lin (Citation2010) and Hsu and Hsu (Citation2012) for developing the holding cost. The inspection cost can be formulated by multiplying the inspection cost per unit (Ci) and demand (D). The post-sales failure cost for the buyer can be calculated by multiplying the buyer’s post-sales failure cost of an item (cab), probability that an item is defective (γ), probability of type II error (e2), and demand (D). The holding cost, inspection cost and post-sales failure cost related to the buyer can be seen in Equations (4)–(6), respectively.(4)
(4)
(5)
(5)
(6)
(6)
We regard that demand during protection period is normally distributed with a mean D(T + L) and standard deviation . By examining that the lead time L is DT/P + b, so the target level
. The expected demand shortage at the end of the cycle period is adopted from Jauhari, Sejati, et al. Citation(2016), which is
(7)
(7)
(8)
(8)
The expected backorder and the expected lost sales are expressed by Equations (9) and (10), respectively.(9)
(9)
(10)
(10)
Thus, by considering the above expressions, the expected shortage cost is given by the following equation(11)
(11)
By examining the above costs, the total cost for the buyer can be formulated as(12)
(12)
4.2. Vendor’s total cost (TCv)
Vendor’s total cost consists of setup cost, production cost, warranty cost, type I error cost, vendor’s post sales failure cost, and holding cost. The setup cost can be formulated by considering the setup cost (S) and setup frequency (1/nT). Equation (13) expresses the vendor’s setup cost per year(13)
(13)
The production cost is developed as a function of production rate. To develop the production cost, here, we adopt the formulation from Khouja and Mehrez (Citation1994), which is(14)
(14)
During the production process, the vendor produces DT units in the first instance and deliver these to the buyer. After that, the vendor will make the delivery on the average every T unit of time until the inventory level falls to zero. The average inventory level for the vendor can be determined by subtracting the accumulative delivery from the vendor’s accumulated inventory, which is
(15)
(15)
Thus, the holding cost for the vendor can be expressed as follows:(16)
(16)
Moreover, the vendor also endures type I error cost, warranty cost and post-sales failure cost. The type I error cost is incurred by the vendor as a result of the inspector’s mistake in categorizing non-defective products as defective products. The type I error cost can be computed by multiplying the cost per unit of rejecting non-defective products (cr), the probability that item is non-defective (1 − γ), probability of type I error (e1), and demand (D). The warranty cost is incurred by the vendor to endure the consequences of producing defective products. The warranty cost can be calculated by multiplying the warranty cost per unit (cw), probability of defect (γ), and demand (D). The post-sales failure cost can be formulated by multiplying the vendor’s post-sales failure cost per unit (cav), the probability of defect (γ), probability of type II error (e2), and demand (D). The cost of type I error, warranty cost, and post-sales failure cost are shown by Equations (17)–(19), respectively.(17)
(17)
(18)
(18)
(19)
(19)
Hence, the vendor’s total cost can be expressed by the following equation
(20)
(20)
4.3. Joint total cost (JTC)
In this paper, the vendor and the buyer coordinate their production and inventory decisions with each other to determine the best policy for their supply chain system. The joint total cost for this system is formulated by adding the vendor’s total cost and buyer’s total cost. Thus, we have the joint total cost formulation as follows.(21)
(21)
In real conditions, it is actually quite difficult to determine the annual demand because of various uncertainties that may influence the system (Fergany, Ezzat & Gawdt, Citation2011). Uncertainties happen when the annual demand faces fluctuation from a perfect market competition that hinders the decision-maker to assess it by using a crisp value of D. However, it becomes more reasonable if the annual demand is located in an interval [D − z1, D + z2], where z1 and z2 are determined by decision makers. Let D be a known number. The decision makers want to select a suitable value in the interval [D – z1, D + z2] as an appropriate estimate of the annual demand. If the value selected coincides with D, then the error is 0. The error is getting bigger when the value deviates from D from both sides of D. The maximum error will be attained at the two endpoints D – z1 and D + z2. From the fuzzy point of view, we can transform the error to a confidence level. If the error is 0, the confidence level is 1. The confidence level is getting smaller when the value deviates farther from both sides of D. At the two endpoints D − z1 and D + z2, the confidence level will attain the minimum.
According to the arguments above, corresponding to the interval [D − z1, D + z2], we fuzzify D to be a triangular fuzzy number, = (D − z1, D, D + z2), where 0 ≤ z1 ≤ D and 0 ≤ z2. The membership grade of D in
is 1. The farther the point in [D − z1, D + z2] is from both sides of D, the less the membership grade is. The membership grade serves the same property with the confidence level. If we make a correspondence between membership grade and confidence level, it is reasonable to set a fuzzy number
corresponding to the interval [D − z1, D + z2]. Since D is fuzzified to be
, the joint total cost is also a fuzzy value, that is expressed by:
(22)
(22)
subject to Pmin ≤ P ≤ Pmax and n ≥ 1.
Next, we defuzzify by using the signed distance method. The signed distance of
is given by
(23)
(23)
From Equation (23), needs to be defuzzified by using the signed distance method and the following definition:
Definition 1
For the fuzzy set where
is called the α-cut of
.
is a non-empty bounded closed interval contained in a set of real numbers and it can be denoted by
, where
and
are respectively the lower and upper limits of
and are usually known as the left and right α-cuts of
.
It is known that for any a and 0 ∊ R, the signed distance from a to 0 is . If a < 0, the distance from a to 0 is
. If a > 0, then the distance from a to 0 is
. Let ξ be the family of all fuzzy sets
defined in R for which the α-cut D(α) = [DL(α), DU(α)] exists for every
. Both DL(α) and DU(α) are continuous functions in
. Then it can be said that for any
, we have
. Hence, for
the signed distance from
to
can be defined as:
For a triangular fuzzy number , the α-cut of
is
for
, where
and
. The signed distance from
to
is:
Therefore, the signed distance from to
is
(24)
(24)
By substituting Equations (24) to (23), we have(25)
(25)
subject to Pmin ≤ P ≤ Pmax and n ≥ 1.
5. Solution methodology
In order to determine the optimal solutions of problem (25), we minimize the joint expected total annual cost over T, P, n with a classical optimization technique by taking the first partial derivatives of JTC(T, P, n) with respect to P and T, respectively. We obtain that(26)
(26)
(27)
(27)
By setting Equations (26) and (27) equal to zero and solving the equations, then we have(28)
(28)
If the value of is negative, the above equation may not result in the feasible solutions. Hence, we have to set P = Pmin, if
By examining this situation, Equation (28) can be described as
(29)
(29)
Thus, we obtain the formulation of T as follows(30)
(30)
Theoretically, the values of P* and T* can be obtained from (29) and (30). However, it is difficult to verify analytically that the joint expected total annual cost is a convex function. Hence, we need to note that the solutions obtained by the proposed procedure cannot be claimed as a global optimal solution. The proposed procedure only guarantees a local optimal solution. Nevertheless, many researchers have utilized an identical method to find the optimal solutions through certain similar procedures. Therefore, the proposed algorithm can be considered as one of the methods to obtain the optimal solutions. The proposed algorithm is different from the previous algorithm proposed by Ben-Daya and Hariga (Citation2004) which is usually used for solving a JELP under a stochastic environment. First, the proposed algorithm provides a feature for decision makers to decide the values of z1 and z2 and to calculate based on the signed distance method. Second, the proposed algorithm is used to find the optimal values of T and P while the previous algorithm is suggested to find the optimal values of Q and k. For a stochastic JELP with adjustable production rate, the optimal value of P should be obtained in the range between Pmin and Pmax.
From the above derivations, it is clear that the decision variables P and T are dependent on each other. The proposed solution procedure is started by setting the fuzzy demand to get the crisp value of D. Then, we set the initial value of P with . The initial value of T is decided by setting the stochastic parameters in Equation (30) equal to zero. Next, the initial value of T is utilized to update the value of P. This procedure is followed until an appropriately stable solution is attained. The proposed solution procedure is presented in Figure while some parts of the codes are listed below.
Figure 1. The flowchart of the proposed procedure.
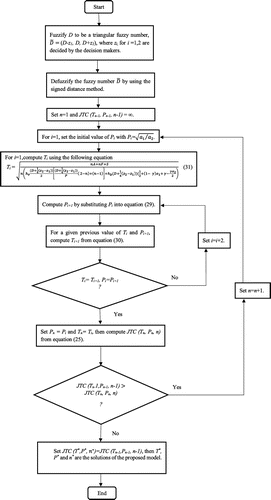
input: all inventory parameters
output: Best_n, Best_T and Best_P
n=1;
x=2;
JTC(x-1)=inf;
set the values of z1 and z2
compute ;
while stop=0
compute P(1);
compute T(1)
compute P(2);
compute T(2);
i=2;
while T(i)≠T(i-1) or P(i) ≠P(i-1)
i=i+1;
compute P(i);
compute T(i);
end
compute P(n);
compute T(n);
compute JTC(x);
if JTC(x)<JTC(x-1)
n=n+1;
x=x+1;
else
stop=1;
end
end
Best_JTC=JTC(x-1);
Best_n=(n-1);
Best_P=P(n-1);
Best_T=T(n-1);
6. Results and discussion
To illustrate the above solution procedure we provide a numerical example as well as sensitivity analysis to examine the behavior of the proposed model. The following input parameters are adopted from Jauhari, Sejati, et al. Citation(2016), Hsu and Hsu (Citation2012), and Kurdhi et al. (Citation2015). D = 1,000 units/year, z1 = 100, z2 = 50, σ = 5 units/year, a1 = $2,500/batch, a2 = $1/2,500/unit, F = $25/delivery, A = $50/order, S = $400/setup, hv = $3/unit/year, hb = $5/ unit/year, cav = $300/unit, cab = $200/unit, k = 1.645, b = 1/12 year, Cb = $65/unit, ci = $0.5/ unit, cr = $100/unit, cw = $50/unit, e1 = 0.04, e2 = 0.04, β = 0.4, γ = 0.005, π = $15/unit, π0 = $45/unit, Pmin = 1,500, Pmax = 5,000. By using the solution procedure explained in the previous section, the optimal value for each decision variable can be derived. The optimization results are shown in Table .
Table 2. Optimization results for the fuzzy integrated model
The optimization results presented in Table show that JTC is minimum for n = 4 hence, the iteration will stop at n = 5 and does not continue to a higher value of n. Therefore, the optimal values of n*, T*, and P*, satisfying the proposed solution procedure, are 4 deliveries, 0.1768 years (65 days), and 2,233 units which can minimize the value of JTC at $122,104.
The next section presents the sensitivity analysis to investigate the behavior of the model when there is only one change in parameters, including γ, e1, e2, β, z1, z2, a1, a2 and S, while the other parameters remain unchanged. Investigations are done by observing the optimal values of decision variables (n*, T*, P*), and also the effects on the objective function, JTC. Table shows the effects of an increase in γ, in a range from 0.005 to 0.05, on n*, T*, P*, TCv, TCb, and JTC, while the other parameters remain unchanged. From the results, it can be seen that as defective rate (γ) increases, TCv and TCb will eventually be higher, which cause JTC to be higher as well. As explained in the previous section, γ denotes the proportion of defect, which in turn indicates the amount of defective products in the system.
Table 3. The impact of the changes in defective rate (γ) on the proposed model
The greater the amount of defective products, the higher the costs of type I and type II errors, and warranty, which end up in a substantial increase in cost that must be paid by both parties. A system that has a high level of defective rate means that the system itself has a poor capability in meeting the product specification. The inspection process may be interrupted, since the inspector tends to make more mistakes as the amount of defective products increases. Consequently, it will result in a higher cost of errors I and II and higher amount of defective products sold to the consumers. The end customers will have the intention to bring a product back to the buyer, since they are actually allowed to return it, in case they really found it to be defective. Hence, it will eventually increase the costs of warranty and post-sales failure as well. However, the increase in the value of γ does not significantly affect the optimum values of n*, T*, and P*. It can be seen from the results presented in Table . As the value of γ increases from 0.005 to 0.05, which is ten times greater, the values of n*, T*, and P* do not vary substantially. It indicates that the model decisions are not significantly affected by the value of γ.
Table summarises the effect of variations of probability of type I error (e1) on the proposed model. The results show that the variation of e1 affects the values of TCv, TCb, and JTC as well as T* and P*. The higher the value of e1, the higher the cost of rejecting non-defective products (type I inspection error cost) and the cost of warranty, which lead to an increase in TCv and JTC. As previously explained, the cost of rejecting non-defective products is the cost incurred by the vendor as a result of the inspector’s mistake to categorize non-defective products as defective products with the probability of e1. A higher value of e1 means that the probability of the inspector to make a mistake is higher, which ends up in a greater amount of defective products returned by the buyer to the vendor. Therefore, it will inevitably cause a higher warranty cost as a form of refund from the vendor to the buyer. From Table , it can also be seen that the buyer cost continually increases as e1 adopts higher values. Some of the model’s decision variables, which are T* and P*, also vary when the value of e1 is set to be higher.
Table 4. The impact of the changes in probability of type I error on the proposed model
Nevertheless, the optimal number of deliveries (n*) remains unchanged. The review period is gradually decreased in the percentage of 0.4–3.7% (about 11–13 days). Whereas, the optimal production rate per year increases in the percentage of 0.06–0.5% (about 2–12 units) when the value of e1 becomes higher. Accordingly, the results show an effect on the decision variables since the values vary for about 0.4–3.7% when the parameter e1 is changed up to 10 times higher. It implies that the proposed model is affected by the variation of the parameter e1.
The numerical results for the impact of changes in probability of type II error (e2) are presented in Table . As formerly defined, type II error refers to any error made by the buyer’s inspector in categorizing defective products as non-defective products with a probability equal to e2. A higher probability of type II error will lead to a higher amount of defective products that are returned from end customers to the buyer. This will subsequently result in a post-sales failure cost that must be paid by the buyer to end consumers. Moreover, the buyer may lose the trust of final consumers, which leads to poorer demand. The results in Table show that the higher the value of e2, the higher the costs related to vendors and buyers which result in a higher JTC. The increases are majorly caused by the post-sales failure costs incurred by the vendor and the buyer, which substantially cause JTC to be higher. However, the percentages of increases are lower than those in Table and Table . The model’s decisions, i.e. number of deliveries (n*), review time (T*), and production rate (P*), are respectively insensitive to the changes in e2. Hence, we can conclude that the proposed model is insensitive to the changes in probability of type II error.
Table 5. The impact of the changes in probability of type II error on the proposed model (for e1 = 0.04)
From the discussion above, we point out an interesting note that the inspection errors actually affect cost components. As has been investigated in our reference model, which is the model of Jauhari (Citation2016), we also conclude that the cost of misclassification, both false rejection and false acceptance, will contribute to a higher vendor cost, buyer cost, and joint total cost, respectively. The changes in e1 deliver a higher percentage of increases of the costs than the changes in e2. This explains that false rejection turns out to give a greater effect in terms of inventory cost rather than false acceptance. These findings may suggest the managerial team to be more cautious in controlling the parameter of type I inspection error to keep the cost down.
The proposed model allows any shortage that may be experienced by the buyer in the form of a partial backorder. The related cost is incurred by the buyer for the amount of expected demand shortage at the end of each cycle period. As presented in Table , the changes in the backorder ratio (β) actually do not give any significant effect to the model. When β is increased continually, for the range of 0.1 to 0.9, the buyer cost and total cost decrease slightly while the vendor cost is somewhat constant, as well as n* and P* which also indicate the same value. Another finding is that the joint total cost is minimum when shortages are fully backordered. Otherwise, when shortages are fully considered as lost sales, the joint total cost has the maximum value. Hence, we can suggest that it would be more economical to backorder all the shortages compared to treating them as a lost sale.
Table 6. The impact of the changes in backorder ratio (β) on the proposed model
Fuzzy number denotes a number that affects the crisp value level to determine the fuzzy demand rate. The values itself is set by the decision-maker based on the trend of the demand. Tables and present the sensitivity analysis results of changes in the values of z1 and z2 on the proposed model, respectively. The increased values of z1 and z2 result in the same value of n*. In addition, when the value of z1 is increased continually, the values of TCv, TCb, and JTC are decreased. Whereas, when the value of z2 is increased, the values of TCv, TCb, and JTC are increased. Hence, we can point out that the changes in z1 and z2 give different impacts to the model, yet the impacts from both parameters are equally significant.
Table 7. The impact of the changes in z1 on the proposed model (for z2 = 50)
Table 8. The impact of the changes in z2 on the proposed model (for z1 = 100)
Tables and summarise the results of the changes in fixed production cost (a1) and variable production cost (a2) on the proposed model. Both parameters show different influence on the model’s decision variables and JTC, yet the impacts are not equally significant. The increases in a1 will substantially change the optimal values of n*, T*, and P*. Moreover, we actually found an interesting result. The increases of a1, from 2,100 to 2,200, will increase the value of T* yet the value will gradually be lower for the increases of a1 from 2,200 to 2,900. It is caused by the change in n*, from 5 to 4 deliveries only. The impacts on T* ranged from 8.96 to 11.14%, while the impacts on P* ranged from 9.59 to 30.63% and these suggest that the review period and production rate remain sensitive to the changes in fixed production costs. Whereas, the increases in variable production cost (a2), will gradually increase the value of T* in the range of 0.17 to 1.88% and decrease the value of P* in the range of 1.77 to 15.12%. From these results, we can conclude that a1 gives greater impacts on the model than a2. It can be a suggestion for the managerial team to be more careful in controlling the parameter a1 rather than a2, since a1 has a greater effect on the model.
Table 9. The impact of the changes in fixed production cost (a1) on proposed model (for a2 = 1/2,500)
Table 10. The impact of the changes in variable production cost (a2) on the proposed model (for a1 = 2,500)
Production setup cost (S) is a cost incurred by the vendor and must be paid in order to run one production cycle. The sensitivity analysis result of the changes in S on the proposed model is shown in Table . From these results, one can see that a higher value of S will eventually lead to a higher vendor cost as well as joint total cost. The increases in TCv, as a result of changes in S, ranged from 0.45 to 2.04%. It indicates that the model is sensitive to the changes in production setup cost. The value of n* tends to be higher as the value of S increases. This implies that it will be more economical for the vendor to send more number of shipments if the production setup cost is high. To minimise the joint total cost, the model will determine a lower value of T* and P*, as S increases. It suggests that the vendor should produce less units of product and the buyer should take a shorter review period when the production setup cost is increased.
Table 11. The impact of the changes in setup cost (S) on the proposed model
In short, some managerial insights can be obtained from the results of this study. The model is more realistic and applicable since it considers factors such as fuzzy demand, defective items, inspection errors and adjustable production rate which are commonly found in the real world. This model can help managers to keep the supply chain inventories more efficiently. It can assists managers to decide the optimum review period and level of production rate. Furthermore, it may also give guidance to managers to reduce the risk of type I inspection errors and defective rate by altering the review period.
7. Conclusion and future research directions
This study presented a model that extends the model of Lin (Citation2010) by addressing more considerations, including fuzzy annual demand, stochastic demand, inspection error, partial backorder, and adjustable production rate. Previous studies on this problem have only considered common stochastic demand using a probability density function with a known finite mean and standard deviation. Whereas in real situations, there are certain types of product that not only follow stochastic demand, but also have fuzzy annual demand. In this study we considered that the annual demand is represented by a triangular fuzzy number. We developed a JELP inventory model for the system consisting of a vendor and a buyer, with a periodic review inventory control. We minimized the integrated joint total cost by determining the optimal number of deliveries, the optimal buyer review period, and the optimal vendor production rate. We also considered a partial backorder for the amount of expected inventory shortages per year as well as inspection error faced by the buyer. Since the production process conducted by the vendor is not always perfect, the screening process is needed to classify the products into non-defective or defective ones. In addition, the inspection process itself is not perfect. There are some errors caused by the inspector’s fault in categorizing a product to be non-defective or defective. The proposed mathematical inventory model has been presented herein. We suggested an iterative procedure to find the local optimum solution and gave an numerical example along with sensitivity analysis to study the behaviour of the model in dealing with uncertainty of the values of some uncontrollable parameters in the real system.
The results show that the influential parameters that give a significant effect to the model are for example, the parameters of fuzzy annual demand (z1 and z2) and vendor production setup cost (S). Therefore, the determination of z1 and z2 by decision makers must be in accordance with the actual uncertain annual demand trend in the real market. The decision makers also need to control the production setup cost since the change in this parameter affects the model decisions.
Finally, future research can be done by including more parties in the supply chain, such as 3PL, wholesaler, and/or retailer into the investigated system. The inspection process can be performed on the vendor side or perhaps on both sides, since each party actually has its own acceptable quality level. Moreover, the inventory cost function formulated in this study can be developed further to show the interdependencies between production rate, quality of product, and carbon emission that may be emitted to the environment as a consequence from the production process. Other interesting points are to accommodate other treatments, such as recovery, repair, or remanufacture, for defective products that are returned to the vendor and also to implement a policy related to customer reward, as a form of discounted price, for those who are willing to do backordering.
Funding
The authors received no direct funding for this research.
Additional information
Notes on contributors
Wakhid Ahmad Jauhari
Wakhid Ahmad Jauhari is currently a Lecturer in Sebelas Maret University. He obtained Bachelor and Master degrees, both in Industrial Engineering, from Sepuluh Nopember Institute of Technology (ITS) in Surabaya. His research’s interests include modelling inventory, supply chain management and manufacturing design.
Selvia Mayangsari
Selvia Mayangsari is a researcher in Production System Laboratory, Sebelas Maret University. Her research interests are inventory management, production management and operations research.
Nughthoh Arfawi Kurdhi
Nughthoh Arfawi Kurdhi received his BS degree from Sebelas Maret University (2007), Indonesia, and MS degree from Gadjah Mada University (2010), Indonesia, both in Applied Mathematics. He is working as a lecturer in the Mathematics Department at Sebelas Maret University. His research interests include operations research, supply chain management and combinatorics.
Kuan Yew Wong
Kuan Yew Wong holds a PhD from the University of Birmingham, United Kingdom. He is a Professor and the Head of the Industrial and Systems Engineering Research Group in Universiti Teknologi Malaysia (UTM), Skudai, Malaysia. He is also a Chartered Engineer and Fellow of the British Computer Society.
Related Research Data
References
- Alkhedher, M. J., Darwish, M. A., & Alenezi, A. R. (2013). Stochastic inventory model for imperfect production processes. International Journal of Logistics Systems and Management, 15, 32–46.10.1504/IJLSM.2013.053237
- Bag, S., Chakraborty, D., & Roy, A. (2009). A production-inventory model with fuzzy random demand and with flexibility and reliability considerations. Computers & Industrial Engineering, 56, 411–416.10.1016/j.cie.2008.07.001
- Banerjee, A. (1986). A joint economic-lot-size model for purchaser and vendor. Decision Sciences, 17, 292–311.10.1111/deci.1986.17.issue-3
- Ben-Daya, M., & Hariga, M. (2004). Integrated single vendor single buyer model with stochastic demand and variable lead time. International Journal of Production Economics, 92, 75–80.doi: 10.1016/j.ijpe.2003.09.012
- Bera, U. K., Mahapatra, N. K., & Maiti, M. (2009). An imperfect fuzzy production-inventory model over a finite time horizon under the effect of learning. International Journal of Mathematics in Operational Research, 1, 351–371.10.1504/IJMOR.2009.024290
- Chakraborty, D., Jana, D. K., & Roy, T. K. (2015). Multi-item integrated supply chain model for deteriorating items with stock dependent demand under fuzzy random and bifuzzy environments. Computers & Industrial Engineering, 88, 166–180.10.1016/j.cie.2015.06.022
- Chang, H. C., Yao, J. S., & Ouyang, L. Y. (2006). Fuzzy mixture inventory model involving fuzzy random variable lead time demand and fuzzy total demand. European Journal of Operational Research, 169, 65–80.10.1016/j.ejor.2004.04.044
- Chen, S. P., & Ho, Y. H. (2011). Analysis of the newsboy problem with fuzzy demands and incremental discounts. International Journal of Production Economics, 129, 169–177.10.1016/j.ijpe.2010.09.014
- Dey, O., & Giri, B. C. (2014). Optimal vendor investment for reducing defect rate in a vendor–buyer integrated system with imperfect production process. International Journal of Production Economics, 155, 222–228.10.1016/j.ijpe.2014.02.004
- Fergany, H. A., Ezzat, M. M., & Gawdt, O. A. (2011). Continuous review inventory model with crashing cost under service level constraint and probabilistic fuzzy numbers. Advanced Modeling and Optimization, 13, 6–11.
- Gallego, G., & Moon, I. (1993). The distribution free newsboy problem: Review and extensions. Journal of the Operational Research Society, 44, 825–834.10.1057/jors.1993.141
- Garg, H. (2014, December 1–12). Inventory model involving variable lead time, back-order discounts and lost sales using PSO. 18th Online World conference on Soft Computing in Industrial Application (WSC18), World Wide Web.
- Garg, H. (2015). Fuzzy inventory models for deteriorating items under different types of lead-time distributions. Intelligent Techniques in Engineering Management, Chapter, 11, 247–274.
- Glock, C. H. (2009). A comment: Integrated single vendor-single buyer model with stochasticdemand and variable lead time. International Journal of Production Economics, 122, 790–792.10.1016/j.ijpe.2009.06.032
- Glock, C. H. (2012). The joint economic lot size problem: A review. International Journal of Production Economics, 135, 671–686.10.1016/j.ijpe.2011.10.026
- Goyal, S. K. (1976). An integrated inventory model for a single supplier-single customer problem. International Journal of Production Research, 15, 107–111.
- Goyal, S. K. (1988). A joint economic-lot-size model for purchaser and vendor: A comment. Decision Sciences, 19, 236–241.10.1111/deci.1988.19.issue-1
- Gupta, V., & Singh, S. R. (2013). An integrated inventory model with fuzzy variables, three parameter Weibull deterioration and variable holding cost under inflation. International Journal of Operational Research, 18, 452–466.
- Hsiao, Y. C. (2008). A note on integrated single vendor single buyer with stochastic demand and variable lead time. International Journal of Production Economics, 114, 294–297.
- Hsu, J. T., & Hsu, L. F. (2012). An integrated single-vendor single-buyer production-inventory model for items with imperfect quality and inspection errors. International Journal of Industrial Engineering Computations, 3, 703–720.10.5267/j.ijiec
- Hu, J. S., Zheng, H., Xu, R. Q., Ji, Y. P., & Guo, C. Y. (2010). Supply chain coordination for fuzzy random newsboy problem with imperfect quality. International Journal of Approximate Reasoning, 51, 771–784.10.1016/j.ijar.2010.04.002
- Huang, C. K. (2004). An optimal policy for a single-vendor single-buyer integrated production inventory problem with process unreliability consideration. International Journal of Production Economics, 91, 91–98.10.1016/S0925-5273(03)00220-2
- Jaber, M. Y., Bonney, M., & Guiffrida, A. L. (2010). Coordinating a three-level supply chain with learning-based continuous improvement. International Journal of Production Economics, 127, 27–38.10.1016/j.ijpe.2010.04.010
- Jana, D. K., Maity, K., Das, B., & Roy, T. K. (2013). A fuzzy simulation via contractive mapping genetic algorithm approach to an imprecise production inventory model under volume flexibility. Journal of Simulation, 7, 90–100.10.1057/jos.2012.23
- Jauhari, W. A. (2016). Integrated vendor-buyer model with defective items, inspection error and stochastic demand. International Journal of Mathematics in Operational Research, 8, 342–359.
- Jauhari, W. A., Fitriyani, A., & Aisyati, A. (2016). An integrated inventory model for single-vendor single-buyer system with freight rate discount and stochastic demand. International Journal of Operational Research, 25, 327–350.10.1504/IJOR.2016.074757
- Jauhari, W. A., & Pujawan, I. N. (2014). Joint economic lot size (JELS) model for single-vendor single-buyer with variable production rate and partial backorder. International Journal of Operational Research, 10, 442–457.
- Jauhari, W. A., Sejati, N., & Rosyidi, C. N. (2016). A collaborative supply chain inventory model with defective items, adjusted production rate and variable lead time. International Journal of Procurement Management, 9, 733–750.10.1504/IJPM.2016.079983
- Kao, C., & Hsu, W. K. (2002). A single period inventory model with fuzzy demand. Computers & Mathematics with Applications, 43, 841–848.10.1016/S0898-1221(01)00325-X
- Khan, M., & Jaber, M. Y. (2011). Optimal inventory cycle in a two-stage supply chain incorporating imperfect items from suppliers. International Journal of Operational Research, 20, 91–108.
- Khan, M., Jaber, M. Y., & Ahmad, A. R. (2014). An integrated supply chain model with errors in quality inspection and learning in production. Omega, 42, 16–24.10.1016/j.omega.2013.02.002
- Khouja, M., & Mehrez, A. (1994). Economic production lot size model with variable production rate and imperfect quality. Journal of the Operational Research Society, 45, 1405–1417.10.1057/jors.1994.217
- Kumar, R. S., & Goswami, A. (2015). A continuous review production–inventory system in fuzzy random environment: Minmax distribution free procedure. Computers & Industrial Engineering, 79, 65–75.10.1016/j.cie.2014.10.022
- Kumar, R. S., Tiwari, M., & Goswami, A. (2016). Two-echelon fuzzy stochastic supply chain for manufacturer-buyer integrated production-inventory system. Journal of Intelligent Manufacturing, 27, 875–888.10.1007/s10845-014-0921-8
- Kurdhi, N. A., Lestari, S. M. P., & Susanti, Y. (2015). A fuzzy collaborative supply chain inventory model with controllable setup cost and service level constraint for imperfect items. International Journal of Applied Management Science, 7, 93–122.10.1504/IJAMS.2015.069265
- Leung, K. N. F. (2010). An integrated production-inventory system in a multi-stage multi-firm supply chain. Transportation Research Part E: Logistics and Transportation Review, 46, 32–48.10.1016/j.tre.2009.06.003
- Lin, H. J. (2013). An integrated supply chain inventory model with imperfect-quality items, controllable lead time and distribution-free demand. Yugoslav Journal of Operations Research, 23, 87–109.10.2298/YJOR110506019L
- Lin, Y. J. (2008). A periodic review inventory model involving fuzzy expected demand short and fuzzy backorder rate. Computers & Industrial Engineering, 54, 666–676.10.1016/j.cie.2007.10.002
- Lin, Y. J. (2010). A stochastic periodic review integrated inventory model involving defective items, backorder price discount, and variable lead time. 4OR, 8, 281–297.10.1007/s10288-010-0124-x
- Lin, Y. J., & Lin, H. J. (2016). Optimal ordering and recovery policy in a periodic review integrated inventory model. International Journal of Systems Sciences, 3, 200–210.
- Liu, S. T. (2012). Solution of fuzzy integrated production and marketing planning based on extension principle. Computers & Industrial Engineering, 63, 1201–1208.10.1016/j.cie.2012.07.010
- Lo, C. (2013). A collaborative business model for imperfect process with setup cost and lead time reductions. Open Journal of Social Sciences, 1, 6–11.10.4236/jss.2013.17002
- Mahapatra, G., Mandal, T., & Samanta, G. (2011). A production inventory model with fuzzy coefficients using parametric geometric programming approach. International Journal of Machine Learning and Cybernetics, 2, 99–105.10.1007/s13042-011-0018-z
- Mahata, G. C. (2015). An integrated production-inventory model with backorder and lot for lot policy in fuzzy sense. International Journal of Mathematics in Operational Research, 7, 69–102.10.1504/IJMOR.2015.065958
- Mahata, G. C., & Goswami, A. (2013). Fuzzy inventory models for items with imperfect quality and shortage backordering under crisp and fuzzy decision variables. Computers & Industrial Engineering, 64, 190–199.10.1016/j.cie.2012.09.003
- Maity, A. K. (2011). One machine multiple-product problem with production-inventory system under fuzzy inequality constraint. Applied Soft Computing, 11, 1549–1555.10.1016/j.asoc.2009.12.029
- Mandal, S., Maity, K., Mondal, S., & Maiti, M. (2010). Optimal production inventory policy for defective items with fuzzy time period. Applied Mathematical Modelling, 34, 810–822.10.1016/j.apm.2009.06.031
- Ouyang, L. Y., Wu, K. S., & Ho, C. H. (2006). Analysis of optimal vendor–buyer integrated inventory policy involving defective items. The International Journal of Advanced Manufacturing Technology, 29, 1232–1245.10.1007/s00170-005-0008-y
- Paknejad, M. J., Nasri, F., & Afflsco, J. F. (1995). Defective units in a continuous review (s, Q) system. International Journal of Production Research, 33, 2767–2777.10.1080/00207549508904844
- Pal, S., Mahapatra, G., & Samanta, G. (2014). An EPQ model of ramp type demand with Weibull deterioration under inflation and finite horizon in crisp and fuzzy environment. International Journal of Production Economics, 156, 159–166.10.1016/j.ijpe.2014.05.007
- Pal, S., Mahapatra, G., & Samanta, G. (2015). A production inventory model for deteriorating item with ramp type demand allowing inflation and shortages under fuzziness. Economic Modelling, 46, 334–345.10.1016/j.econmod.2014.12.031
- Paul, S. K., Azeem, A., Sarker, R., & Essam, D. (2014). Development of a production inventory model with uncertainty and reliability considerations. Optimization and Engineering, 15, 697–720.10.1007/s11081-013-9218-6
- Paul, S., Wahab, M. I. M., & Ongkunaruk, P. (2014). Joint replenishment with imperfect items and price discount. Computers and Industrial Engineering, 74, 179–185.10.1016/j.cie.2014.05.015
- Petrović, D., Petrović, R., & Vujošević, M. (1996). Fuzzy models for the newsboy problem. International Journal of Production Economics, 45, 435–441.10.1016/0925-5273(96)00014-X
- Porteus, E. L. (1986). Optimal lot sizing, process quality improvement and setup cost reduction. Operations Research, 34, 137–144.10.1287/opre.34.1.137
- Priyan, S., & Uthayakumar, R. (2014). Optimal inventory management strategies for pharmaceutical company and hospital supply chain in a fuzzy-stochastic environment. Operations Research for Health Care, 3, 177–190.10.1016/j.orhc.2014.08.001
- Priyan, S., & Uthayakumar, R. (2016). Economic design of multi-echelon inventory system with variable lead time and service level constraint in a fuzzy cost environment. Fuzzy Information and Engineering, 8, 465–511.10.1016/j.fiae.2017.01.006
- Rong, M., & Maiti, M. (2015). On an EOQ model with service level constraint under fuzzy-stochastic demand and variable lead-time. Applied Mathematical Modelling, 39, 5230–5240.10.1016/j.apm.2015.03.035
- Sadeghi, J., & Niaki, S. T. A. (2015). Two parameter tuned multi-objective evolutionary algorithms for a bi-objective vendor managed inventory model with trapezoidal fuzzy demand. Applied Soft Computing, 30, 567–576.
- Sadeghi, J., Sadeghi, S., & Niaki, S. T. A. (2014). Optimizing a hybrid vendor-managed inventory and transportation problem with fuzzy demand: an improved particle swarm optimization algorithm. Information Sciences, 272, 126–144.
- Salameh, M. K., & Jaber, M. Y. (2000). Economic production quantity model for items with imperfect quality. International Journal of Production Economics, 64, 59–64.10.1016/S0925-5273(99)00044-4
- Samadi, F., Mirzazadeh, A., & Pedram, M. M. (2013). Fuzzy pricing, marketing and service planning in a fuzzy inventory model: A geometric programming approach. Applied Mathematical Modelling, 37, 6683–6694.10.1016/j.apm.2012.12.020
- Sana, S. S. (2011). A production-inventory model of imperfect quality products in a three-layer supply chain. Decision Support Systems, 50, 539–547.10.1016/j.dss.2010.11.012
- Seliaman, M. E., & Ahmad, A. R. (2008). Optimizing inventory decisions in a multi-stage supply chain under stochastic demands. Applied Mathematics and Computation, 206, 538–542.10.1016/j.amc.2008.05.057
- Soni, H. N., & Joshi, M. (2015). A periodic review inventory model with controllable lead time and backorder rate in fuzzy-stochastic environment. Fuzzy Information and Engineering, 7, 101–114.10.1016/j.fiae.2015.03.007
- Soni, H. N., & Patel, K. A. (2014). Optimal policies for integrated inventory system under fuzzy random framework. The International Journal of Advanced Manufacturing Technology, 78, 947–959.
- Tahami, H., Mirzazadeh, A., Arshadi-Khamseh, A., & Gholakami-Qadikolaei, A. (2016). A periodic review integrated inventory model for buyer’s unidentified protection interval demand distribution. Cogent Engineering, 3, 1206689.
- Taleizadeh, A. A., Niaki, S. T. A., & Wee, H. M. (2013). Joint single vendor-single buyer supply chain problem with stochastic demand and fuzzy lead-time. Knowledge-Based Systems, 48, 1–9.10.1016/j.knosys.2013.03.011
- Vijayan, T., & Kumaran, M. (2008). Inventory models with a mixture of backorders and lost sales under fuzzy cost. European Journal of Operational Research, 189, 105–119.10.1016/j.ejor.2007.05.049
- Wee, H. M., Yu, J., & Chen, M. J. (2007). Optimal inventory model for items with imperfect quality and shortage backordering. The International Journal of Management Science, 35, 7–11.
- Wong, W. K., Qi, J., & Leung, S. Y. S. (2009). Coordinating supply chains with sales rebate contracts and vendor-managed inventory. International Journal of Production Economics, 120, 151–161.10.1016/j.ijpe.2008.07.025
- Yao, J.-S., & Lee, H.-M. (1999). Fuzzy inventory with or without backorder for fuzzy order quantity with trapezoid fuzzy number. Fuzzy Sets and Systems, 105, 311–337.
- Yao, J.-S., & Chiang, J. (2003). Inventory without backorder with fuzzy total cost and fuzzy storing cost defuzzified by centroid and signed distance. European Journal of Operational Research, 148, 401–409.
- Zadeh, L. A. (1978). Fuzzy sets as a basis for a theory of possibility. Fuzzy Sets and Systems, 1, 3–28.10.1016/0165-0114(78)90029-5
- Zhang, T., Liang, L., Yu, Y., & Yu, Y. (2007). An integrated vendor-managed inventory model for a two-echelon system with order cost reduction. International Journal of Production Economics, 109, 241–253.10.1016/j.ijpe.2006.12.051
- Zhou, Y.-W., & Wang, S. D. (2007). Optimal production and shipment models for a single-vendor single-buyer integrated system. European Journal of Operational Research, 180, 309–328.10.1016/j.ejor.2006.04.013