
 ?Mathematical formulae have been encoded as MathML and are displayed in this HTML version using MathJax in order to improve their display. Uncheck the box to turn MathJax off. This feature requires Javascript. Click on a formula to zoom.
Abstract
The challenges faced in public water supply in most cities and developing countries are increasing population size, poor operational efficiency of existing waterworks, leakages, low reticulation coverage and poor cost-recovery. Our study revealed variation in the public water-supply-demand gap estimates under low, middle and high population growth rate scenarios. Under a largely urbanized evolution of the LGAs, Lagos State faces an imminent critical water shortage if pragmatic steps are not taken to bridge the public water supply-demand gap. Pragmatic solutions recommended include strategic planning and implementation of new waterworks, improved operational efficiency of existing waterworks, improved reticulation and appropriate cost-recovery.
Public Interest Statement
Public water supply is cheaper compared to private water supply, helps to reduce diseases and also helps the economy to grow. Our research revealed that the inadequate public water supply in Lagos State is caused by high and increasing population, poor performance of existing waterworks, high pipe leakages, poor coverage of existing waterworks, inadequate number of waterworks and poor collection of water fees which limits expansion. Lack of improvement in the public water supply will limit development and quality of lives across the State. Therefore, it is recommended that more waterworks should be built every year to cover unserved areas, challenges limiting the performance of each waterworks should be addressed and more areas, houses and industries should be connected. In addition, appropriate metering as well as easy, flexible payment options should be utilized to improve water service fee collection.
1. Introduction
1.1. Importance of public water supply systems
Strategic management and provision of sustainable public water supply is essential and crucial for the future of the world’s economy, economic and industrial development, protection and improvement of public health, improving the quality and standard of living, ecosystem preservation as well as poverty alleviation and eradication especially in developing countries (Bartram & Cairncross, Citation2010; Biswas, Citation2008; Huttly et al., Citation1990; McDonald et al., Citation2014; Saravanan & Gondhalekar, Citation2013).
Most developed and developing countries are at risk of severe water shortages in the 21st century if urgent steps are not taken (Mitrica, Mitrica, Enciu, & Mocanu, Citation2017). This is because water supply poses a huge challenge to most urban, peri-urban and rural areas in developing countries (Balogun, Sojobi, & Oyedepo, Citation2016; Sojobi, Danhunsi, & Afolayan, Citation2015; Sojobi, Owamah, & Dahunsi, Citation2014). Though these challenges are enormous, with pragmatic steps, they are surmountable.
Public water supply accounts for 90% of water supply in middle and low-income countries (Hall & Lobina, Citation2006) and serves domestic, institutional, industrial and commercial functions while domestic water supply represents between 50–70% of public water supply (Ayanshola, Sule, & Salami, Citation2013; Lu & Smout, Citation2008).
Improvement in water supply contributes to health equity by reducing the link between poverty and disease (Bartram & Cairncross, Citation2010), prevents approximately 2.4 million deaths annually and averts approximately 7% of global burden of diseases and 19% of child mortality worldwide (Pruss-Ustun, Bos, Gore, & Bartram, Citation2008).
Furthermore, provision of public water supply leads to 3.6% increase in per capita GDP growth along with improved sanitation (Sanctuary, Tropp, & Haller, Citation2004), contributes to socio-economic development and well-being (Ayanshola et al., Citation2013), increases school attendance as a result of reduction of water-borne diseases (Kosec, Citation2014) and is one of the indices of development (Hutton & Haller, Citation2004).
In terms of cost, public water sources are 4–10 times cheaper compared to private sources (Jideonwo, Citation2014) while private water sources cost twice the amount to operate and maintain costs of a piped distribution system (Whittington, Lauria, & Mu, Citation1991). Despite its cheapness, approximately 1.2 billion people still lack access to safe drinking water in developing countries owing to lack of effective large scale water-supply infrastructures (Gadgil, Citation2008).
Worldwide, it is estimated that the global cost of meeting the millennium development goal (MDG) target for water and sanitation ranges from US$ 6.6–75 billion per annum (UN-Water, Citation2008) while the health costs to households and national health systems, as a result of inadequate water supply, is estimated at US$ 340 million and US $67 billion (Hutton & Haller, Citation2004). In addition, approximately 9% of GDP is the cost of inadequate water supply (Bartram & Cairncross, Citation2010).
Consistent and apparent shortfalls in public water supply have forced many households to resort to unwholesome water sources that are not potable. Most studies on public water supply neglect water losses and do not consider different population growth rates as well as different water consumption rates. Failure to account for these important factors may lead to over-estimation or under-estimation of the real situation, which can be misleading to policy makers. Inclusion of the aforementioned factors will ensure robust decisions are made regarding public water supply towards achieving resilient public water supply systems.
This research, which is the first of its kind, therefore intends to ascertain the root cause(s) of the problem and proffer measures to ameliorate this problem using available data and in-depth literature studies.
1.2. Challenges facing public water utilities and public water supply systems
The challenges of public water utilities and public water supply systems have technical, social, economic, legal, institutional and environmental dimensions (Jideonwo, Citation2014; Sojobi, Citation2016). According to Varis (Citation2006), some of the challenges include increasing urbanization rate, inadequate investment funds, inadequate management capacities and poor governance, inappropriate institutional frameworks, inadequate legal and regulatory framework.
Other challenges faced by public water supply systems include data collection, availability and accuracy, inadequate financial resources for effective operations, lack of skilled technical personnels, urbanization and unsustainable water consumption practices, lack monitoring of water quality, health outcomes and economic returns, bacteriological contamination during distribution and storage, poor water quality, poor governance and stakeholder engagement and migration, technical inefficiencies and unreliability, over-dependence on government for finance (Abubakar, Citation2016; Adnan, Citation2013; Adnan & Iqbal, Citation2014; Cohen, Citation2006; Haider, Sadiq, & Tesfamariam, Citation2014; Saravanan & Gondhalekar, Citation2013; See, Citation2015; World Bank, Citation2007; Zérah, Citation2000).
On the other hand, Cohen (Citation2006) opined that these challenges are solvable using scientific and engineering expertise with good management.
Therefore, this study aims to investigate the public-water-demand-supply shortfall, ascertain the root causes and proffer pragmatic solutions.
2. Materials and methods
2.1. Study area
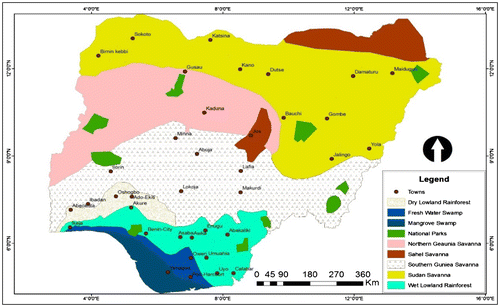
Lagos State is one of the fastest growing and emerging urban coastal cities in Sub-saharan Africa (Sojobi, Balogun, & Salami, Citation2016). As the commercial capital and economic hub of Nigeria and West Africa, it has five ports and generates between $32–$52 million internally generated revenue (IGR) monthly (Filani, Citation2012) and contributes about 60% of Nigeria’s non-oil revenue (Adelekan, Citation2010). As a burgeoning coastal city located in Southwest Nigeria, it is bounded by the Atlantic Ocean in the South, Benin in the West, Ogun State in the North and East as depicted in Figure . Its climate is characterized by two major climate/vegetation namely freshwater swamp and wet lowland tropical rainforest climates and two minor climate/vegetation namely dry lowland rainforest and southern guinea savannah as shown in Figure .
Figure 1. Map depicting location of Lagos State in Southwest of Nigeria.
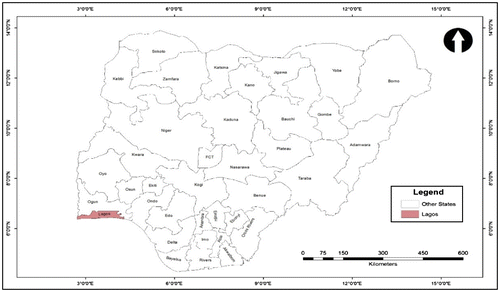
Figure 2. Map depicting climate/vegetation classification of Nigeria.
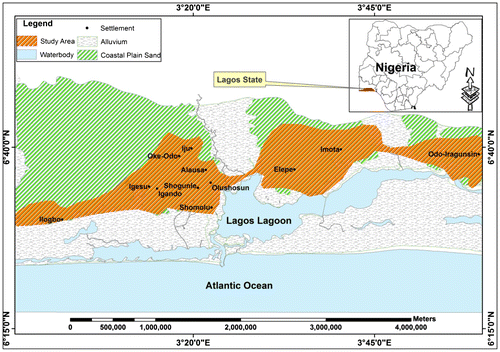
The study area is the coastal plain sand (CPS) geomorphological unit of Lagos State with some alluvium deposits shown in Figure and it lies approximately between Latitudes 6° 30′N and 6° 40′N and Longitudes 3° 00′E and 4°00′E. The study area occupies approximately 73.63 km2 area of land which covers distinct geographical settlements as shown in Figure . The region is drained by dendritic drainage system comprising some rivers such as Rivers Abesan, Berre, Ibu, Ore and Owo to mention a few which flow into the Lagos Lagoon which ultimately discharges into the Atlantic Ocean (Oyegoke & Sojobi, Citation2012).
Figure 3. The coastal plain sand of Lagos State.
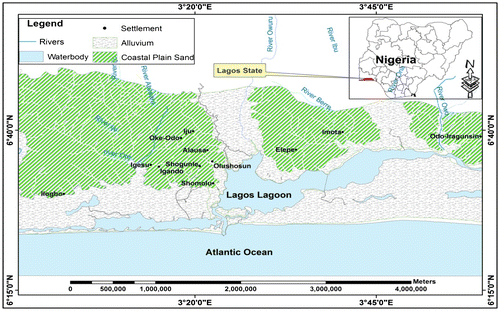
Figure 4. The study area in Lagos State.
Geologically, the CPS which consists sand and gravel is underlain by four hydrogeological units namely the Benin Formation, Abeokuta Formation, Ilaro and Ewekoro Formations (Aketoyon, Ogundele, & Soladoye, Citation2010; Longe, Malomo, & Olorunniwo, Citation1987). The coastal plain sand thickens from its outcrop area in the north to the coast in the south with increase in sand formation to the south (Longe et al., Citation1987).
Hydrogeologically, the aquifer in the study area is divided into five aquifers and the depth and thickness of each of the aquifer varies across the State as depicted in Figure . Groundwater occurrence in the study area varies from confined, semi-confined to unconfined and consists mainly of sand and clay (Adelana et al., Citation2008; Longe, Citation2011). Depending on the location, the first aquifer, located in the Benin formation, varies from a depth of 3–60 m as shown in Figure and is usually accessed through shallow hand-dug wells which is susceptible to anthropogenic pollution. According to Obiora and Onwuka (Citation2005), any borehole/well with a depth <70 m is regarded as shallow.
Figure 5. Hydrogeological cross-section of the coastal plain sand along the coastal area of Lagos State (Adelana et al., Citation2008).
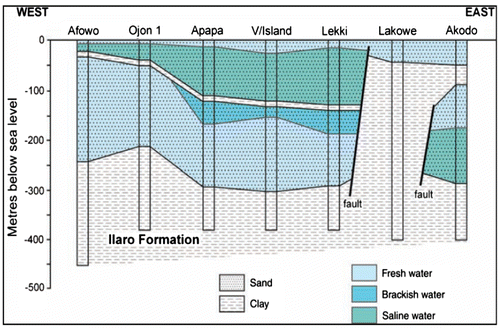
The second aquifer, located between Apapa and Lekki at depths of 120–190 m contains brackish water which is not suitable for drinking. The third aquifer, which consists of the major fresh groundwater in the study area is located at varying depths of 40 m at Afowo, 160 m at Apapa, 150 m at Victoria Island and 180 m at Lekki but different thicknesses of 100–200 m. The third aquifer is usually accessed for groundwater public water supply. The fourth aquifer, which consists mainly clay, is not usually accessed because it is a very poor potential for groundwater.
In terms of population size, Lagos State is estimated to have population size ranging from 24.5 million in 2015 to 29 million in 2025 (Lagos Water Corporation, Citation2011; United Nations Human Settlements Programme (UN-Habitat), Citation2008), even though this estimate has been questioned by Potts (Citation2012) based on the population estimate released by Africapolis Team (Citation2008). The population growth rate was estimated to range between 2.35 and 8% (Africapolis Team, Citation2008; Oyegoke, Adeyemi, & Sojobi, Citation2012; Potts, Citation2012; United Nations Centre for Human Settlements, Citation1996; World Bank, Citation2012).
Furthermore, there have been concerted calls to improve the public urban water supply in Lagos State (Jideonwo, Citation2014; Longe, Kehinde, & Olajide, Citation2015; Olajuyigbe, Rotowa, & Adewumi, Citation2012; Omole, Ndambuki, Badejo, Oyewo, & Soyemi, Citation2016; Olukanni et al., Citation2014; Oyegoke et al., Citation2012). According to Sample, Awopetu, and Harou (Citation2013), residents in Lagos State utilize different multiple sources to meet their water demands. The author revealed that high-income households get 95% of their water from boreholes, while medium-income households source 38% of their water from wells and 54% from public/commercial boreholes and vendors while low-income households obtain 59% of their water from wells and 36% from boreholes. The author also stated that the type of water sourced depends on price, quality and proximity.
Therefore, water supply data was obtained from Lagos Water Corporation covering all the existing waterworks spanning ten years from 2004–2013. The locations of each waterworks is shown in Figure . Trends in the public water supply were studied. In addition, to ascertain existence of inequality in water supply distribution across the various LGAs, the State was divided into three income classification namely low-income, middle income and high-income LGAs as depicted in Figure before statistical analyses were implemented.
Figure 6. Locations of the mini- and micro-waterworks and river intakes in Lagos State.
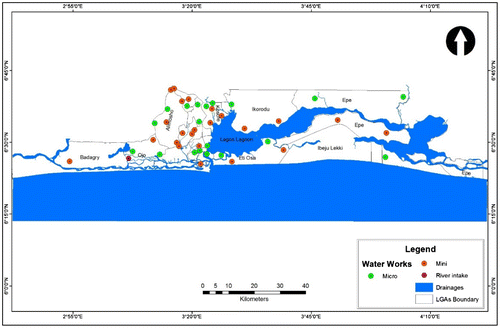
Figure 7. Income classification of local government areas in Lagos State.
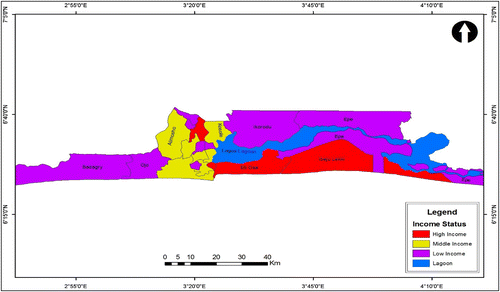
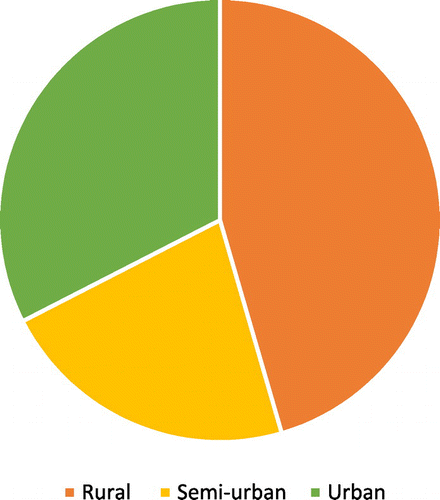
The high-income, middle-income and low-income areas correspond to the urban areas, semi-urban and rural areas. Income classification was also utilized by Sample et al. (Citation2013) for Lagos State. Oteri and Ayeni (Citation2016) reported that Lagos comprises 32.53% urban communities, 21.96% semi-urban and 45.51% rural communities as depicted in Figure , which implies uneven development within the State.
Figure 8. Classification of Lagos State into rural, Semi-urban and rural communities (Oteri & Ayeni, Citation2016; Sample et al., Citation2013).
2.2. Data collection, methods and analysis
Public water supplied data spanning ten years from 2004–2013 was collected from the Lagos Water Corporation covering all the waterworks within the State. In addition, population data for each Local Government Area (LGA) was obtained from published data of National Bureau of Statistics (NBS, Citation2012) while population projection was done for 2013, 2020, 2030, 2040 and 2050 using objective and published growth rate values obtained from literatures (Africapolis Team, Citation2008; Lagos Water Regulatory Commission (LSWRC), Citation2016; Oyegoke et al., Citation2012; Potts, Citation2012; United Nations Centre for Human Settlements, Citation1996; World Bank, Citation2012).
Each LGA was differentiated using configurations such as high-income, middle-income and low-income corresponding to urban, semi-urban and rural areas as shown in Table to be able to determine appropriate water demand for each LGA. This is because domestic water demands and consumption patterns vary with different income status as reported by Samuel (Citation1986). Empirical studies have shown that household income classification dominates population classification in terms of water demands (Dagnew, Citation2012; Fan, Liu, Wang, Geissen, & Ritsema, Citation2013; Morote, Hernandez, & Rico, Citation2016; Romano, Salvati, & Guerrini, Citation2014). Upper and lower estimates of public water demand-supply and water demand-supply gap were given as recommended in literature (Husselmann & Van Zyl, Citation2006).
Table 1. Classifications of local government areas (LGAs) in Lagos State showing corresponding water demand and waterworks locations
Population forecast for 2020, 2030, 2040 and 2050 was done for each LGA using 2011 population figure as the baseline and three growth rates obtained from literatures namely:
2.35% lower growth rate (LGR) (Africapolis Team, Citation2008; Potts, Citation2012), 8% high-growth rate (HGR) (George, Citation2010; United Nations Centre for Human Settlements, Citation1996) and the 3.2% medium growth rate (MGR) given by Lagos Water Corporation (Citation2016).
Since data for monitoring income evolution across each LGA is not available, evolution of urban, semi-urban and rural LGAs within the State over the study period was monitored using the population size classification given by Bhagat (Citation2005). LGA with population of < 50, 000, 50,000–499,999 and > 500,000 were classified as rural, semi-urban and urban.
2.3. Evaluation of water demand and water supply-demand gap
Accurate water demand/consumption is required to aid management decisions and investment choices (Buck, Soldati, & Sunding, Citation2015). Therefore, careful analysis of water demand is very necessary. As displayed in Table , Lagos State comprises urban, semi-urban and rural areas. In terms of water demand, the urban, semi-urban and rural areas were assigned water demands of 120–150, 70–12 and 50–70 lpcd respectively.
The residential water demand for the urban areas (120–150 lpcd) complied with the 120 lpcd national standard water demand reported by Ezenwaji, Eduputa, and Okoye (Citation2016) and Martins (Citation2001) for Nigeria and the 120 lpcd reported by Samuel (Citation1986) for high-income areas in Nairobi and likewise captured the range of 120–143 lpcd reported by European Green Capital Award (2012/2013) for Nantes in France and 150 lpcd reported by UKEA (Citation2008). Also, the 70–120 lpcd water demand for semi-urban areas captured the 114–115 lpcd obtained by Samuel (Citation1986) for middle-income areas in Nairobi and the >100 lpcd optimal access reported by WHO (Citation2003).
In addition, the 50–70 lpcd water demand of the rural areas captured the 50 lpcd basic water requirement for domestic water adopted by the international community (Gleick, Citation1996), the maximum 50 lpcd reported by Samuel (Citation1986) and 50 lpcd recommended by WHO (Citation2003) for intermediate water access.
Population forecast was done using the equation given by Keyfitz and Caswell (Citation2005):(1)
(1)
where A = Forecasted future population in n years’ time; P = Baseline population of 2013; r = annual population growth rate; n = number of years from the baseline population year to the future population year, which was 7, 17, 27 and 37 years for 2020, 2030, 2040 and 2050 respectively. It is assumed that growth rate remains constant over the projected timeframe.
Water demand and water supply-water demand gap were calculated for five scenarios namely:
| (1) | low growth rate (LGR) of 2.35% (Africapolis Team, Citation2008; Potts, Citation2012) | ||||
| (2) | medium growth rate (MGR) of 3.2% (Lagos Water Regulatory Commission (LSWRC), Citation2016) | ||||
| (3) | high-growth rate (HGR) of 8% (George, Citation2010; United Nations Centre for Human Settlements, Citation1996) | ||||
| (4) | 120 lpcd National water demand standard (flat for all LGAs) | ||||
| (5) | 139 lpcd optimal water access estimate recommended by Okeke, Oyebande, and Odunuga (Citation2011) (flat for all LGAs). | ||||
For the first three scenarios, the upper and lower limits of the per capita water demand were evaluated to take care of the variability within each configuration as shown below.
For the low-growth, medium- and high-growth rates scenarios, their total residential annual public water demands were evaluated as follows:(2)
(2)
(3)
(3)
where QUL = Total annual water demand in the Lagos State for upper limits of per capita water demand for all the various LGA classifications; QLL = Total annual water demand in the Lagos State for lower limits of per capita water demand for the various LGA classifications; = Upper limit of annual per capita water demand for each LGA;
= Lower limit of annual per capita water demand for each LGA; Pj = Annual population of each LGA.
For the last two scenarios, their annual water demands were evaluated as follows:(4)
(4)
(5)
(5)
where QNWS = Total annual water demand using National water demand standard for Nigeria; QOA = Total annual water demand using optimal water demand estimate under optimal access scenario; = Annual per capita water demand using National water demand standard; qOA = Annual per capita water demand using Optimal water access estimate.
In order to calculate the total annual public water demand (TAPWD), the total residential annual public water demand obtained was multiplied by 100/70 to accommodate commercial and industrial demands as well as public institutional water demands. This is because the residential customers of LWC constitute approximately 70% of the total customer base, while the industrial and commercial customers make up approximately 20% of the customer base and the public institutional customers was approximated to 10% (Lagos Water Corporation, Citation2016; Nairobi City Council, Citation1977). This method was used because of paucity of published data on water demands for institutional and commercial customers and public institutional customers.
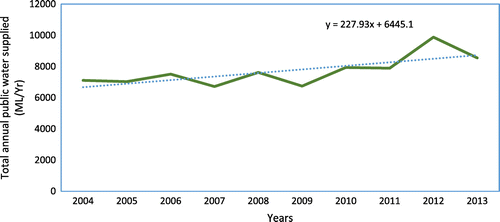
Total annual public water supplied (TAPWS) was calculated as the sum of all the water supplied by each of the waterworks annually. Forecasted total annual public water supplied for 2020, 2030, 2040 and 2050 were obtained using the linear equation obtained from Figure using the 2013 total annual public water supplied as the baseline.
Figure 9. Total annual public water supplied by waterworks in Lagos State from 2004–2013.
Actual total annual public water supplied (Actual TAPWS) was obtained taking into account the water losses and unaccounted for water of 60% reported by Ayeni, Omojola, and Fasona (Citation2016) and Jideonwo (Citation2014) and losses of 60–80% reported by Omole et al. (Citation2016). A conservative value of 60% was chosen for our analysis because it was common to the three above literatures.(6)
(6)
where SAT = Actual total annual public water supplied after accounting for losses in the distribution system; ST = Total annual public water supplied without accounting for losses in the distribution system.
Actual total annual public water supplied was evaluated for two public water supply scenarios. Scenario 1 was when 227.93 ML of public water was added yearly to the public water supply system while scenario 2 was when no extra public water was added beyond 2020.
The total annual public water supply-demand gap (GT) was obtained as the difference between actual total annual public water supplied and corresponding water demands for the various scenarios considered.(7)
(7)
where GAT = Total Annual Public Water Supply-Demand Gap; Qj = Total Annual Public Demand for each scenario, j. Each scenario j = 1, 2, 3, 4, 5 corresponds to 2.35, 3.2%, 120, and 139 lpcd scenarios.
The operational efficiency of each waterworks was evaluated using the public water supplied (i.e. their public water supply output) as a percentage of their installed capacities which varies from one waterworks to the other.(8)
(8)
where η = Operational efficiency of each waterworks (%); C = Installed capacity.
3. Results and discussion
3.1. Population size and trends
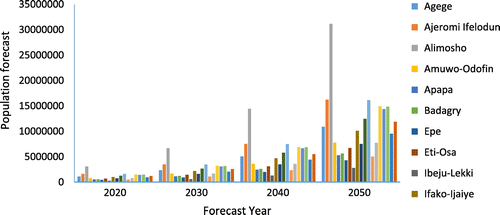
Under the low-growth rate scenario as shown in Figures and , Lagos had a population of 11,208,268 million in 2013 and was projected to have population of 13,186,826 million, 16,630,588 million, 20,972,722 million and 26,459,212 million in 2020, 2030, 2040 and 2050 respectively. Under the medium-growth rate depicted in Figure , Lagos State recorded a population of 11,390,081 in 2013 and was expected to have populations of 14,202,843 million, 19,454,045 million, 26,662,416 million and 36,533,819 million by 2020, 2030, 2040 and 2050 respectively.
Figure 10. Forecasted population of Lagos State for low-, medium- and high-growth rates.
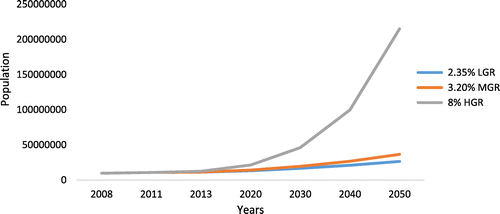
Figure 11. Population forecast for Lagos State at 2.35% low-growth rate.
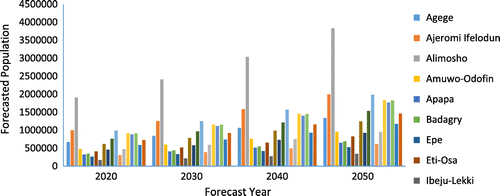
Figure 12. Population forecast for Lagos State at 3.20% medium-growth rate.
In the high-growth scenario displayed in Figure , the population of Lagos State was 21,379,129 in 2013 and was estimated to be 21,379,129 million, 46,159,240 million, 99,644,405 million and 215,128,155 million by 2020, 2030, 2040 and 2050 respectively. The 19.8 million population estimate reported by Ayeni et al. (Citation2016) for 2026 fell only within the medium-growth range of 16,630,588 and 20,972,722 for 2020 and 2030 respectively.
Figure 13. Population forecast for Lagos State at 8% medium-growth rate.
This enormous population size portends huge challenge and opportunities for Lagos State Government and private sector. In addition, it implies that the strategic planning to be adopted to meet the State infrastructural needs including water to sustain the quality of life within the State must of necessity involve a quantum leap which must be different from those utilized in previous administrations.
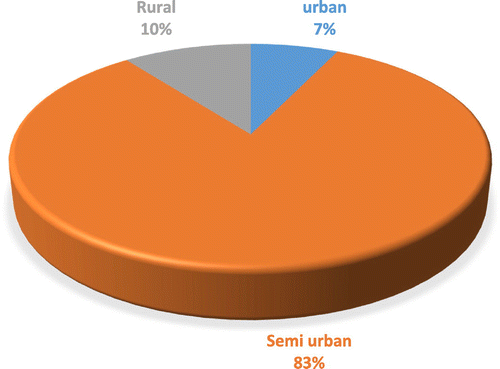
Based on income classification for water demand, our study revealed that Lagos State is largely semi-urban with 82.49% of the population living in semi-urban areas, 10.4% in rural areas and 7.11% living in urban areas as depicted in Figure . Massive infrastructural developments in the rural areas will go a long way to decongest the semi-urban areas characterized by agglomeration and ensure even distribution of the population, which will help improve the quality of life in the State. Our result was totally different from the results of Sample et al. (Citation2013) who reported a largely rural community of 45.51%, semi-urban communities of 21.96% and urban areas of 32.53%. The difference in composition could be due to our focus on LGAs which are bigger than communities and can comprise different mix of communities while the focus of Sample et al. (Citation2013) was on community, which is smaller compared to LGA. Our analysis is accurate because we utilized actual population figures published by Nigerian Bureau of Statistics.
Figure 14. Composition of Lagos State in terms of urban, semi-urban and rural LGAs based on income.
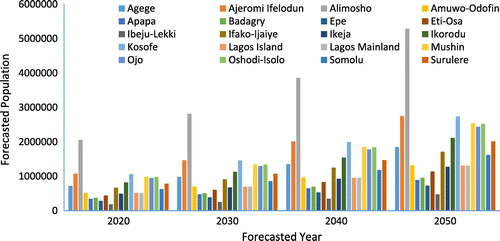
In terms of evolution of the LGAs, by 2030 between 15–20 of the LGAs would have evolved into urban LGAs and by 2050, almost all the LGAs would have been urbanized as depecited in Table . This implies greater demand for public water supply.
Table 2. Evolution of Urban-Semi-urban LGAs in Lagos State based on different population growth rates and population size category
3.2. Trends in public water supplied and operational efficiency of each waterworks
Table revealed that only approximately nine out of the twenty LGAs have waterworks. In addition, from Figure , it was observed that the waterworks which consistently recorded the highest supply of public water were Apapa, Ikoyi and Alausa which are medium income, high-income and medium-income areas respectively (Figure ).
Figure 15. Public water supplied by various waterworks from 2004–2013 in Lagos State.
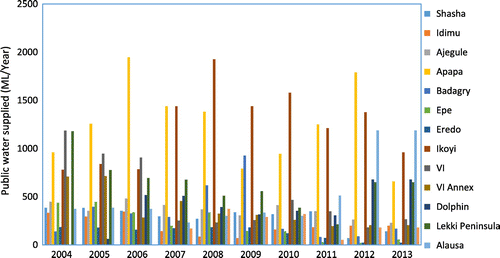
Furthermore, waterworks which grossly undersupplied below 3,000 ML/yr (million litres per year) on the average were Shasha (2,903.96 ML/yr), Meiran (1,119.26 ML/yr), Idimu (2,010.89 ML/yr), Igando (1,562.82 ML/yr), Agege (28.77 ML/yr), Amuwo Odofin (1,385.73 ML/yr), Ijora Badia (1,725.21 ML/yr), Epe (2, 148.60 ML/yr), Epe Agric (705.75 ML/yr), Eredo (1,295.87 ML/yr), Badore (1,140.57 ML/yr), New Ajegunle (650.34 ML/yr) and Ojokoro (1,297.16 ML/yr).
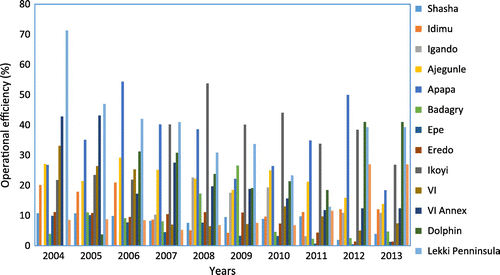
In terms of operational efficiency, the waterworks with the highest operational efficiencies were Lekki Peninsula (38.05%), Apapa (34.66%), Ikoyi (34.43%). Dolphin (25.59%). VI Annex (22.14%) and Ajegunle (21.93%) as displayed in Figure . The waterworks with the least operational efficiency were Epe (4.87%), Eredo (7.84%), Shasha (8.11%), Badagry (9%), Alausa (11.76%), Idimu (12.17%) and Igando (13.51%). A gradual decline in operational efficiencies was observed in all the waterworks which undermines the objective of Lagos Water Corporation to reach more population with public water supply. This ugly situation has the capacity to further widen the public water-supply-demand gap (Figure ).
Figure 16. Operational efficiency of each waterworks in Lagos State from 2004–2013.
3.3. Evaluation of water demand and water supply-demand gap
Our results revealed occurrences of public water supply-demand variations and imbalances at temporal and spatial scales across the State in tandem with observations of Ali, Shafiee, and Berglund (Citation2016). In line with the observations of Ameyaw and Chan (Citation2015), potentials of existing urban water supply infrastructures were not fully utilized owing to mismatching of water supply and demand and the poor and declining operational efficiencies of the waterworks among other factors. As shown in Figure , residential water demand was highest under the optimum access (OA) scenario, followed by national water standard (NWS) and upper limit of high-growth rate scenario and was least under the LGR (LL) and 3MGR (LL) scenarios (Figure ).
Figure 17. Total annual public residential water demand for Lagos State from 2008–2050 for different scenarios.
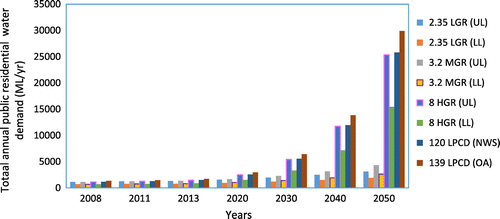
Based on information given in Table , the lower, middle and upper limits of the total annual public water demand covering residential, public institutional, industrial and commercial uses were estimated as 1,406, 2,269 and 2,637 ML/Yr for 2,020; 1,852, 3,605 and 8,284 for 20,230; 2,445, 4,011 and 15,969 ML/yr for 2,040; and 3,236, 5,304 and 33,895 ML/yr for 2,050 respectively.
Table 3. Total annual public water demand for Lagos State from 2008–2050 for different growth scenarios
The actual total annual public water supplied for the first scenario were 3,419.42, 3,216.24, 4,127.96, 5,039.68 and 5,951.4 ML/yr for 2013, 2020, 2030, 2040 and 2050 as shown in Figure . For the second scenario, the actual total annual public water supplied for the second scenario were 3,216.24 ML/yr for 2020–2050.
Figure 18. Total annual public water supplied for Lagos State from 2008–2050 for two scenarios.
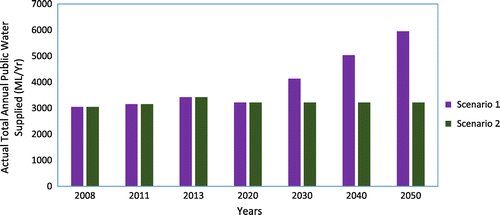
The total annual public water demand-supply gap for the first scenario depicted in Table were 383.7–1,029.04, 611.06–5,038, 5,190.5–14,747 and 16,135.1–30,928 ML/Yr for 2020, 2030, 2040 and 2050 respectively. For the second scenario shown Figure , the total annual public water demand-supply gap for the were 383.7–1,029.1, 1,522.8–5,949.7, 1,273.33–1,657.3 and 1,239.11–39,502.1 ML/Yr for 2020, 2030, 2040 and 2050 respectively. The 2026 water demand of 2,418.9 ML/D obtained by Ayeni et al. (Citation2016) for Lagos State was within the within the ranges for water demand-supply gap obtained for the two scenarios for 2020 and 2030.
Table 4. Total annual public water demand-supply gap for Lagos State with additional waterworks yearly (Scenario 1)
It was observed that the public water demand-supply gap approximately triples every ten (10) years for both scenarios. This implies that new waterworks must be constructed yearly to avert water crises within the State in the near future. The expansion and construction of new waterworks must at also be tripled yearly. The total number of waterworks to be constructed utilizing mini-waterworks of installed capacity of 2,755 ML/yr with minimum operational efficiency of 50% were estimated as 4, 12 and 28 to meet the demand-supply demand gap for 2030, 2040 and 2050 respectively. But if they operate at maximum operational efficiency, the number of mini-waterworks required are 2, 6 and 14. It must be borne in mind that at lower operational efficiencies, the number of mini-waterworks required will increase correspondingly.
From Figure , the percentages of total annual public water supplied to semi-urban, rural and urban areas from 2004–2013 were 80.01–89.12, 2.30–16.05 and 3.45–13.89% respectively. This demonstrates that the semi-urban areas took the largest share of the public water supply followed by rural areas while the urban areas received the least share of the public water supplied. This public water supply distribution is closely in line with the population distribution of 82.49, 10.40 and 7.11% for semi-urban, rural and urban areas in Lagos State (Table ).
Figure 19. Total annual public water supplied for urban, semi-ruban and rural areas in Lagos State from 2004–2014.
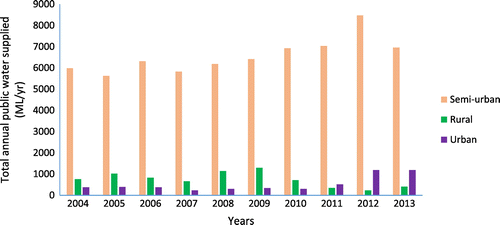
Table 5. Total annual public water demand-supply gap for Lagos State Lagos State with no additional waterworks (Scenario 1)
Based on US$ 0.2–0.3 per m3 cost of water supply (Hutton & Haller, Citation2004; WHO & UNCF, Citation2000), approximately US$ 9,875,525 would be required to meet the 2050 water supply-demand gap maximum estimate of 39,502.1 ML/Yr.
3.4. Best practices to improve the performance of waterworks in Lagos State
LWC need to put in place and implement strategic planning to improve public water supply that will cover up to 2050 public water demands. Long-term planning was also advocated for by Fraga, Marques, and Medellin-Azuara (Citation2016) while strategic planning and transdisciplinary approach was also advocated by Stoeglehner, Edwards, Daniels, and Narodoslawsky (Citation2011), Serrao-Neumann, Renouf, Kenway, and Choy (Citation2017), Smith and Jenkins (Citation2015).
High-quality recruitment, staff motivation and training was also emphasized by International Labour Organizations Rajasekar and Khan (Citation2013) and Alves, Muranho, Albuquerque, and Ferreira (Citation2014) for improved organizational performance. Appropriate cost recovery measures and customer-friendly billing and payment options as advocated by Marson and Savin (Citation2015), WPP & ADB (Citation2010) and WSP (Citation2011) must be put in place and pursued by LWC for enhanced financial performance since government alone cannot finance its capital-intensive plans. Operational performance of each waterworks should be improved to optimize public water supply.
Customer orientation and excellent customer service alongside performance benchmarking were recommended by Baietti, Kingdom, and van Ginneken (Citation2006), Carvalho and Marques (Citation2011) to improve the operational efficiency of all the waterworks.
Massive water conservation campaigns should also be embarked upon by LWC to reduce water leakages as well as unaccounted for water losses (UFW) within the public water distribution network as well as losses at the point of usages by residential customers since they comprise approximately 70% of the total customer base and industrial/commercial and public institutional customers.
Also, monitoring teams should be set up to identify and facilitate replacement of corroded water pipelines which will also help reduce leakages and potential leakages in line with recommendations of Pietrucha-Urbanik (Citation2015) while pilot studies should be put in place for se of mobile, wireless sensor network to collect and transmit flow measurements for leakage detection as suggested by Gong et al. (Citation2016).
While GIS is utilized to ensure equitable and optimized location and distribution of public water, coverage benchmarks should be set for existing and planned waterworks with appropriate monitoring.
For areas that will not be reached with reticulated/piped water until the middle and long-term, public community boreholes should be constructed and should be evenly spread among those communities to alleviate water stress in those areas. In such areas, community-public partnership could be implemented in line with recommendations of Adams and Zulu (Citation2015).
Owing to the increased dependence on groundwater for public water supplies, comprehensive research and data collection should be sponsored by the agency and Lagos State Government in order to ensure sustainable groundwater management and avoid over-exploitation. This is in agreement with the recommendations by Rusinga and Taigbenu (Citation2005) and Ni, Liu, Tan, and Deng (Citation2010).
In addition, owing to the location of the waterworks in densely-populated residential areas and groundwater exploitation for public water supply purposes, regular monitoring of the health risk assessment of groundwater aquifer should be carried out in line with the recommendations of Sojobi (Citation2016) and Aliewi and Alkhatib (Citation2015) in collaboration with the academia to alert and mitigate any unwanted health risks.
Online database management system and metering for all the various waterworks as advocated by Jaladhi, Dhruv, Utkarsha, and Mahroof (Citation2016) and Omole et al. (Citation2016) should be put in place also.
4. Conclusions
Public water supply is a herculean task which is indispensable to sustain the economy, competitiveness and quality of lives of cities in developed and developing countries. Estimates of public water supply demand-gap varies with population growth rate assumptions and should be evaluated taking into consideration the maximum, middle and minimum limits to guide effective decision-making.
Under low-, medium- and high-growth rates, 2050 population forecast of Lagos State was estimated as 26,459,212 million, 36,533,819 million and 215,128,155 million. Evolution of the dynamics of the LGAs based on population size revealed that almost all the LGAs would be urbanized by 2050. The water-supply-demand gap was estimated as 16,135.1–39,502.1 ML/Yr which would require investment funding of between US$4, 033, 775–US$ 9,875,525 to meet this gap.
It is recommended that proactive steps should be taken by the LWC to improve the operational efficiency of the existing waterworks and also reduce leakages in the public water distribution system.
Further research is required to ascertain the groundwater abstraction potential of the aquifers within Lagos State to guide the siting of the location and operation of the mini-waterworks. In addition, further researches are also required on sustainable funding and cost-recovery options for Lagos State public water supply. Also, additional researches are required to determine the significant factors influencing water demand and impact of migration on water demand.
Funding
The authors received no direct funding for this research. The second author appreciates the Post-graduate Studentship towards his PhD programme in City University of Hong Kong.
Compliance with ethical standards
The authors declare originality of the research and compliance with ethical standards.
Additional information
Notes on contributors
Isaac Idowu Balogun
Isaac Idowu Balogun is a Senior Lecturer in the Geography Department, University of Lagos, Nigeria and has over 20 years research and teaching experience.
Adebayo Olatunbosun Sojobi
Adebayo Olatunbosun Sojobi is a PhD candidate in the Department of Architecture and Civil Engineering, City University of Hong Kong, Hong Kong, China.
Emmanuel Galkaye
Emmanuel Galkaye was a MSc Student in the Geography Department, University of Lagos, Nigeria.
Our research focuses on finding pragmatic solutions to environmental issues to appropriately inform policy making and guide their implementation. Our research group is open to collaborations to find lasting solutions to pressing world’s environmental challenges. We look forward to working with you.
Provision of public water supply requires reliable estimates of public water demand as well as public water supply to bridge the demand-supply gap. Such information is imperative for effective planning and appropriate investment funding.
References
- Abubakar, I. R. (2016). Quality dimensions of public water services in Abuja, Nigeria. Utilities Policy, 38, 43–51.10.1016/j.jup.2015.12.003
- Adams, E. A., & Zulu, L. C. (2015). Participant or customers in water governance? Community-public partnerships for peri-urban water supply. Geoforum, 65, 112–124.10.1016/j.geoforum.2015.07.017
- Adelana, S. M. A., Olasehinde, P. I., & Bale, R. B. (2008). An overview of the geology and hydrogeology of Nigeria. In S. M. A. Adelana & A. M. MacDonal (Eds.), Applied Groundwater Studies in Africa: IAH selected papers. Leiden: CRC Press/Balkema.
- Adelekan, I. O. (2010). Vulnerability of poor urban coastal communities to flooding in Lagos, Nigeria. Environment & Urbanization, 22, 433–450.10.1177/0956247810380141
- Adnan, M. A. (2013). Drinking water quality assessment of the middle governorate in the Gaza strip Palestine. Water Resources and Industry, 4, 13–20.
- Adnan, S., & Iqbal, J. (2014). Spatial analysis of the groundwater quality in the Peshawar District, Pakistan. Procedia Engineering, 70, 14–22.
- Africapolis Team. (2008). Urbanization trends 1950–2020: A geo-statistical approach (Analytical report). Retrieved from Africapolis, AFD-SEDET http://www.afd.fr/jahia/webdav/site/afd/users/administrateur/public/publications/BT/Africapolis_Final-Report_EN.pdf
- Aketoyon, I. S., Ogundele, F. O., & Soladoye, O. (2010). Characterization by factor analysis of chemical faces of groundwater in the coastal plain sands aquifer of Lagos, South Western Nigeria. International Journal of Academic Research, 2, 256–260.
- Ali, A. M., Shafiee, M. E., & Berglund, E. Z. (2016). Agent-based modelling to simulate the dynamics of urban water supply: Climate, population growth, and water shortages. Sustainable Cities and Society. doi:10.1016/j.scs.2016.10.001
- Aliewi, A., & Alkhatib, I. A. (2015). Hazard and risk assessment of pollution on the groundwater resources and residents’ health of Salfit District, Palestine. Journal of Hydrology: Regional Studies, 4, 472–486.
- Alves, Z., Muranho, J., Albuquerque, T., & Ferreira, A. (2014). Water distribution network’s modelling and calibration. A case study based on scarce inventory data. Procedia Engineering, 70, 31–40.10.1016/j.proeng.2014.02.005
- Ameyaw, E. E., & Chan, A. P. C. (2015). Evaluation and ranking of risk factors in public private partnership water supply projects in developing countries using fuzzy synthetic evaluation approach. Expert Systems with Applications, 42, 5102–5116.10.1016/j.eswa.2015.02.041
- Ayanshola, A. M., Sule, B. F., & Salami, A. (2013). Evaluation of willingness to pay for reliable and sustainable household water use in Ilorin, Nigeria. Ethiopian Journal of Environmental Studies and Management, 6, 754–762.10.4314/ejesm.v6i6.6S
- Ayeni, A. O., Omojola, A. S., & Fasona, M. J. (2016). Urbanization and water supply in Lagos State, Nigeria: The challenges in a climate change scenario. 7th International Water Resources Management Conference of ICWRS, 18–20 May 2016, Bochum, Germany. Retrieved from http://www.iwra.org/congress/resource/PAP00-5503.pdf
- Baietti, A., Kingdom, W., & van Ginneken, M. (2006). Characteristics of well-performing public water utilities. World Bank. Retrieved 2016, 21 November from siteresources.worldbank.org/INTWSS/Resources/Workingnote9.pdf
- Balogun, I. I., Sojobi, A. O., & Oyedepo, B. O. (2016). Assessment of rainfall variability, rainwater harvesting potential and storage requirements in Odeda Local Government Area of Ogun State in South-western Nigeria. Cogent Environmental Science, 2(1138597), 1–25.
- Bartram, J., & Cairncross, S. (2010). Hygiene, sanitation, and water: Forgotten foundations of health. PLoS Medicine, 7(11), 1–9, e1000367.
- Bhagat, R. B. (2005). Rural-urban classification and municipal governance in India. Singapore Journal of Tropical Geography, 26, 61–73.10.1111/sjtg.2005.26.issue-1
- Biswas, A. K. (2008). Integrated water resources management: Is it working? International Journal of Water Resources Development, 24, 5–22.10.1080/07900620701871718
- Buck, S., Soldati, H., & Sunding, D. L. (2015). Forecasting urban water demand in California. Rethinking model evaluation. Retrieved from http://ageconsearch.umn.edu/bitstream/205737/2/buck%20et%20al_forecasting%20water%20demand_aaea2015.pdf
- Carvalho, P., & Marques, R. C. (2011). The influence of the operational environment on the efficiency of water utilities. Journal of Environmental Management, 92, 2698–2707.10.1016/j.jenvman.2011.06.008
- Cohen, B. (2006). Urbanization in developing countries: Current trends, future projections, and key challenges for sustainability. Technology in Society, 28, 63–80.10.1016/j.techsoc.2005.10.005
- Dagnew, D. C. (2012). Factors determining residential water demand in North Western Ethiopia. The case of Merawi (Masters’ thesis). Cornell University.
- Ezenwaji, E. E., Eduputa, B. M., & Okoye, C. O. (2016). Investigations into the residential water demand and supply in Enugu Metropolitan Area. Nigeria. American Journal of Water Resources, 4, 22–29.
- Fan, L., Liu, G., Wang, F., Geissen, V., Ritsema, C. J. (2013). Factors affecting domestic water consumption in rural households upon access to improved water supply: Insights from the Wei River Basin, China. PLoS One, 8(8) e71977, 1–9.
- Filani, M. O. (2012). Changing face of Lagos. From vision to reform and transformation. Brussels: Cities Alliance. Retrieved March 10, 2016, from www.citiesalliance.org/sites/citiesalliance.org/files/Lagosreform-report-lowres.pdf
- Fraga, C. C. S., Marques, G. F., & Medellin-Azuara. (2016). Planning for infrastructure capacity expansion of urban water supply portfolios with an integrated simulation-optimization approach. Sustainable Cities & Society. doi:10.1016/j.scs.2016.11.003
- Gadgil, A. (2008). Safe and affordable drinking water for developing countries. In: Physics of sustainable energy, using energy efficiently and producing renewably. In D. Hafemeister, B. Levi, M. Levina, & P. Schwartz (Eds.), American Institute of Physics Conference Proceedings (pp. 176–191).
- George, C. K. (2010). Challenges of Lagos as a mega-city. Retrieved 2010, July 12 from http://www.allafrica.com/stories/201002221420.html
- Gleick, P. H. (1996). Basic water requirements for human activities: Meeting basic needs. Water International, 21, 83–92.10.1080/02508069608686494
- Gong, W., Suresh, M. A., Smith, L., Ostfeld, A., Stoleru, R., Rasekh, A., & Banks, M. A. (2016). Mobile sensor networks for optimal leak and backflow detection and localization in municipal water networks. Environmental Modelling and Software, 80, 306–321.10.1016/j.envsoft.2016.02.001
- Haider, H., Sadiq, R., & Tesfamariam, S. (2014). Perfromance indicators for small and medium-sized water supply systems: A review. Environmental Reviews, 22, 1–40.10.1139/er-2013-0013
- Hall, D., & Lobina, E. (2006). Water as a public service. Retrieved from www.world-psi.org.
- Husselmann, M. L., & Van Zyl, J. E. (2006). Effect of stand size and income on residential water demand. Journal of the South African Institution of Civil Engineering, 48, 12–16.
- Huttly, S. R. A., Blum, D., Kirkwood, B. R., Emeh, R. N., Okeke, N., Ajala, M., … Feachem, R. G. (1990). The Imos State (Nigeria) drinking water supply and sanitation Project, 2. Impact on dracunculiasis, diarrhoea & nutritional status. Transactions of the Royal Society of Tropical Medicine & Hygiene, 84, 316–321.10.1016/0035-9203(90)90300-4
- Hutton, G., & Haller, L. (2004). Evaluation of the non-health costs and benefits of water and sanitation improvements at the global level. Geneva: World Health Organization, WHO/SDE/WSH/04.04.
- Jaladhi, V., Dhruv, B., Utkarsha, K., & Mahroof, M. (2016). Online performance assessment system for urban water supply and sanitation services in India. Aquatic Procedia, 6, 51–63.10.1016/j.aqpro.2016.06.007
- Jideonwo, J. A. (2014). Ensuring sustainable water supply in Lagos, Nigeria (MSc Thesis), University of Pennsylvania, USA.
- Keyfitz, N., & Caswell, H. (2005). Applied mathematical demography (3rd ed.). NY: Springer Science+ Business Media.
- Kosec, K. (2014). The child health implications of privatizing africa's urban water supply. Journal of Health Economics, 35, 1–19.10.1016/j.jhealeco.2014.01.006
- Lagos Water Corporation. (2011). Lagos water supply master plan. Retrieved from http://lagoswater.org/wp-content/uploads/2016/04/Lagos-Water-Master-Plan.pdf
- Lagos Water Corporation. (2016). Stakeholder/CSO interaction policy with LSWC.
- Lagos Water Regulatory Commission (LSWRC). (2016). Introduction. Retrieved from http://lswrc.lagosstate.gov.ng/2016/06/10/introduction-2/
- Longe, E. O. (2011). Groundwater resources potential in the coastal plain sands aquifers, Lagos, Nigeria. Research Journal of Environmental and Earth Sciences, 3(1), 1–7.
- Longe, E. O., Malomo, S., & Olorunniwo, M. A. (1987). Hydrogeology of Lagos metropolis. Journal of African Earth Sciences, 6, 163–174.10.1016/0899-5362(87)90058-3
- Longe, E. O., Kehinde, M. O., & Olajide, C. O. (2015). Private sector participation in water supply: Prospects and challenges in Developing Economies. XVth IWRA (International Water Resources Association) World Water Congress on Global water, a resource for development: Opportunities, challenges and constraints, Edinburgh, Scotland, May 25–29, 2015. Retrieved 2016, November 14 from www.iwra.org/congress/resource/abs155_article.doc
- Lu, T., & Smout, I. (2008). Domestic water consumption: A field study in Harbin, China. In 33rd WEDC International Conference, Ghana, 1–4.
- Marson, M., & Savin, I. (2015). Ensuring sustainable access to drinking water in sub Saharan Africa: Conflict between financial and social objectives. World Development, 76, 26–39.10.1016/j.worlddev.2015.06.002
- Martins, O. (2001). Water resources management and development in Nigeria-Issues and challenges in a new millennium. An inaugural lecture delivered at the University of Agriculture, Abeokuta. Retrieved 2001, August 22 from https://www.unaab.edu.ng/attachments/Water%20Resources%20Management%20And%20Development%20In%20Nigeria%20-Issues%20And%20Challenges%20In%20A%20New%20Millenium.pdf
- McDonald, R. I., Weber, K., Padowski, J., Flörke, M., Schneider, C., Green, P. A., … Montgomery, M. (2014). Water on an urban planet: Urbanization and the reach of urban water infrastructure. Global Environmental Change, 27, 96–105.10.1016/j.gloenvcha.2014.04.022
- Mitrica, B., Mitrica, E., Enciu, P., & Mocanu, I. (2017). An approach for forecasting of public water scarcity at the end of the 21st century in the Timis Plain of Romania. Technological Forecasting and Social Changes. doi:10.1016/j.techfore.2017.02.026
- Morote, A. -F., Hernandez, M., & Rico, A. -M. (2016). Causes of domestic water consumption trends in the city of Alicante: Exploring the links between the housing bubble, the types of housing and socio-economic factors. Water, 8(374), 1–18.
- Nairobi City Council. (1977). A supplementary review of the bais and method of water demand forecasting in Nairobi (Unpublished report by M. Cramer and E. Erkmen of the World Bank). Water Sewage Department.
- NBS. (2012). Annual abstract of statistics 2012. National Bureau of Statistics, Federal Republic of Nigeria. Retrieved from http://www.nigerianstat.gov.ng/pdfuploads/annual_abstract_2012.pdf
- Ni, F. -Q., Liu, G. D., Tan, Y. -S., & Deng, Y. (2010). Spatial variation of health risk of groundwater for drinking water supply in Mingshan County, Ya’an City, China. Water Science & Engineering, 3, 454–466.
- Obiora, D. N., & Onwuka, O. S. (2005). Groundwater exploration in Ikorodu, Lagos-Nigeria: A surface geophysical survey contribution. The Pacific Journal of Science and Technology, 6, 86–93.
- Okeke, I., Oyebande, L., & Odunuga, S. (2011). The application of rural threshold water consumption model in water supply studies. Risk in Water Resources Management. Proceedings of Symposium H03, IUGG 2011, Melbourne, Australia, July 2011, IAHS Publication 347: 235–240.
- Olajuyigbe, A. E., Rotowa, O. O., & Adewumi, I. J. (2012). Water vending in Nigeria-A case study of Festac Town, Lagos, Nigeria. Mediterranean Journal of Social Sciences, 3, 229–239.
- Olukanni, D. O., Ajetomobi, M. O., Tebowei, S. O., Ologun, O. O., & Kayode, O. M. (2014). Water supply and sanitation challenges in an urban setting: A case study. International Journal of Engineering and Applied Sciences, 1, 34–38.
- Omole, D. O., Ndambuki, J. M., Badejo, A. A., Oyewo, D. O., & Soyemi, T. O. (2016). Public feedback on state of domestic water supply in Lagos: Implications for public health. Indian Journal of Traditional Knowledge, 15, 245–253.
- Oteri, A. O., & Ayeni, R. A. (2016). Water megacities & global change. Lagos: The Lagos Megacity. Retrieved from http://eaumega.org/wp-content/uploads/2016/05/EN-Lagos-Monograph.pdf
- Oyegoke, S. O., & Sojobi, A. O. (2012). Developing appropriate technique to alleviate the Ogun River network annual flooding problems. International Journal of Scientific and Engineering Research, 3(2), 1–7.
- Oyegoke, S. O., Adeyemi, A. O., & Sojobi, A. O. (2012). The challenges of water supply for a megacity: A case study of Lagos Metropolis. International Journal of Scientific & Engineering Research, 3(2), 1–10.
- Pietrucha-Urbanik, K. (2015). Failure analysis and assessment on the exemplary water supply network. Engineering Failure Analysis, 57, 137–142.10.1016/j.engfailanal.2015.07.036
- Potts, D. (2012). Challenging the myths of urban dynamics in sub-Saharan Africa: The evidence from Nigeria. World Development, 40, 1382–1393.10.1016/j.worlddev.2011.12.004
- Pruss-Ustun, A., Bos, R., Gore, F., & Bartram, J. (2008). Safe water, better health: Costs, benefits and sustainability of interventions to protect and promote health. Geneva: World Health Organization.
- Rajasekar, J., & Khan, S. A. (2013). Training and development function in Omani public sector organizations: A critical evaluation. Journal of Applied Business and Economics, 14, 37–52.
- Romano, G., Salvati, N., & Guerrini, A. (2014). Estimating the determinants of residential water demand in Italy. Water, 6, 2929–2945.10.3390/w6102929
- Rusinga, F., & Taigbenu, A. E. (2005). Groundwater resource evaluation of urban Bulawayo aquifer. Water SA, 31, 23–34.
- Sample, E. D., Awopetu, M. S., & Harou, J. (2013). Modelling urban water use in developing countries. A preliminary application to Lagos Metropolitan Area of Nigeria. International Journal of Engineering Research & Technology, 2, 1388–1400.
- Samuel, N. (1986). Domestic water consumption patterns in selected areas in Nairobi (MSc Thesis). Tempere University, Nairobi.
- Sanctuary, M., Tropp, H., & Haller, L. (2004). Making water a part of economic development. Stockholm. Stockholm International Water Institute and World Health Organization for the Commission on Sustainable Development. Retrieved from http://www.siwi.org/documents/Resources/Reports/CSD_Making_water_part_of_economic_development_2005.pdf
- Saravanan, V. S., & Gondhalekar, D. (2013). Water supply and sanitation as a ‘preventive medicine’: Challenges in rapidly growing economies. Water International, 38, 867–874.10.1080/02508060.2013.857142
- See, K. F. (2015). Exploring and analysing sources of technical efficiency in water supply services: Some evidence from Southeast Asian public water utilities. Water Resources & Economics, 9, 23–44.10.1016/j.wre.2014.11.002
- Serrao-Neumann, S., Renouf, M., Kenway, S. J., & Choy, D. L. (2017). Connecting land-use and water planning: Prospects for an urban water metabolism approach. Cities, 60, 13–27.10.1016/j.cities.2016.07.003
- Smith, H., & Jenkins, P. (2015). Transdisciplinary research and strategic urban expansion planning in a context of weak institutional capacity: Case study of Huambo, Angola. Habitat International, 46, 244–251.10.1016/j.habitatint.2014.10.006
- Sojobi, A. O. (2016). Evaluation of groundwater quality in a rural community in North Central of Nigeria. Environmental Monitoring and Assessment, 188(3), 1–17. doi:10.1007/s10661-016-5549-z
- Sojobi, A. O., Owamah, H. I., & Dahunsi, S. O. (2014). Comparative study of household water treatment in a rural community in Kwara state, Nigeria. Nigerian Journal of Technology, 33, 134–140.10.4314/njt.v33i1.18
- Sojobi, A. O., Danhunsi, S. O., & Afolayan, J. O. (2015). Assessment of the efficiency of disinfection methods for improving water quality. Nigerian Journal of Technology, 34, 907–915.10.4314/njt.v34i4.33
- Sojobi, A. O., Balogun, I. I., & Salami, A. W. (2016). Climate change in Lagos State, Nigeria: What really changed. Environmental Monitoring and Assessment, 188(556), 1–42.
- Stoeglehner, G., Edwards, P., Daniels, P., & Narodoslawsky, M. (2011). The water supply footprint (WSF): A strategic planning tool for sustainable regional and local water supplies. Journal of Cleaner Production, 19, 1677–1686.10.1016/j.jclepro.2011.05.020
- UKEA. (2008). Water and the environment, International comparisons of domestic per capita consumption. Prepared for the United Kingdom Environment Agency by Aquaterra.
- United Nations Centre for Human Settlements. (1996). An urbanizing world: Global report on human settlements. Oxford: Oxford University Press.
- United Nations Human Settlements Programme (UN-Habitat). (2008). The state of African cities 2008. A framework for addressing urban challenges in Africa. Retrieved from mirror.unhabitat.org/pmss/getElectronicVersion.aspx?nr=2574&alt=1
- UN-Water. (2008). Global annual assessment of sanitation and drinking-water. Targeting resources for better results. Geneva: World Health Organization. Retrieved from http://www.who.int/water_sanitation_health/glaas/en/
- Varis, O. (2006). Megacities, development and water. Water Resources Development, 22, 199–225.10.1080/07900620600648399
- Whittington, D., Lauria, D. T., & Mu, X. (1991). A study of water vending and willingness to pay for water in Onitsha, Nigeria. World Development, 19, 179–198.10.1016/0305-750X(91)90254-F
- WHO. (2003). Domestic water quantity, service, level and health. Geneva: World Helath Organization. Retrieved from http://www.who.int/water_sanitation_health/diseases/WSH03.02.pdf
- WHO & UNCF. (2000). Joint monitoring programme. Global water supply and sanitation assessment report. Geneva and New York: World Health Organization and United Nations Children’s Fund. Retrieved from http://www.who.int/docstore/water_sanitation_health/Globassessment/GlobalTOC.htm
- World Bank. (2007). Evaluation of small-scale providers of water supply and sanitation services in Peru. Lima: Author.
- World Bank. (2012). The future of water in African Cities: Why waste water? Retrieved from http://water.worldbank.org/sites/water.worldbank.org/files/publication/iuwm-africa.pdf
- WPP & ADB. (2010). Guidelines for user fees and cost recovery for rural, non-networked, water and sanitation delivery. Water Partnership Program & African Development Bank. Retrieved from http://www.afdb.org/fileadmin/uploads/afdb/Documents/Project-and-Operations/2011_03%20Guidelines%20for%20User%20Fees%20Cost%20Recovery_Rural.pdf
- WSP. (2011). Cost recovery in urban water services. Select experiences in Indian Cities. New Delhi: Water & Sanitation Program, World Bank. Retrieved from https://www.wsp.org/.../publications/WSP-Cost-Recovery-Urban-Water-Services.pdf
- Zérah, M. -H. (2000). Household strategies for coping with unreliable water supplies: The case of Delhi. Habitat International, 24, 295–307.10.1016/S0197-3975(99)00045-4