
 ?Mathematical formulae have been encoded as MathML and are displayed in this HTML version using MathJax in order to improve their display. Uncheck the box to turn MathJax off. This feature requires Javascript. Click on a formula to zoom.
Abstract
Energy is indispensable to human existence, and its need is on the increase daily due to technological advancement. In recent times, there is sporadic increase in the development of modern buildings, and these buildings require a cost-effective and sustainable source of energy. Nigeria and some other African countries have major energy shortage issues due to the insufficient power generation and distribution facilities. This energy poverty creates a challenge for the growing population, and as such, it is vital to ensure that the energy supplied to a building is duly optimized and delivered cost effectively. In this study, an energy audit of an eight-floor multipurpose business complex was performed to determine the nature and type of loads within the building. Based on the load profile and energy consumption over a 10-year period, three alternative energy sources (national grid, diesel generator and photovoltaic [PV] system) were considered using various load-sharing ratios. The result reveals that though PV solar system is a renewable energy source that reduces the production of greenhouse gases generated by burning diesel, its continuous application in low–middle-income country like Nigeria may be challenged by the initial start-up capital which raises the cost of its unit energy.
PUBLIC INTEREST STATEMENT
World cities are filled with modern buildings and skyscrapers with a lot of electrical energy demands. Increased energy generation through non-renewable means increases the production of greenhouse gases that cause global warming, and this makes it vital to ensure that energy is supplied cheaply to buildings and efficiently optimized particularly in developing countries where energy is in short supply. In this study, the cost implication of combining three alternative sources of supply (national grid, diesel generator and photovoltaic [PV] system) to power an eight-floor commercial building in Nigeria is considered using various load-sharing probabilistic ratios. The result shows that the unreliable power supply from the national grid is the cheapest option, while the renewable PV system which is environmentally friendly is capital intensive to setup.
1. Introduction
Energy is pivotal to nation building and technological advancement (Uddin, Shamim Iqbal, & Talukdar, Citation2017, Zhao, Zhang, & Liang, Citation2013). Electrical energy can be generated from renewable and non-renewable sources, and it is one of the major sources of energy that can be easily converted from one form to another. The demand for electricity in commercial buildings is on the increase, especially in Africa, as a result of the rapid growth and development of the economy and also due to urbanization. A number of sub-Saharan African countries are plagued with poor energy infrastructure, with the electricity generated in Africa accounting for just 4% of the global electricity consumption (Eia, Citation2008, Moyo, Citation2009). In Nigeria, energy demand cannot be met by the national grid alone due to inadequate power generation, low transmission and distribution infrastructure coupled with other challenges, leading to frequent power outages and network instability (Agbetuyi, Adewale, Ogunluyi, & Ogunleye., Citation2011, Awosope, Citation2014, Olukoju, Citation2004, Oseni, Citation2011, Samuel, Katende, Awosope, & Awelewa, Citation2017). Nigeria currently generates less than 15% of the estimated national energy demand of 31,000 MW as at 2015 (Adekitan, Adetokun, Shomefun, & Aligbe, Citation2018). This is a threat to economic growth and the advancement of the modern built sector (Imaah, Citation2014).
Technological advancement has stimulated an increase in economic activities and the standards of living, and this, in turn, increases the demand for energy. Most of this energy demand arises from the built environment (offices, homes, factories and so on). The built environment accounts for 40% of the global energy demand and energy consumption in the United States (Lin, Wang, Chen, & Freihaut, Citation2018, Pickering, Hossain, French, & Abramson, Citation2018), and commercial buildings statistically have been seen to consume more energy than residential buildings. According to Sadrzadehrafiei et al. (Citation2012), office buildings consumes 70–300 kWh/m2 of energy, and this is about 10–20 times more than the energy consumption of residential buildings.
The energy efficiency of buildings is an important issue to building owners as it translates to cost (Dinardi, Dinardi, & Torne, Citation2018, Siggelsten, Citation2018). Energy consumption in commercial buildings can be reduced using several approaches such as energy awareness programs and consideration of user behavioural impact. But all these approaches have little impact on the energy demand. A more effective measure is an upgrade in the design of the power source. Commercial buildings have a great energy saving potential (Ghenai & Bettayeb, Citation2017, Keerthi Jain et al., Citation2017), and this can be realized via an adequate assessment of building energy demand and alternative supply source comparative techno-economic analysis. The building energy audit conducted by Woo and Moore (Citation2019) revealed that housing tenure types have a more significant effect on energy consumption as compared with the physical condition of the building, and likewise, the study also emphasized the importance of considering the socio-economic status of the occupant of buildings when developing energy efficiency models for multi-residential buildings. According to Makaremi, Schiavoni, Pisello, and Cotana (Citation2018), a sizable amount of energy can be saved by increasing the indoor surface reflectance properties of buildings, but there is no single design solution for optimal energy savings and high visual quality. To save energy in buildings, a compromise between the quality of the indoor environment and the energy savings may be required (Merabtine & Maalouf, Citation2018).
The increasing global energy demand raises concern in respect to the depleting non-renewable energy sources and the attendant negative effects of fossil fuels on the environment such as climate change, global warming (Leung, Citation2018) and ozone layer depletion. Globally, there is a drift towards the harnessing and utilization of renewable energy sources in a bid to check the negative effect of fossil fuel on the ozone layer by greenhouse gas emissions. This calls for the continuous integration of cost-effective and environmental friendly alternative energy sources in the energy mix. Modern buildings incorporate various forms of green energy either in the form of solar and wind energy sources or by the use of energy-efficient building materials and building design methodologies (Alwetaishi & Gadi, Citation2018) with several in-built automatic switch devices for home automation purposes (Çomaklı & Yüksel, Citation2003, Sadrzadehrafiei et al., Citation2012).
In this study, the electrical energy requirement and supply source alternatives for a commercial building in Nigeria are evaluated using a seven-storey, eight-floor multipurpose office complex as a case study. The design and selection of an optimal and cost-effective energy source combination would serve as a solution to the growing energy demand of the modern-day office, leading to cost and energy savings.
2. Power supply to buildings in Nigeria
Electrical power generation and supply are grossly inadequate in Nigeria for both commercial and domestic uses. The inadequate supply and availability of needed energy are a challenge to sustainable development of the built environment. In spite of this setback, there is a significant increase in building development in Nigeria and in Africa generally due to the increasing population and demand pressure for housing (Mu’Azu, Citation2012). To compensate for the insufficient and unreliable energy from the Power Holding Company of Nigeria (PHCN), office complex depends on other energy sources (such as petrol and diesel generator and inverters) has either a backup or 100% power supply (Adenikinju, Citation2003). This increases the operational cost of businesses in Nigeria.
In a typical office building, there are three major energy consumption areas: Heating, Ventilation and Air Conditioning; lighting (Keerthi Jain et al., Citation2017); and appliances (IT equipment, telecommunication and so on). PHCN records reveal that at least 10% of commercial buildings in Nigeria are classified as Maximum Demand (MD) costumers. MD costumers are heavy energy users that are placed separately on a dedicated transformer. A number of manufacturing companies and government buildings fall in this category. The bulk of the energy consumption in such buildings is typically for cooling needs. According to the studies by Ghenai and Bettayeb (Citation2017) and Mohsen (Citation2011), buildings account for 40% of energy consumption and 36% of CO2 emission, with refrigeration and air conditioning loads accounting for about 70% of the average electrical energy consumption.
This research took place in the south-western region of Nigeria. This is a moderately hot, humid tropical climatic zone, with two major seasons, namely dry season which lasts from October till April and rainy season which starts in March and runs till November. This region has relatively high temperature of about 30°C and low temperature of about 24°C, and this increases the need for air conditioning. This view is also supported by Ghadi and Baniyounes (Citation2018) which reveals that a significant relationship exists between the average air temperature of the environment and energy consumption. A large-scale office is one that spans 1,000 m2 and above, and this research studies the electrical loads and various power supply scenarios of an eight-floor multipurpose office complex. Other methods such as load forecasting have been used previously as in Samuel, Chihurumanya, Adewale, and Awelewa (Citation2014), but this has its demerits when load sharing is being considered.
3. Materials and method
3.1. Data collection
All necessary information concerning the case study was acquired through physical facility inspection, detailed survey and energy audit. Also, relevant data on the seven-storey building office complex under study were provided by the authorities concerned. According to Ian Shapiro (Citation2009), energy audits can be classified into three levels, and these are walkthrough, general and investment grade depending on the thoroughness and the scope of the audit. For this study, data were collected on the building’s layout and electrical energy requirements for ventilation, air conditioning, lighting and so forth.
3.2. Load calculation
An energy evaluation becomes essentially the first step of an energy audit, and it is an assessment, a survey and data-based analysis of the energy flows towards developing an energy management plan or model for the system or building, so as to reduce the total energy consumption without any negative consequence on the system’s output. Second, inferences were made based on the data obtained from the audit, and designs are created for a cost-effective energy supply and efficiency.
A load survey was conducted on the available load capacity of the office complex. The surveyed load was carefully classified using a tally method, and an average power rating was taken for similar devices of different ratings for different equipment manufacturers. The different types of electrical loads and their power rating were identified, and this is presented in Table . Note that this is the calculated building load, but practically, diversity factor will often come into play because all the loads may not be switched on at the same time. The photovoltaic (PV) system must be designed to be able to handle the maximum load with a safety tolerance margin factored in to prevent overloading.
Table 1. The electrical load survey analysis for the building
In Nigeria, official work hour for most companies is usually from 8 am to 5 pm. For the purpose of this project, we are assuming that the office runs for an average of 10 h daily from Monday through Friday. This implies that a five-day work week is used. Using 261 work days per year and over the next 10 years, there are 2,610 work days, taking into cognizance the average number of public holidays in a year.
4. Analysis of the unit cost of energy from alternative power sources
A comparative cost analysis is performed based on a 10-year running period. The unit cost of energy can be determined using thermo-economic method (Moran, Citation1982, Oh et al., Citation2014). The unit cost of electricity from a power generation system (generator, renewable sources) is defined by the cost-balance equation as follows in Equation (1):
The terms are defined as follows:
– Fuel cost per unit
– Fuel consumption rate
– Components of the capital cost
– Unit cost of electrical energy
– Rate of electrical energy generation
For renewable energy sources without fuel (e.g. solar energy), the cost-balance equation is defined in Equation (2) as follows:
The capacity factor Tc can be replaced with the utilization factor of the energy system given in Equation (4)
4.1. The national grid
The estimated total energy consumption (Wh) by the electrical fittings, devices and power loads in the building in a day is 2,234,700 Wh/day. The national energy tariff for commercial users is 35.35 Naira/kWh as determined by National Energy Regulatory Council (NERC).
The total cost of daily consumption = Total daily consumption (kWh) × Tariff = = 2,234.7 × 35.35 = 78,996.645 Naira/day
For the 10-year period assuming a constant NERC tariff, the energy cost for the 2,610 work days is obtained as follows:
Energy cost over 10 years = 78,996.645 × 2610 = N206,181,243.00
4.2. Diesel generator
The load demand of the office complex was found to be 243,320 W, and with a power factor of 0.8, the load in kVA is 304.15 kVA. For the purpose of this analysis, a Cummings 3-phase, 415-V, 50-Hzdieselenginegenerator is selected, with a capacity of 360 kVA and fuel (automotive gas oil) consumption rate of 62 L/h, with a lube oil capacity of 37 L.
Cost of purchase and installation = 30,500,000 Naira
Cost of diesel with yearly inflation considered = 241.8 Naira/L
Daily fuel consumption = 620 L
Daily fuel cost = 62 × 10 × 241.8 = 149,916 Naira
Total daily energy consumption = 2,234,700 Wh/day
Per hour energy consumption for a 10-h work day = 2,234,700/10 = 223,470 Wh
Annual maintenance cost = N 600,000
Factoring all cost over 10 years = 30,500,000 + (149,916 × 2610) + (600,000 × 10) = 427,780,760 Naira
Daily cost of using generator = = 163,900.674 Naira
Per unit cost = =
= 73.34 Naira/kWh
A possible alternative general analysis that was applied by Malami Suleiman, Rabiu Abbas, and Aliyu (Citation2017) is to convert the volumeof diesel into equivalent kWh for a simplified analysis. A litre of diesel is equivalent to 38.6 MJ (Bud, Citation2018), and since 1 kWh is equal to 3.6 MJ, therefore a litre of diesel is equal to 10.72 kWh.
4.3. Photovoltaic solar energy system
Globally, fossil fuel resources are gradually being depleted. Fossil fuel is a major source of environmental pollution and global warming. A decrease in the use and dependence on fossil fuel is significant for an improved civilization without any detrimental effect on the environment. The combustion of 2.56 kWh of fossil fuel is required to generate 1 kWh of electricity, and this produces 0.53 kg of CO2 into the environment, while the quantity of CO2 produced by PV system is estimated as 0.063 kg/kWh, although this does not include the CO2 produced during the manufacturing process of PV modules (Cheng, Yeh, & Tu, Citation2008, Cucchiella, D’Adamo, Gastaldi, & Koh, Citation2012).
Solar power system is a renewable source of energy that uses solar PV cells to convert the radiant energy of the sun into electricity. The electrical energy generated can be used immediately or stored for later use. The energy may be supplied to the grid or combined with other electrical energy sources (renewable and non-renewable). For grid-connected system, a purpose-specific grid-controlled power inverter is used to convert the DC electrical energy generated by the PV system into AC (Dalton, Lockington, & Baldock, Citation2009). The solar PV system is a source of clean electrical energy that can be applied for various energy needs in residential buildings, industry, agriculture, livestock and so forth.
The intensity of the sun incident on a PV panel varies with the rotation of the earth, and consequently, the amount of electric energy that a PV module produces also varies accordingly. The electricity generated by PV modules is dependent on the type and the number of PV panels, the location and positioning of the modules, the efficiency of the PV panels, the efficiency of the other components of the PV system (inverter, the line losses), the prevailing temperature, the use or non-use of solar trackers and so forth. The solar panel can be installed directly on buildings and can be used as a replacement for tiles and other fittings. The PV system is easy to use. It is clean and pollution free and does not contribute to global warming. Also, it has a minimal impact on landscape, and it offers a low operating cost. The major disadvantage of PV system is the high initial setup capital (Ajayi, Ohijeagbon, Mercy, & Ameh, Citation2016, Cucchiella et al., Citation2012).
A solar PV system is an integration of multiple components that must be appropriately selected based on the type of system, the location and the application. The very first step in designing a PV system must be a careful examination of the electrical loads. This is done because component sizing is dependent on the electricity and power demands. This is especially crucial for stand-alone systems. Also, it prevents oversizing as a result of poor load analysis which arises from trying to be safe, and this can be damaging in fields where poor economics is a major drawback.
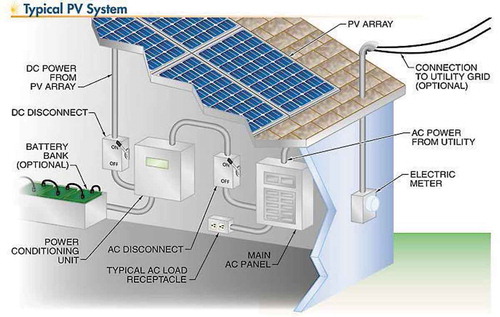
The major components of a solar system are solar charge controller, inverter, battery bank, auxiliary energy sources and load appliances. A typical solar PV system is shown in Figure . The batteries can be connected in parallel or series to achieve the designed energy output. The battery type recommended for use is the deep-cycle battery which is specially designed for rapid recharge, and it can be discharged to low energy levels each day for many years.
Figure 1. A typical solar PV system setup on a building’s roof top.
Source: The grid by Rexel.
4.4. Design parameters for this study
Rated terminal DC voltage: 48 V
Operational hours per day: 10 h
The PV system will mostly serve as a power backup, supplying power only for a fraction of the 10 work hours each day. In order not to oversize the design which would increase the setup capital unnecessarily, the battery capacity must be sized using a reasonable days of autonomy.
Days of autonomy: 1.5 days
Depth of discharge: 50%
Amperage of battery: 2,490 AH
4.5. Battery sizing
Estimated Wh capacity = Total building energy requirement × Days of autonomy = 2,234,700 × 1.5 = 3,352,050 Wh
Depth of discharge = 50% (~0.5)
Battery loss factor = 0.9
Design Wh capacity = 4,469,400/(0.5 × 0.9) = 7,449,000 Wh
Ampere hour rating = 7,449,000/48 = 155,187.50 Ah
Number of batteries required = 155,187.5/2,490 = 62.32 (~64 flooded deep-cycle batteries)
4.6. Inverter sizing
The inverter is required to handle a load of 243,320 W. Therefore, five 60 kW inverters is recommended, and this gives a total capacity of 300 kW and a safety margin of 23.29% redundancy.
4.7. PV panel sizing
Total Watt-hours needed per day = 2,234,700 Wh/day.
Watt-hours needed from the PV system = 2,234,700 × 1.3
The panel generation factor (Nigeria) = 3.41
The overall Watt-peak rating = 2,234,700 × 1.3/3.41 = 851,938.416 Watt-peak
PV power rating per module = 400 Wp
The number of solar panels needed for the design = 851,938.416/400 = 2129.846 panels
Hence, 2,130 solar panels of 400 Wp will be required to supply the building’s electrical energy requirements.
4.8. Charge controller
The solar charge controller rating per string = ISC × 1.3
ISC = Total short circuit current of the PV array
Pm = 400 Wp
Vm = 49.27 V (DC)
Im = 8.12 A
Voc = 61.10 V
Isc = 8.62 A
Minimum rating of the single solar charge controller = (2,130 × 8.62 A) × 1.3 = 23,868.78 A
Using strings of five PV modules per controller = (5 × 8.62 A) × 1.3 = 56.03 A
Hence, 426 charge controllers of 60 A can be used
To analyse the cost requirement of a typical PV system, it is vital to evaluate the lifespan of the solar PV system. According to the Renewable Energy Hub UK, a solar panel has an average life span of 25 years, and it is often sold with a limited product warranty of 10 years (labour and materials) and 25 years of limited power warranty (usually 25 years at 80% and 10 years at 90% continuous power output). Materials used and workmanship have a warranty of 1–2 years, and there is a battery warranty of 5–15 years for non-grid systems and hybrids. The warranty on inverters varies between 5 and 10 years. For the maintenance cost of the solar PV system, only two major things need to be considered over the 25 years; and these are the inverter maintenance and cleaning of the solar PV every 6 months. A cost estimate for setting up the solar PV system, based on the design parameters, is presented in Table .
Table 2. Cost estimate for setting up the solar PV system
Cost of acquisition and installation = 582,260,000 Naira
Annual cost of maintenance = 50,000 Naira
Factoring all cost over 10 years = 582,260,000 + (50,000 × 10) = 582,760,000 Naira
Daily cost of using solar PV system = = 223,279.693 Naira
Per unit cost = =
= 99.92 Naira/kWh
5. Comparative load sharing for the alternative energy sources
In a microgrid, load sharing is the proportional division of the total kW and kVAR load between multiple energy sources in a parallel system. The reliable operation of microgrids can be achieved by properly sharing the load demand among available energy sources within the microgrid. The load sharing depends on the type of energy sources and the characteristics of the microgrid where most of these energy sources are based. The grid integration of renewable energy source (solar PV system) increases the uncertainties as the power generation from renewable energy sources relies heavily on natural sources (e.g. sunlight) which are unpredictable. In such cases, load sharing becomes more challenging as the reliability of the grid degrades. A proper load-sharing technique is necessary to enhance the reliability and cost of the microgrid.
This study employs the technique of applying simple ratio to divide the load demand among the alternative sources, so as to find the cost of using different combinations of energy sources to power the load was carried out. Via a comparative analysis, the most cost-effective means can be determined; three load-sharing scenarios are considered for this purpose.
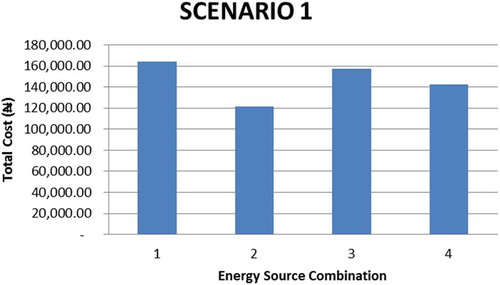
5.1. Scenario 1
The load-sharing ratio and the associated cost for scenario 1 are shown in Tables –. As shown in Figure , the results of the sharing ratio points to combination 2 as being the most cost-effective ratio of the energy sources. Combination 2 is made up of the PHCN grid supplying half of the load demand of the office complex and the diesel generator providing the other half.
Table 3. Ratio of energy sources for scenario 1
Table 4. Load sharing among alternative sources for scenario 1
Table 5. Ratio of the cost of energy sources for scenario 1
Figure 2. Daily cost of supply using scenario 1 source combinations.
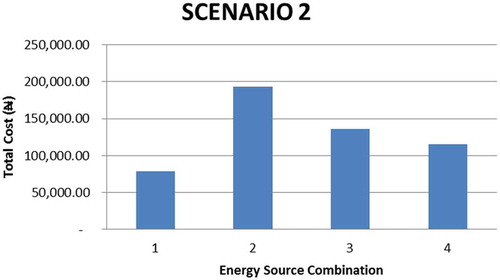
5.2. Scenario 2
The load-sharing ratio and the associated cost for scenario 2 are shown in Tables –. The results of the sharing ratio in scenario 2 imply that combination 1 is the most cost-effective ratio of the energy sources as shown in Figure . This combination comprises of the grid supplying 100% of the power demand to the office complex.
Table 6. Ratio of energy sources for scenario 2
Table 7. Load sharing among alternative sources for scenario 2
Table 8. Ratio of the cost of energy sources for scenario 2
Figure 3. Daily cost of supply using scenario 2 source combinations.
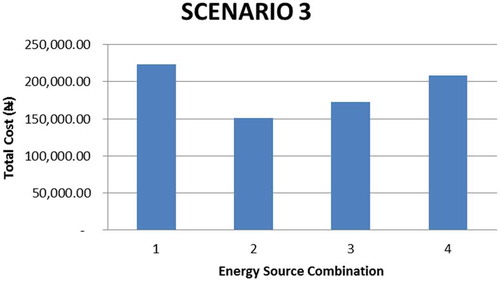
5.3. Scenario 3
The load-sharing ratio and the associated cost for scenario 3 are shown in Tables –1. From scenario 3, it is observed that the most cost-effective energy source by simple ratio is combination 2 as shown in Figure . This combination comprises half of the energy demand of the office complex being supplied by the grid and the remaining half of the energy is supplied by the solar PV system.
Table 9. Ratio of energy sources for scenario 1
Table 10. Load sharing among alternative sources for scenario 1
Table 11. Ratio of the cost of energy sources for scenario 1
Figure 4. Daily cost of supply using scenario 3 source combinations.
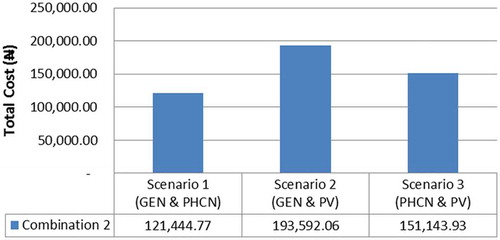
6. Comparative cost analysis for the various energy supply source combinations
Figure shows the cost chart for all the three supply scenarios for the microgrid. It is observed that scenario 2 combination 1 is most cost effective when the PHCN grid is supplying 100% of the load demand of the office complex. This is then followed by scenario 2 combination 4 when the grid is supplying 75% of the load and the solar PV system supplies the remaining 25%. Finally, the next cost-effective source combination is scenario 1 combination 2, in which the diesel generator and the PHCN grid share the supply of the load demand evenly. This implies that in order of ascending cost:
Figure 5. The cost implication of all the supply source combinations for the three scenarios.
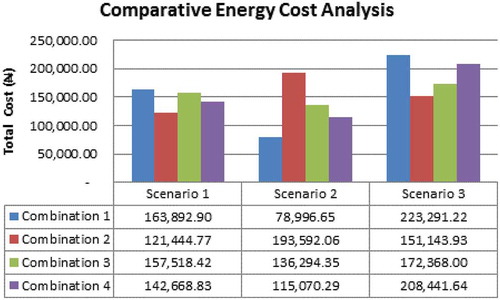
Grid (100%) > grid (75%) & solar PV system (25%) > grid (50%) and diesel (50%)
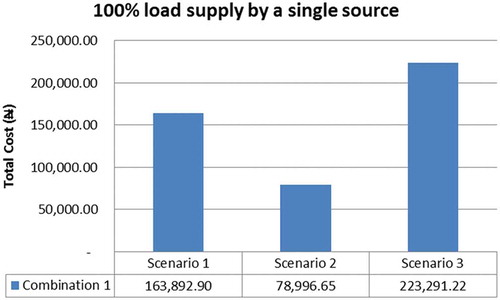
6.1. Comparative cost for a single source supply
From the simple ratio table, and for the three scenarios considered, when each of the energy sources supplies 100% of the load demand, it is observed that there is an increment by order of cost as follows:
Grid > diesel generator > solar PV system
This implies that the most cost-effective energy source is the energy from the PHCN grid as shown in Figure , and therefore, it should be the best choice. This would have been ideal, but the poor state of the national grid is a major challenge due to constant outages as a result of very low power generation and distribution capacity.
Figure 6. The energy cost when a single source supply 100% of the load.
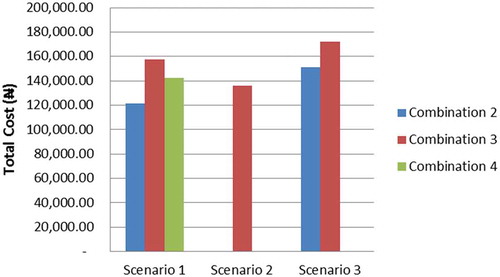
6.2. Comparative cost for maximum 50% load supply by PHCN grid
This analysis considers supply combinations when the national grid supplies not more than 50% of the load. This would mean combinations 2, 3 and 4 from scenario 1, combination 3 from scenario 2 and combinations 2 and 3 from scenario 3 as shown in Figure . The analysis shows that scenario 1 combination 1 is most cost effective, at grid producing 50% and below of the total load demand.
Figure 7. The energy cost with PHCN grid supplying a maximum of 50% of the load.
6.3. Comparative cost when diesel generator supplies a portion of the load
In Nigeria, the use of renewable energy sources is at its infant stage, and buildings having solar PV installations are scarce to find. The reality is that dependence is on fossil fuel-powered generators for needed energy. During the day, smoke from various generator exhausts can be seen rising to the sky at many commercial areas, and in the evening, the use of generators coupled with the smoke and engine noise becomes predominant in the residential areas.
The comparative cost when the diesel generator supplies a portion of the load and the solar PV system also supplies at least a portion of the load. The supply source combinations that satisfy this condition are plotted in Figure .
Figure 8. The energy cost with diesel generator and solar PV supplying at least a portion of the load.
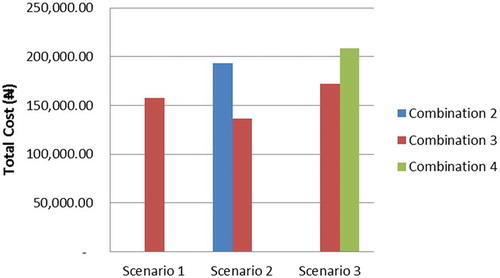
The result shows that for the two lowest cost supply combinations, there is an increment by order of cost as follows:
Grid (50%) & DIESEL (25%) & solar PV (25%) > grid (25%) & diesel (50%) & solar PV (25%)
6.4. Comparative cost when two sources supply 50% of the load each
In this analysis, supply combinations when the total load demand is shared equally between two supply sources are considered as shown in Figure .
Figure 9. The energy cost when two sources supply 50% of the load each.
From Figure , it can be seen that the most expensive combination has gotten from scenario 2 combination 2. This is the combination of energy from the diesel generator and solar PV, and the high cost is as a result of the huge capital outlay for setting up a PV system coupled with the recurring maintenance cost and increasing price of diesel for the diesel generator.
From all the cost analysis performed, it is clear that the energy cost is cheapest when sourced from the national PHCN power grid. This cost advantage cannot be fully utilized due to the unreliability and the frequent outages of the PHCN grid. Within the first 4 months of 2018, the national grid has completely collapsed four times, and when available, less than 15% of the estimated national energy demand is generated. Diesel generator is the common alternative, deployed by the most commercial buildings, and from the analysis, it offers a good cost advantage over solar PV system in the short run, due to high setup capital of PV systems. Diesel is a fossil fuel, and like other fossil fuels, the world is gradually running out of supply of non-renewable energy sources. Coupled with this is the production of greenhouse gases by the combustion of diesel which depletes the ozone layer and thereby destroying the environment.
It is vital to include renewable energy sources in the energy mix as a sustainable panacea to the high energy needs of a modern building (Ghenai & Bettayeb, Citation2017). According to Jo, Aldeman, Lee, and Ahn (Citation2018), renewable energy-based power systems are more efficient when connected to the public grid than when it is setup as a standalone off-grid system. This also creates an opportunity for selling excess energy generated by the renewable energy source to the public, thereby reducing the payback time and the unit energy cost of the renewable energy source.
Scenario 2 combination 3 is the recommended option, although this is not the cheapest option, but it combines renewable solar PV-based supply in the energy mix and also creates an opportunity to sell excess generated energy to the public while at the same time reducing the production of greenhouse gases by diesel generators. Also, since the PV system will supply only 25% of the load, it can be redesigned to handle this reduced load, thereby drastically reducing the initial setup capital.
7. Conclusion
The energy demand of an eight-floor multipurpose office complex in the south-western region of Nigeria was profiled and analysed towards determining the cost-effective approach for powering the building’s electrical load. Three sources of electrical energy were considered and these are PHCN public grid supply, diesel generator and solar PV system. The unit cost of energy for the three alternative sources was determined using initial setup capital and the operational running cost analysis over a 10-year period. Load-sharing probabilistic ratio approach is then applied to determine the cost of powering the building’s total electrical loads using various percentage combinations of the alternative energy supplies. The result reveals that energy from the national PHCN grid is the cheapest, but this is challenged by network instability and fluctuations in supply which disrupt the business activities. Diesel generator is a viable alternative to the unreliable public supply, but the burning of fossil fuel is a major source of greenhouse gases globally, and efforts are constantly being made to protect the ozone layer by reducing the sources of ozone-depleting substances. Solar PV system is a renewable energy source, which is sustainable and clean. The use of solar PV system is challenged by the high initial setup and installation capital. Hence, as carried out by this study, there is a need to always find a balance between these operational realities towards ensuring a cost-effective energy supply without a consequential damage to the environment. A further area of study will be the inclusion of other renewable sources such as wind energy.
Acknowledgements
The authors appreciate Covenant University Centre for Research, Innovation and Discovery for supporting the publication of this research study.
Additional information
Funding
Notes on contributors

Adeyinka Ajao Adewale
Adeyinka A. Adewale is a registered electrical engineer in Nigeria. He had both his BSc and MSc degrees from the University of Lagos in 1998 and 2004, respectively, and a PhD degree in Information and Communication Engineering in 2017 from the Department of Electrical and Information Engineering, Covenant University, Ota. He had worked in the industry as an electrical/electronics engineer and had handled projects on electrical installations and computer networking and as an electronics engineer/observer in the seismic industry. At present, he is a lecturer and researcher at the Department of Electrical and Information Engineering, Covenant University, Ogun State, Nigeria. This research was necessary to minimize the cost of energy in an environment of epileptic power supply to reduce overreliance on the mains and greenhouse effect caused by alternative energy sources like diesel generators. It is expected that with this research, some huge or excessive energy bills will be prevented.
References
- Adekitan, A. I. , Adetokun, B. , Shomefun, T. , & Aligbe, A. (2018). Cost implication of line voltage variation on three phase induction motor operation. Telkomnika (Telecommunication Computing Electronics and Control) , 16. doi:10.12928/telkomnika.v16i4.9628
- Adenikinju, A. F. (2003). Electric infrastructure failures in Nigeria: A survey-based analysis of the costs and adjustment responses. Energy Policy , 31, 1519–1530. doi:10.1016/S0301-4215(02)00208-2
- Agbetuyi, A. , Adewale, A. A. , Ogunluyi, J. O. , & Ogunleye., D. S. (2011). Design and construction of an automatic transfer switch for a single phase power generator. International Journal of Engineering Science , 3(4), 1–7.
- Ajayi, O. O. , Ohijeagbon, O. D. , Mercy, O. , & Ameh, A. (2016). Potential and econometrics analysis of standalone RE facility for rural community utilization and embedded generation in North-East, Nigeria. Sustainable Cities and Society , 21, 66–77. doi:10.1016/j.scs.2016.01.003
- Alwetaishi, M. , & Gadi, M. (2018). Toward sustainable school building design: A case study in hot and humid climate. Cogent Engineering , 5. doi:10.1080/23311916.2018.1452665
- Awosope, C. A. 2014. Nigeria electricity industry: Issues, challenges and solutions. In Covenant University 38th Public Lecture , (Vol. 3, pp. 1–36) Ed. Public Lecture Series. Covenant University Press: Ogun State, Nigeria.
- Bud, L. (2018). Rochester airport generates own power. Retreived 20th March from http://www.wxxinews.org/post/rochester-airport-generates-own-power.
- Cheng, J.-H. , Yeh, C.-H. , & Tu, C.-W. (2008). Trust and knowledge sharing in green supply chains. Supply Chain Management: An International Journal , 13, 283–295. doi:10.1108/13598540810882170
- Çomaklı, K. , & Yüksel, B. (2003). Optimum insulation thickness of external walls for energy saving. Applied Thermal Engineering , 23, 473–479. doi:10.1016/S1359-4311(02)00209-0
- Cucchiella, F. , D’Adamo, I. , Gastaldi, M. , & Koh, S. C. L. (2012, Dec 01). Renewable energy options for buildings: Performance evaluations of integrated photovoltaic systems. Energy and Buildings , 55, 208–217. doi:10.1016/j.enbuild.2012.08.029
- Dalton, G. J. , Loc; kington, D. A. , & Baldock, T. E. (2009, Jan 04). Feasibility analysis of renewable energy supply options for a grid-connected large hotel. Renewable Energy , 34, 955–964. doi:10.1016/j.renene.2008.08.012
- Dinardi, P. T. , Dinardi, M. N. T. , & Torne, I. G. (2018). Analysing of energy efficiency in a school buildings: Case study. In 2018 Simposio Brasileiro de Sistemas Eletricos (SBSE) (pp. 1–6). IEEE. doi:10.1109/SBSE.2018.8395568
- Eia, U. (2008). Annual energy review 2008 . Department of Energy (DOE) Energy Information Administration (EIA). ISBN: 9780160833915.
- Ghadi, Y. Y. , & Baniyounes, A. M. (2018). Energy audit and analysis of an institutional building under subtropical climate. International Journal of Electrical and Computer Engineering (IJECE) , 8, 845–852. doi:10.11591/ijece.v8i2
- Ghenai, C. , & Bettayeb, M. , “Optimized design and control of an off grid solar PV/hydrogen fuel cell power system for green buildings,” in IOP Conference Series: Earth and Environmental Science , 2017. doi: 10.1088/1755-1315/93/1/012073
- Ian Shapiro, P. E. (2009). Energy audits in large commercial office buildings. ASHRAE Journal , 51, 18–27.
- Imaah, N. O. (2014). Sustainable construction: the dilemma of the high-rise building in a developing country such as Nigeria. Retrieved from: https://www.irbnet.de/daten/iconda/CIB10316.pdf
- Jo, J. H. , Aldeman, M. , Lee, H. S. , & Ahn, Y. H. (2018). Parametric analysis for cost-optimal renewable energy integration into residential buildings: Techno-economic model. Renewable Energy , 125, 907–914. doi:10.1016/j.renene.2018.03.025
- Keerthi Jain, K. , Kishore Kumar, N. , Senthil Kumar, K. , Thangappan, P. , Manikandan, K. , Magesh & P. Lighting electrical energy audit and management in a commercial building. in Proceedings of 2nd International Conference on Intelligent Computing and Applications , Singapore, vol. 467, ed. 2017, pp. 463–474, Singapore. doi:/10.1007/978-981-10-1645-5_39
- Leung, B. C. M. (2018). Greening existing buildings [GEB] strategies. Energy Reports , 4, 159–206. doi:10.1016/j.egyr.2018.01.003
- Lin, B. , Wang, D. , Chen, Z. , & Freihaut, J. (2018). Inverse energy model development via high-dimensional data analysis and sub-metering priority in building data monitoring. Energy and Buildings , 172, 116–124. doi:10.1016/j.enbuild.2018.04.061
- Makaremi, N. , Schiavoni, S. , Pisello, A. L. , & Cotana, F. (2018). Effects of surface reflectance and lighting design strategies on energy consumption and visual comfort. Indoor and Built Environment . doi:10.1177/1420326X18793170
- Malami Suleiman, S. , Rabiu Abbas, M. , & Aliyu, A. (2017). Investigation of energy conservation potentials in Kaduna Polytechnic (Vol. 30). Nigeria: Penerbit Akademia Baru.
- Merabtine, A. , & Maalouf, C. A. Al Waheed Hawila , N. Martaj , & G. Polidori . (2018). Building energy audit, thermal comfort, and IAQ assessment of a school building: A case study,”. Building and Environment , 145, 62–76. doi:10.1016/j.buildenv.2018.09.015
- Mohsen, B. B. (2011). Energy efficiency in non-residential building in tropical climate . University Technology Malaysia. Retrieved from http://eprints.utm.my/id/eprint/26059/
- Moran, J. (1982). Availability analysis: A guide to efficient energy use . Englewood Cliffs, NJ: Prentice-Hall.
- Moyo, D. (2009). Dead aid: Why aid is not working and how there is a better way for Africa . Farrar, Straus and Giroux: Macmillan.
- Mu‘Azu, A. I. (2012). Scenario of energy consumption of office buildings in Abuja (Vol. 2. pp. 96–105). Nigeria.
- Oh, S.-D. , Yoo, Y. , Song, J. , Song, S. J. , Jang, H.-N. , & Kim, K. (2014, Jan 05). A cost-effective method for integration of new and renewable energy systems in public buildings in Korea. Energy and Buildings , 74, 120–131. doi:10.1016/j.enbuild.2014.01.028
- Olukoju, A. (2004). ‘Never expect power always’: Electricity consumers’ response to monopoly, corruption and inefficient services in Nigeria. African Affairs , 103, 51–71. doi:10.1093/afraf/adh004
- Oseni, M. O. (2011, dec 01). An analysis of the power sector performance in Nigeria. Renewable and Sustainable Energy Reviews , 15, 4765–4774. doi:10.1016/j.rser.2011.07.075
- Pickering, E. M. , Hossain, M. A. , French, R. H. , & Abramson, A. R. (2018). Building electricity consumption: Data analytics of building operations with classical time series decomposition and case based subsetting. Energy and Buildings , 177, 184–196. doi:10.1016/j.enbuild.2018.07.056
- Sadrzadehrafiei, S. , Sopian, K. , Mat, S. , Lim, C. , Hashim, H. , & Zaharim, A. (2012). Enhancing energy efficiency in office buildings in a tropical climate, Malaysia. International Journal of Energy and Environment , 6, 209.
- Samuel, I. A. , Chihurumanya, F.-N. , Adewale, A. A. , & Awelewa, A. A. (2014). Medium-term load forecasting of covenant university using the regression analysis methods. Journal of Energy Technologies and Policy , 4, 10–16.
- Samuel, I. A. , Katende, J. , Awosope, C. O. A. , & Awelewa, A. A. (2017). Prediction of voltage collapse in electrical power system networks using a new voltage stability index. International Journal of Applied Engineering Research , 12, 190–199.
- Siggelsten, S. (2018). Heat cost allocation in energy efficient multi-apartment buildings. Cogent Engineering , 5. doi:10.1080/23311916.2018.1438728
- Uddin, M. S. , Shamim Iqbal, S. K. , & Talukdar, M. I. K. (2017). Household energy and environmental analysis to highlight the impact of modern energy access in Bangladesh. Cogent Engineering , 4. doi:10.1080/23311916.2017.1399510
- Woo, J. , & Moore, T. (2019). An end-user-focused building energy audit: A high-density multi-residential development in Melbourne, Australia. In Green Energy and Technology , 75–90. (ed.). doi:10.1007/978-981-10-7880-4_6
- Zhao, L. , Zhang, J.-L. , & Liang, R.-B. (2013). Development of an energy monitoring system for large public buildings. Energy and Buildings , 66, 41–48. doi:10.1016/j.enbuild.2013.07.007