
Abstract
A diagnostic of fluorosis, such as dental and skeletal fluorosis caused by excess fluoride in drinking and cooking water, is endemic in at least 25 countries around the globe; the number of patients would be in the tens of millions. Other reports have estimated that more than 70 million people in the world suffer from dental or skeletal fluorosis. Since many people in developing countries rely on groundwater for their drinking water and are unable to access any other water resources, the removal of fluoride from drinking water is urgently needed. In the current research, fluoride (F−) was removed from well water using a novel batch electrolysis system composed of carbon electrodes and two cells separated by a membrane diaphragm with the goal of its application in developing countries. The removal of F− was investigated using synthesized well water with various levels of F− and magnesium (Mg2+) at a constant current. As the electrolysis progressed, Mg(OH)2 precipitation appeared in the cathode cell, which co-precipitated with F− by forming a complex. No chemicals are needed, since the Mg2+ already in the well water is utilized for the precipitation of magnesium hydroxide. The F− removal rate gradually increased with the increase of Mg2+ concentration up to 80% when the Mg2+ concentration was 200 mg/L. The F− concentration slightly affected the F− removal rate above 50 mg/L of Mg2+ in the solution. The system’s capability to achieve F− concentration of less than 1 mg/L, which is the Sri Lankan standard for drinking water, was examined using Sri Lankan groundwater with typical F− and Mg2+ concentrations. Well-water samples—183 from the Anuradhapura and 56 from the Polonnaruwa regions—were used for the estimation. The system showed high capability as 84% and 72% for Anuradhapura well water and for Polonnaruwa well water, respectively. It was confirmed that a high percentage of well water having F− concentrations of more than 1 mg/L could be treated by the electrolysis system without the addition of any chemicals.
PUBLIC INTEREST STATEMENT
An electrolysis system composed of carbon electrodes and two cells separated by a diaphragm was developed to remove fluoride from drinking water. Excess fluoride in drinking water has caused dental fluorosis and skeleton fluorosis mainly in developing countries. The number of the patients is estimated as more than 70 million. The electrolysis system needs no chemicals, and provides easy operation. The system performance highly depends on fluoride concentration and magnesium concentration, since fluoride is removed by co-precipitation with magnesium hydroxide which formed in the cathode cell with an increase of pH value. The applicability of the system was examined by using synthesized water and actual well water having various magnesium and fluoride concentrations. The applicability of the system to decrease the fluoride concentration less than 1 mg/L was estimated by using fluoride and magnesium of the Sri Lankan well water. It was found to be as high as 70–80%.
1. Introduction
The United Nations Children’s Fund (UNICEF) reported that a diagnostics of fluorosis, such as dental and skeletal fluorosis caused by excess fluoride in drinking and cooking water, is endemic in at least 25 countries around the globe; the number of patients would be in the tens of millions (UNICEF, Citation1999). Other reports have estimated that more than 70 million people in the world suffer from dental or skeletal fluorosis (Chilton, Dahi, Lennon, & Jackson, Citation2006; Fawell et al., Citation2006). In addition to fluorosis, the relationship between fluoride intoxication and chronic renal failure is suspected (Chandrajith, Dissanayake, Ariyarathna, Herath, & Padmasiri, Citation2011; Dharmaratne, Citation2015; Lantz, Jouvin, De Vernejoul, & Druet, Citation1987). Since many people in developing countries rely on groundwater for their drinking water and are unable to access any other water resources, the ability to remove fluoride from drinking water to make it safe for human consumption is an urgent need.
Sri Lanka is one of 25 countries in which many people suffer from dental fluorosis and bone fluorosis (Dissanayake, Citation1996). In the Anuradhapura district of Sri Lanka, approximately 90% of children under 15 years of age reportedly suffer from dental fluorosis (Tennakoon, Citation2004). In such areas, water resources other than well-water are not available due to the limited amount of rainfall. Therefore, to prevent such health problems, the removal of fluoride from drinking water is inevitable.
Many technologies are available for removing fluoride from drinking water, including, reverse osmosis (RO) (Fawell et al., Citation2006; Sehn, Citation2008), electrodialysis (ED) (Amor et al., Citation1998; Hichour, Persin, Molénat, Sandeaux, & Gavach, Citation1999), ion exchange resins (Singh, Kumar, Sen, & Majumdar, Citation1999; Solangi, Memon, & Bhanger, Citation2009), adsorption techniques such as activated aluminum (Salifu et al., Citation2013; Tripathy, Bersillon, & Gopal, Citation2006) and electrocoagulation (EC) with aluminum electrodes (Drondina & Drako, Citation1994; Mameri et al., Citation1998; Ming et al., Citation1983; Shen, Chen, Gao, & Chen, Citation2003). Though many technologies are available, the startup and maintenance costs as well as the price of advance technologies were prohibitive in developing countries. Especially RO, ED, and ion exchange resins, which demonstrate high ion removal efficiency, including fluoride, have not been affordable for countries such as Sri Lanka. However, it has been demonstrated that EC does not require a large investment (Mameri et al., Citation1998). In the Anuradhapura district of Sri Lanka, more than ten EC with aluminum electrodes followed by sand filtration systems were operated in which fluoride was co-precipitated with aluminum hydroxide eluted from the electrode by electrolysis (Padmasiri & Jayawardene, Citation2011). Even though EC is good enough to remove fluoride, residual aluminum, which may be harmful to consumers, could contaminate drinking water. According to the regional support center of the north central province of the National Water Supply and Drainage Board (Sri Lanka’s main water provider), some systems could not meet the Sri Lankan water quality standard (SLSI, Citation1983) due to higher concentrations of aluminum in the treated water. In addition, scared of the elution of the electrodes into the drinking water, people refused to use the water. Accordingly, half of the EC plants have been abandoned.
In the current research, an electrolysis system composed of carbon electrodes as well as cathode and anode cells separated by a diaphragm made of a clay panel was newly proposed. In the system, F− is removed by co-precipitation with magnesium hydroxide precipitated in the cathode cell along with an increased pH level during electrolysis. As opposed to EC with aluminum electrodes, no chemicals are eluted from the electrodes. In addition, no chemicals are needed, since the Mg2+ already in the well water is utilized for the precipitation of magnesium hydroxide. In order to elucidate the performance of the electrolysis system in relation to concentrations of F− and Mg2+, the removal of F− was tested for synthesized well water with various concentrations of F− and Mg2+. In addition, assuming the application of the system to actual well water, water from 183 and 56 well was collected from the Anuradhapura and Polonnaruwa regions, respectively, in Sri Lanka to determine their concentrations of F− and Mg2+, since well water in the Anuradhapura and Polonnaruwa districts of Sri Lanka was reported to have high concentrations of F− and Mg2+(Kawakami, Motoyama, Nagasawa, Weragoda, & Chaminda, Citation2014; Weragoda & Kawakami, Citation2017). Based on the F− removal rate obtained from the synthesized well water and on the concentrations of F− and Mg2+ in actual Sri Lankan well water, the system’s capability was evaluated.
2. Materials and methods
2.1. Electrolysis system
Electrolysis experiments were carried out using a batch reactor at room temperature as shown in Figure . The electrolysis cell utilized was a rectangular cell (17 × 18.0 × 9 cm3) made of plastic. The cell was separated into two equal cells by using a membrane filter (ADVANTEC, Japan) made of mixes cellulose ester with a pore size and an area of 0.2 µm and 50 cm2, respectively, as a diaphragm. The membrane diaphragm will be replaced with a thin porous clay panel in an actual use. The direct current (100 mA) was supplied to the electrodes comprised of three carbon electrode rods (φ5 mm × 100 mm, Narika Corp., Japan) for each cell.
Figure 1. Electrolysis system.
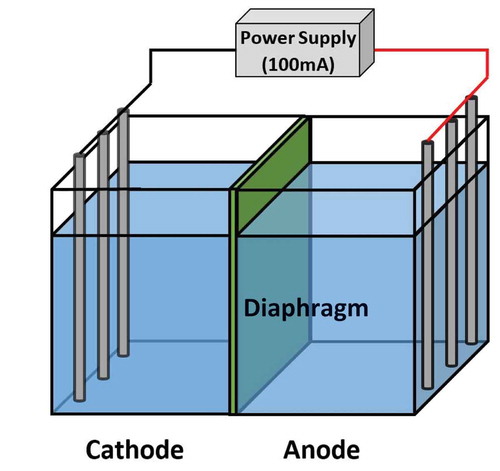
Each anode and cathode cell was filled with 300 mL of synthesized well water with various concentrations of F− and Mg2+, where the solution simulated actual groundwater. The ion concentrations of the synthesized well water are summarized in Table .
Table 1. Synthesized well water
Electrolysis was carried out under a constant current of 100 mA for 1 hour, ensuring the same charge (360°C) for all experiments. Water samples were taken from the anode and cathode cells at relevant time intervals to measure changes in the ion concentrations in the solutions. The samples were filtrated with a membrane filter (pore size 0.45 µm) immediately after the sampling to ensure the stability of water quality. White precipitation that appeared in the cathode cell was separated from the solution by a membrane filter (pore size 0.45 µm) and oven-dried at 105°C to obtain well dried samples for XRD analysis and for chemical analysis. For chemical analysis, the precipitation was dissolved with nitric acid, and the solution was analyzed via ion chromatography.
The electrolysis system was applied to six actual well-water samples taken from Anuradhapura, Sri Lanka, in addition to synthesized well water for checking the performance.
2.2. Well-water survey
To assess the capability of the proposed system to well water, F− and Mg2+ concentrations in well-water samples collected randomly from dug and tube wells were analyzed. A respective total of 183 and 56 samples were collected from Anuradhapura and Polonnaruwa regions. To stabilize the water quality, well water was filtrated on site using a membrane filter with a pore size of 0.45 µm. The collected water samples were brought to Japan and stored in a refrigerator at 4℃ until analysis.
2.3. Chemicals and analyses
All chemicals and reagents used in the experiment were analytical grade and purchased from Wako Chemicals, Japan. Anions were analyzed using an ion chromatograph (ICS 2000; separation column: Ion Pac AS18; eluent: KOH 23–40 mmol/L gradient; Thermo Scientific, USA). Cations were analyzed using an ion chromatograph (ICS 1500; separation column: Ion Pac CS12; eluent: MSA 30 mmol/L isocratic; Thermo Scientific, USA). XRD analysis was performed using a MiniFlex X-ray (30 kV/15 mA; radiation Cu K-alpha line Ni filter; scintillation detector; Rigaku Co. Ltd., Japan). Measurement of pH was carried out by the glass electrode method (Orion Star A324; Thermo Scientific, USA).
3. Results and discussion
3.1. Selective removal of F− and Mg2+
Figures and show typical changes in the ion concentration ratios (ion concentration at time t [Ct]/initial ion concentration [Ci]) of anions and cations with increasing electrolysis time in the cathode and anode cell, respectively, in RUN-12. Since RUN-12 showed the maximum F− and Mg2+ removal as compared with other experiments, RUN-12 was selected for better illustrations. According to Figure ), it is obvious that F− and Mg2+ were selectively removed from the cathode cell. The concentrations of anions other than F−, which decreased slightly in the cathode cell, increased in the anode cell (Figure )). The concentrations of cations other than Mg2+, which increased slightly in the cathode cell, decreased in the anode cell (Figure )). Therefore, some of the anions (with the exception of F−) were thought to be transferred from the cathode cell to the anode cell by the Coulomb force.
Figure 2. Changes in anion and cation concentrations in the cathode cell during electrolysis (RUN-12).
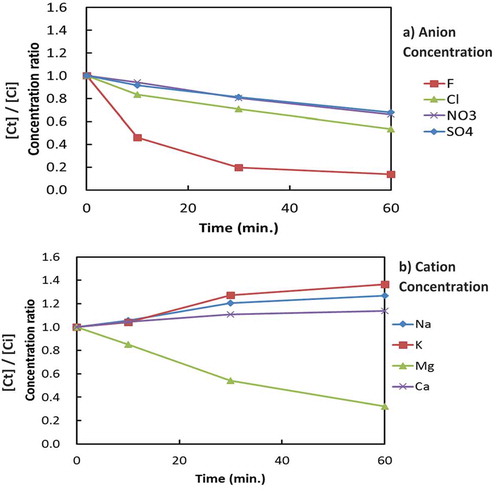
Figure 3. Changes in anion and cation concentrations in the anode cell during electrolysis (RUN-12).
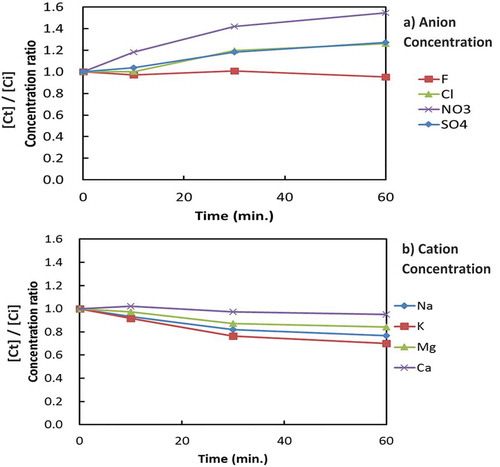
Similarly, some of the cations were thought to be transferred from the anode cell to the cathode cell by the Coulomb force. However, the significant decreases in the concentrations of F− and Mg2+ in the cathode cell without increases in the anode cell indicate that both of the ions in the cathode cell were removed from the system.
3.2. The removal mechanism of F− and Mg2+
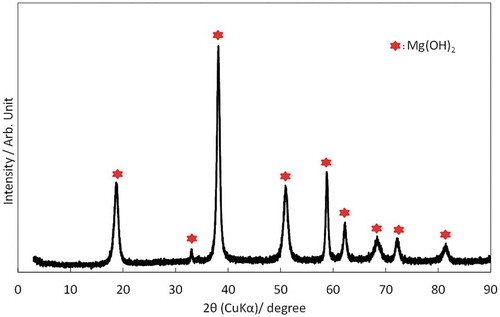
While electrolysis was progressing, white precipitation appeared (Figure ) and accumulated in the RUNs containing Mg2+. The amount of precipitation seemed to increase with an increase in the concentration of Mg2+. The precipitation collected in RUN-06 (F−: 2.0 mg/L; Mg2+: 50 mg/L) was analyzed via XRD to identify its chemical composition. According to the XRD pattern shown in Figure , all peaks of the precipitate were consistent with those of Mg(OH)2. The Ksp value of Mg(OH)2 and the maximum pH value were taken into consideration for confirmation of the formation of Mg(OH)2 precipitation.
Figure 4. White precipitation in the cathode cell during electrolysis.
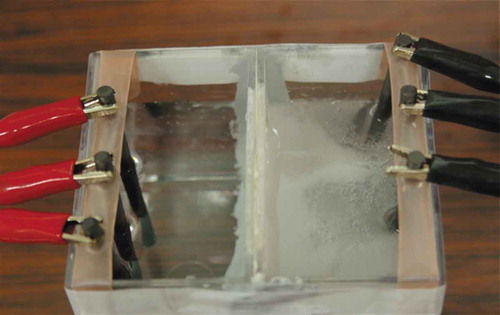
Figure 5. XRD pattern of the precipitation (RUN-06).
The changes in pH in RUN-06 with the time in the cathode and anode cells are shown in Figure . In the anode cell, the pH value decreased to 2.5, while in the cathode cell, it increased to 10.1 at 10 minutes of electrolysis. Taking the Ksp of magnesium hydroxide as 1.2 × 10⁻¹¹ (mol/L)3 into consideration, 18 mg/L was obtained as the soluble Mg2+ concentration at a pH of 10.1 in the solution of the cathode cell, which was well below the initial concentration of Mg2+. The immediate decrease of Mg 2+ in Figure ) and immediate increase of pH in the cathode cell (Figure ) indicated that Mg(OH)2 formation could take place in the cathode cell from an early stage of the electrolysis.
Figure 6. Changes in pH in the cathode and anode cells (RUN-06).
Since the similar radii of the hydroxide ion and the F− ion could cause the exchange of ions between them (Jiménez-Reyes & Solache-Ríos, Citation2010), F− was considered to be removed via co-precipitation with magnesium hydroxide by forming the most promising complex, Mg(OH)F. Even though the XRD pattern does not confirm the presence of a magnesium fluoride complex, the existence of F− and Mg2+ in the precipitation was confirmed by the chemical analysis. Thirty-nine milligrams of the dried precipitation collected in RUN-06 was analyzed via ion chromatography after dissolution by nitric acid. The chemical composition is shown in Table . 16.5 mg of Mg2+ and 0.28 mg of F− were present in the precipitation. These amounts of Mg2+ and F− in the precipitation coincided well with those removed by the electrolysis from the solution in RUN-06 (16.8 mg and 0.28 mg, respectively).
Table 2. Chemical composition of the precipitation (RUN-06)
3.3. The effect of F− and Mg2+ concentrations on F− removal
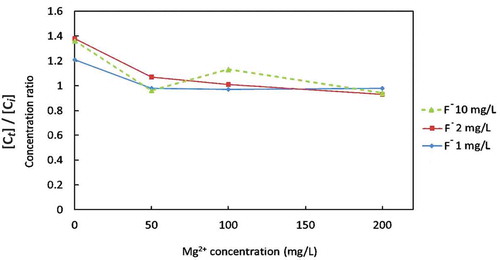
The effect of Mg2+ and F− concentrations on F− removal was examined by varying the F− and Mg2+ concentrations in the synthesized well water as shown in Figure . The combination of the concentrations of Mg2+ and F− in the synthesized well water is described in Table . According to Figure , a zero concentration of Mg2+ showed a 23%, 39%, and 41% removal of F− for 1 mg/L, 2 mg/L, and 10 mg/L of the initial F− concentrations, respectively. This is regarded as removal by the Coulomb force, since the same amount of F− was observed to increase in the anode cell. With increasing magnesium concentrations, the F− removal rate gradually increased to 80%. The initial F− concentration did not affect the F− removal rate when the Mg2+ concentration was more than 50 mg/L. Figure shows the change in the F− concentration ratio in the anode cell at the end of electrolysis with various initial concentrations of Mg2+ and F−. When the Mg2+ concentration was 0, the F− concentration increased by the Coulomb force as described previously. On the other hand, when the Mg2+ concentration was more than 50 mg/L, no significant increase of the F− concentration was observed, indicating that the F− was removed by the co-precipitation in the cathode cell. The effect of other components than Mg2+ and F− on the F− removal would be insignificant. The change in the concentration of Na+ and Cl− indicated in Table seems not to have affected the F− removal as shown in Figure . The chemical composition of the precipitation in Table revieled that Na+, K+ and Ca2+ were the minor components among cations and SO4 2- was the minor component among anions. It is unlikely that these components affected the formation of precipitation concerning F− removal.
Figure 7. Changes in the F− removal rate as the Mg2+ and F− concentrations change in the cathode cell.
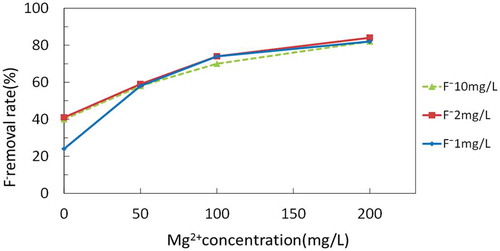
Figure 8. Concentration ratio of F− at the end of the electrolysis in the anode cell.
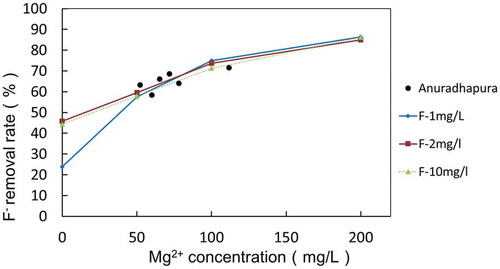
The electrolysis system was applied to six actual well water samples taken from Anuradhapura, Sri Lanka. Table shows the F− and Mg2+ concentrations of the well water and the F− removal rate. The relationship between the F− removal rate and the Mg2+ concentration is plotted in Figure for comparison with that of synthesized well water. The plots came close to the curves, indicating that the system worked similarly for both the synthesized well water and the actual well water.
Table 3. Well-water quality and F− removal rate
Figure 9. Comparison of F− removal between synthesized well water and actual well water.
3.4. Estimation of Mg2+ concentration required to remove F−
Supposing that only the concentrations of F− and Mg2+ affect the F− removal rate, the F− removal rate can be estimated from the concentrations of F− and Mg2+ by using the relationship shown in Figure when the initial concentrations of F− and Mg2+ are known. Inversely, the Mg2+ concentration required to remove fluoride to a certain level by this electrolysis system can be calculated. Examples 1 and 2 show how to estimate the required Mg2+ concentration.
Example 1: For well water containing 2 mg/L of F−, in order to meet the Sri Lankan standard of 1 mg/L (SLSI, Citation1983), at least 50% removal is needed. With an initial F− concentration of 2 mg/L, Figure demonstrates that 26 mg/L of Mg2+ is required to achieve 50% removal of F−.
Figure 10. Estimation of the Mg2+ concentration needed to achieve a F− concentration of 1 mg/L.
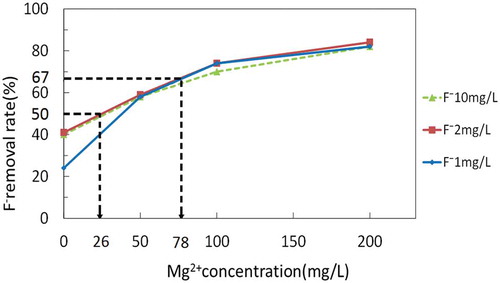
Example 2: For well water containing 3 mg/L F−, 67% of the F− must be removed to achieve 1 mg/L. With an initial F− concentration of 3 mg/L, Figure demonstrates that 78 mg/L of Mg2+ is required to achieve 67% removal of F−. Figure shows the relationship between F− and Mg2+ concentrations in well water to achieve F− concentrations of 1.0 mg/L in the treated water estimated in this manner,
Figure 11. Boundary line showing the combination of F− and Mg2+ concentrations in well water needed to achieve F− concentrations of 1 mg/L in treated water.
3.5. The proposed system’s capability to Sri Lankan ground water
As discussed in the previous section, well water that has a combination of F− and Mg2+ concentrations below the boundary line indicated in Figure could have concentrations of F− of less than 1.0 mg/L in treated water, which meets the Sri Lankan standard. To measure the capability of the above method to Sri Lankan ground water, the boundary line was compared with F− and Mg2+ concentrations in the ground water of the Anuradhapura and Polonnaruwa districts. Figures and 1 show the distribution of Mg2+ and F− concentrations in the Anuradhapura and the Polonnaruwa district, respectively, as it relates to the boundary line. The dashed line represents the Sri Lankan F− standard for drinking water. Well water with a F− concentration of less than 1.0 mg/L does not need treatment since it meets the standard value. Well water having a F− concentration of more than 1.0 mg/L requires treatment. Well water in which a combination of F− and Mg2+ concentrations is below the solid boundary line can be treated properly with the electrolysis system. However, wells that were plotted above the solid boundary line cannot be treated with the system. In the Anuradhapura area, well water that does not require treatment was 52 %, and the capability of the electrolysis was 72%. In the Polonnaruwa area, well water that does not require treatment was 66 %, and the capability of the electrolysis was 84%.
Figure 12. Distribution of F− and Mg2+ in the Anuradhapura district.
Figure 13. Distribution of F− and Mg2+ in the Polonnaruwa district.
4. Conclusions
F− was removed from well water using a batch electrolysis system composed of carbon electrodes and two cells separated by a membrane diaphragm. In the system, F− was removed by co-precipitation with Mg(OH)2 formed in the solution by a high pH level in the cathode cell. No chemicals are needed, since Mg2+ already in the well water was utilized for the formation of magnesium hydroxide. The F− removal rate increased gradually with an increase of the Mg2+ concentration up to 80% when the Mg2+ concentration was 200 mg/L. The F− concentration slightly affected the F− removal rate above 50 mg/L of Mg2+ in the solution. Therefore, the combination of the concentrations of F− and Mg2+ existing in the well water determines the F− concentration in the treated water. A boundary line with regard to the combination of F− and Mg2+ concentrations was established to achieve a F− concentration of less than 1 mg/L, which meets the Sri Lankan standard for drinking water. The boundary conditions were compared with the 183 and 56 well-water samples collected from the Anuradhapura and Polonnaruwa regions in Sri Lanka, respectively, to estimate the system’s capability. Comparison showed that the capability of the electrolysis was 72% in Anuradhapura and 84% in Polonnaruwa. A high percentage of well water having F− concentrations of more than 1 mg/L could be treated by the electrolysis system without the addition of any chemicals.
Additional information
Funding
Notes on contributors
Tomonori Kawakami
Tomonori Kawakami is currently a professor at the environmental and civil engineering department of the Toyama Prefectural University, Japan. He has a Ph.D. in engineering from Tokyo University, Japan. The authors work on fluoride removal and arsenic removal from drinking water in developing countries such as Sri Lanka and Bangladesh. They use an electrolysis system to remove fluoride and arsenic by a co-precipitation, since it works without any additional chemicals and it provides easy operation. The mechanism is applicable to waste water treatment as well. They have published articles about the electrolysis system.
References
- Amor, Z. , Malki, S. , Taky, M. , Bariou, B. , Mameri, N. , & Elmidaoui, A. (1998). Optimization of fluoride removal from brackish water by electrodialysis. Desalination , 120(3), 263–271. doi:10.1016/S0011-9164(98)00223-9
- Chandrajith, R. , Dissanayake, C. B. , Ariyarathna, T. , Herath, H. M. J. M. K. , & Padmasiri, J. P. (2011). Dose-dependent Na and Ca in fluoride-rich drinking water–Another major cause of chronic renal failure in tropical arid regions. The Science of the Total Environment , 409(4), 671–675. doi:10.1016/j.scitotenv.2010.10.046
- Chilton, J. , Dahi, E. , Lennon, M. , & Jackson, P. (2006). Fluoride in Drinking-water. World Health , 408(1), 693–713.
- Dharmaratne, R. W. (2015). Fluoride in drinking water and diet: The causative factor of chronic kidney diseases in the North Central Province of Sri Lanka. Environmental Health and Preventive Medicine, 20(4), 237-42. doi:10.1007/s12199-015-0464-4.
- Dissanayake, C. B. (1996). Water quality and dental health in the dry zone of Sri Lanka. Geological Society , 113, 131–140. doi:10.1144/GSL.SP.1996.113.01.10
- Drondina, R. V. , & Drako, I. V. (1994). Electrochemical technology of fluorine removal from underground and waste waters. Journal of Hazardous Materials , 37(1), 91–100. doi:10.1016/0304-3894(94)85037-2
- Fawell, J. , Bailey, K. , Chilton, J. , Dahi, E. , Fewtrell, L. , & Magara, Y. (2006). Fluoride in Drinking-water . London: World Health Organization, IWA publishing. ISBN 9789241563192
- Hichour, M. , Persin, F. , Molénat, J. , Sandeaux, J. , & Gavach, C. (1999). Fluoride removal from diluted solutions by Donnan dialysis with anion-exchange membranes. Desalination , 122(1), 53–62. doi:10.1016/S0011-9164(99)00027-2
- Jiménez-Reyes, M. , & Solache-Ríos, M. (2010). Sorption behavior of fluoride ions from aqueous solutions by hydroxyapatite. Journal of Hazardous Materials , 180(1–3), 297–302. doi:10.1016/j.jhazmat.2010.04.100
- Kawakami, T. , Motoyama, A. , Nagasawa, S. , Weragoda, S. , & Chaminda, T. (2014). Groundwater quality atlas of Sri Lanka . Kandy: Sanduni Offset Printers.
- Lantz, O. , Jouvin, M. H. , De Vernejoul, M. C. , & Druet, P. (1987). Fluoride-induced chronic renal failure. American Journal of Kidney Diseases : the Official Journal of the National Kidney Foundation , 10(2), 136–139. doi:10.1016/S0272-6386(87)80046-X
- Mameri, N. , Yeddou, A. R. , Lounici, H. , Belhocine, D. , Grib, H. , & Bariou, B. (1998). Defluoridation of septentrional Sahara water of north Africa by electrocoagulation process using bipolar aluminium electrodes. Water Research , 32(5), 1604–1612. doi:10.1016/S0043-1354(97)00357-6
- Ming, L. , Yi, S. R. , Hua, Z. J. , Lei, B. Y. W. , Ping, L. , & Fuwa, K. C. (1983). Elimination of excess fluoride in potable water with coarcervation by electrolysis using aluminium anode. Fluoride , 2, 54–63.
- Padmasiri, J. P. , & Jayawardene, W. M. (2011). Water purification using electrocoagulation as a viable solution for upgrading rural water supply schemes. Proceedings of the water professional’s day (pp. 63–69) Peradeniya, Sri Lanka.
- Salifu, A. , Petrusevski, B. , Ghebremichael, K. , Modestus, L. , Buamah, R. , Aubry, C. , & Amy, G. L. (2013). Aluminum (hydr)oxide coated pumice for fluoride removal from drinking water: Synthesis, equilibrium, kinetics and mechanism. Chemical Engineering Journal , 228, 63–74. doi:10.1016/j.cej.2013.04.075
- Sehn, P. (2008). Fluoride removal with extra low energy reverse osmosis membranes: Three years of large scale field experience in Finland. Desalination , 223(1–3), 73–84. doi:10.1016/j.desal.2007.02.077
- Shen, F. , Chen, X. , Gao, P. , & Chen, G. (2003). Electrochemical removal of fluoride ions from industrial wastewater. Chemical Engineering Science , 58, 987–993. doi:10.1016/S0009-2509(02)00639-5
- Singh, G. , Kumar, B. , Sen, P. K. , & Majumdar, J. (1999). Removal of leachate fluoride using from spent pot liner ion exchange. Water Environment Research , 71(1), 36–42. doi:10.2175/106143099X121571
- Sri Lanka Standard Institution . (1983). Sri Lanka standards for potable water-(SLS 614). In Drinking water standards (pp. 16). Colombo: Sri Lanka Standard Institution.
- Solangi, I. B. , Memon, S. , & Bhanger, M. I. (2009). Removal of fluoride from aqueous environment by modified Amberlite resin. Journal of Hazardous Materials , 171(1–3), 815–819. doi:10.1016/j.jhazmat.2009.06.072
- Tennakoon, T. M. M. (2004). Prevalence of dental fluorosis in the district of Anuradhapura, Sri Lanka. Proceedings of the 4th International Workshop on Fluorosis Prevention and Defluoridation of Water, Colombo, Sri Lanka.
- Tripathy, S. S. , Bersillon, J. L. , & Gopal, K. (2006). Removal of fluoride from drinking water by adsorption onto alum-impregnated activated alumina. Separation and Purification Technology , 50(3), 310–317. doi:10.1016/j.seppur.2005.11.036
- UNICEF . (1999). Fluoride in water: An overview. Water Front , (13), 11–13.
- Weragoda, S. K. , & Kawakami, T. (2017). Evaluation of groundwater quality in 14 districts in Sri Lanka: A collaboration research between Sri Lanka and Japan. In F. Kurisu , A. L. Ramanathan , A. A. Kazmi , & M. Kumar (Eds.), Trends in Asian water environmental science and technology (pp. 151–155). Cham: Springer International Publishing.