
 ?Mathematical formulae have been encoded as MathML and are displayed in this HTML version using MathJax in order to improve their display. Uncheck the box to turn MathJax off. This feature requires Javascript. Click on a formula to zoom.
Abstract
The study empirically estimates the relative technical efficiency of Nigeria upstream petroleum industries and its determinants using non-parametric and parametric analysis. The non-parametric analysis’ results reveal that joint venture contract operators, marginal field contract operators, sole risk contract operators, production sharing contract operators, service contract operator and national oil company contract have the following technical efficiency grades: 75%, 67%, 65%, 64%, 42% and 23%, respectively. On the other hand, the parametric analysis result indicates that four of the selected independent variables are statistically significant determinants of the upstream technical performance. The findings support the plan exit of cash calls policy by the government and confirm that the proposed exit of the model is not harmful to both the government and the investors. For the indigenous participants, we submit that the government may put in place attractive incentives policy to encourage more indigenous participation in the upstream business.
Public Interest Statement
One of the major challenges faced by petroleum-producing countries today is how to reliably know the technical performance (TP) of the industry’s operators and its determinants for effective policy formulation. The study engaged non-parametric analytics approach (NAA) to estimate upstream TP and parametric analysis approach (PAA) to identify its determinants in Nigeria upstream environment. NAA results reveal that joint venture contractors, marginal field contractors, sole risk contractors, production sharing contractors, service contract operatorand national oil company recorded the following TP grades, respectively: 75%, 67%, 65%, 64%, 42% and 23%. Similarly, PAA results indicate that four of the selected independent variables are statistically significant determinants of Nigeria upstream TP. Our findings support the plan exit of cash calls policy and confirm that the proposed exit is not harmful to both parties. However, we advise the government to put in place attractive incentives to attract more indigenous participants.
1. Introduction
Petroleum upstream industry worldwide can be described as a technically oriented sector due to sub-surface complexities (Zhenhua et al., Citation2018). Due to the nature of the sub-surface where petroleum is found, most endowed countries consider knowing the technical performance (TP) of the industry as a key to sustainable returns on investments. It is, however, difficult to differentiate between TP of an industry and its technical efficiency (TE). This study considers these two performance indicators as the same in relation to Nigeria upstream industry. Nigeria is one of the major petroleum-producing countries in the world today and the biggest in sub-Saharan Africa (Echendu & Iledare, Citation2015). In 2000, Nigeria petroleum exports contributed about 98% and 14% to exports earnings and gross domestic products, respectively (Tafamel & Akrawah, Citation2015). The oil proved reserves of about 37 billion barrels and estimated gas proved reserves of about 188 trillion standard cubic feet (Tscf) which make Nigeria to be one of the 10 most influential petroleum-producing nations in the world today (OPEC, Citation2017).
Similarly, Odularu (Citation2012) opined that the contributions of oil and gas to Nigeria’s economy are vital to its economic sustainability. Based on this, Nigeria government makes several efforts through its Big Win Initiative and policies to ensure that the sector delivers both economic and political dividends to its people. Some of the government’s priorities in short and medium terms are to ensure investment sustainability across the oil value chain, transform from being an importer into a net exporter as well as adding value via downstream processes. But, how far can the government go without having adequate information on the TP of the upstream industry’s operators and the determining factors for a sustainable policy formulation?
Kumbhakar and Lovell (Citation2003) explained that a firm is said to be technically efficient (TE) if such a firm can achieve a maximum level of operational outputs considering the allowable input(s). On the other hand, it is also regarded as efficient if the firm can minimize its inputs considering a certain level of output(s). Oil and gas companies are expected to produce a certain volume of outputs based on the allocated proved reserves by the host country. For Organization of Petroleum Exporting Countries (OPEC) members such as Nigeria, each country has a quarterly production quota set by OPEC. Therefore, an operator or group of companies has a responsibility to contribute an allocated volume of oil to the centre. Based on this, the TP of each of these operators is important to the total production volume of the producing country. Relative technical efficiency (RTE) measurement for petroleum industry is premised on the production technology of the industry as represented by the general production function. To carry out this estimation, an output-oriented data envelopment analysis framework is preferred because oil and gas business is highly capital intensive and, in most cases, rely on borrowed capital. In this regard, one of the petroleum investors’ major aims is how to quickly recover the invested (borrowed) capital and make profits for the shareholders.
The study seeks to estimate RTE for each of the Nigeria upstream operators within the period 2010–2016, examine the operators’ TE determinants and suggest policies for a sustainable development of the sector. To achieve the first objective, the study engages a non-parametric method characterized as a variable return to scale-data envelopment analysis (VRTS-DEA). Roman and Gotiu (Citation2017) describe DEA as a non-parametric method of estimating production efficiency frontiers. DEA technique bases its estimation on linear programming to measure the relative performance of related firms that are using multiple inputs to produce multiple outputs (Morita & Avkiran, Citation2009). In addition, an economic analysis was conducted using a parametric model (fixed effects regression model) to analyse the determinants of TE and the impacts on operator’s efficiency level in a relative sense. Based on the results obtained from the two analysis, specific policies are suggested for optimal upstream development in Nigeria.
The structure of this paper is divided into five broad sections. Section 2 briefly reviews the DEA literature in relation to variable return to scale (VRTS) assumption, constant return to scale (CRTS) assumptions and regression analysis (parametric). The two methodological frameworks used in the study, i.e. non-parametric and parametric, are discussed in Section 3. This is followed by Section 4 which concentrates on the presentation and analysis of the empirical results. Finally, the study makes concluding remarks by suggesting policies for optimum upstream development in Nigeria and perhaps for other petroleum producing countries.
2. Literature review
DEA method allows the combination of multiple outputs and multiple inputs to measure TE. It is estimated using the ratio of weighted outputs to that of weighted input framework (Li, Li, & Wu, Citation2013a; Li, Yang, & Liu, Citation2013b; Song, Li, Zhang, He, & Tao, Citation2014; Toloo & Nalchigar, Citation2009; Zarepisheh, Soleimani-Damaneh, & Pourkarimi, Citation2006; Zheng & Park, Citation2016). The method has been in use for evaluating the performance of a related decision-making units (DMUs) for over a decade. DEA knowledge was first conceived and presented by Farrell (Citation1957), his work gave an insight into measuring production technology effectiveness using DEA. An improvement on Farrell’s work was made by Charnes, Cooper, and Rhodes (Citation1978). They tagged Farell DEA model as CRTS which most authors referred to today as (Charnes, Cooper & Rhodes) CCR model.
Another improvement was made by Banker, Charnes, and Cooper (Citation1984); they expanded CCR model to becoming VRTS model which is now tagged as BCC (Banker, Charnes & Cooper) or VRTS model. VRTS model considers unideal cases where production scale could be decreasing, increasing or constant (Idowu, Iledare, & Dada, Citation2019). Nigeria upstream operational environment is a typical example of unideal oil and gas operational environment due to factors such as unstable upstream policies, political instability, challenges posed by the Niger Delta militants, delays in obtaining necessary permits or licences among others. In line with this observation, the study engages output VRTS-DEA model to estimates technical efficiency scores for all the 32 active upstream operators covering the period from 2010 to 2016.
Toloo and Nalchigar (Citation2009) developed a novel integrated DEA model for ascertaining the most VRTS-efficient DMUs, which was previously not the case. The relevance of the purported integrated model was exemplified with the aid of a real data set which comprises 19 facility layout alternatives. Few years later, Foroughi (Citation2013) presented a revised and generalized model with improved discrimination for finding the most efficient DMUs in DEA. In that paper, Foroughi concluded that the models published by Toloo and Nalchigar (Citation2009) for VRTS models may not be feasible. In a bid to improve the Toloo and Nalchigar (Citation2009) integrated DEA model, Toloo (Citation2012) presented a paper that addressed the shortcomings in Toloo and Nalchigar (Citation2009). An unexampled integrated DEA model was presented to ascertain the most VRTS efficient DMU. Moreover, Wang, Yu, and Zhang (Citation2013) gave the following two advantages of the VRTS model over that of CRTS model. The first one is that the VRTS model produces RTE which could be decreasing, increasing or constant. Secondly, the weighted outputs combination could be maximized and minimized, simultaneously.
Regarding the parametric method of analysis, Wolf (Citation2009) examined company ownership effects on the performance of the global oil and gas industry. He investigated whether there were systematic performance differentials between national oil companies (NOCs) and the international oil companies (IOCs) covering the period from 1987 to 2006 using regression analysis. He grouped the companies into four different ownership categories, using four indicators, the study resolved that ownership type is very important. He stated that private ownership inspires better efficiency than state ownership. Eller, Hartley, and Medlock (Citation2010) also used DEA methodological framework to evaluate differences in technical efficiency between IOCs and NOCs. They obtained consistent results with another method. However, they used only three-year data which is from 2002 to 2004 unlike the current study which is considering data from 2010 to 2016.
Eller et al. (Citation2010)’s analysis focused on two groups while this study groups Nigeria operators into six distinct categories. Ike and Lee (Citation2014) engaged both non-parametric analysis and parametric analysis to measure productive efficiency and its determinants, respectively. Their work concentrated on NOCs and IOCs efficiency difference without considering the local or marginal oil fields operators. They suggested policies based on the results obtained from the secondary analysis using the non-parametric method. In this study, we extended the time interval of the previous studies and divided the 32 active Nigeria operators into six groups based on contracts, namely,joint venture contract operators (JVCO), production sharing contract operators (PSCO), service contract operator (SCO), sole risk contract operators (SRCO), marginal field contract operators (MFCO) and NOC. Based on this categorization, important upstream policies were suggested for optimum development of Nigeria upstream operations.
3. Methodological frameworks
In this section, we discuss the non-parametric and parametric analytic methods used to estimate RTE and its determinants, respectively. Data used for these analyses and their sources are also explained subsequently.
3.1. Non-parametric analysis framework-DEAF
Non-parametric models are basically described as a distribution-free models because the models are based on fewer or no assumption. It differs precisely from the parametric model in that the parameter set is not fixed, i.e. it either increases or even decreases if new pertinent information is collected (Murphy, Citation2012). DEA is an example of a non-parametric model that engages a linear programming framework to measure productive efficiency of DMUs. Fundamentally, DEA is used for related firms that engage at least two inputs to produce several outputs (Sepehrdoust & Rajabi, Citation2011a; Sepehrdoust, Citation2011b). DEA optimizes the ratio of the sum of weighted outputs to the sum of weighted inputs and solves for a group of weights that satisfies a set of linear equations (Rouse, Putterill, & Ryan, Citation1997). RTE takes values ranging from 0 to 1; it is 1 when a particular operator is fully TC, but less efficient when the efficiency index is less than 1.
In addition, an efficient production unit achieves the highest possible outputs using the available inputs, while the outputs proportion guarantees maximum revenue (Kocisova, Citation2014). In the first stage of this study, the following mathematical specifications were used to generate the needed variable return to scale technical efficiency index (VRTSteindex) for each of the 32 active operators in the sample. In doing this, the listed and defined below mathematical notations were used:
Notation and definition of terms
| q | = | input variable |
| p | = | output variable |
| J | = | operator index, j = 1, 2, ……, n. |
| n | = | number of operators in the sample, n = 32 |
| = | rth input data for operator j | |
| = | ith output data for operator j, | |
| s | = | number of output variables, s = 2 |
| = | output index, | |
| m | = | number of input variables, m = 2 |
| = | input index, | |
| = | weight given to | |
| = | weight given to | |
| = | relative technical efficiency index with VRTS’s assumption | |
| = | an unrestricted in sign, free variable that is associated with convexity constraint. |
The fractional version of the VRTS model is given as;
subject to
To derive the linear VRTS-DEA model, the sum of weighted inputs () in EquationEquation 1(b)
(1b)
(1b) is assumed to be equal to 1 as shown in EquationEquation (2)
(2)
(2) .
Based on the assumption above, output-oriented VRTS-DEA model is formulated; EquationEquation 3(a)(3a)
(3a) represents the objective function subjected to EquationEquation 3(b–d)
(3a)
(3a) in order to estimate
:
subject to
To estimate the efficiency index for each of the 32 operators, we coded EquationEquation 3(a–d)(3a)
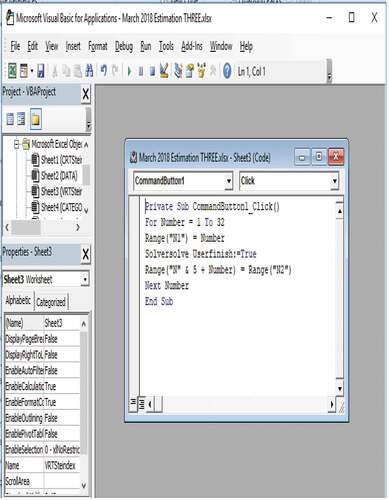
(3a) into a Microsoft excel spreadsheet aided with visual basic for applications (VBA) as shown in Table and Figure . VBA was used to ensure TE indexes were generated simultaneously. The analysis was carried out using output oriented-VRTS-DEA model because petroleum businesses worldwide are highly capital intensive. So, most oil and gas upstream investors focus more on how to maximize oil and gas production for timely return on investments and good profits margin.
Table 1. Input and output variables
Figure 1. A Visual Basic for Application (VBA) input
3.2. Parametric analysis framework-panel data estimation
Parametric statistical analysis assumes that sample data originates from a given population that follows a probability distribution based on a fixed set of parameters (Geisser & Johnson, Citation2006). One example of a parametric analysis is a balance micro panel data estimation. This was carried out to identify TE determinants in Nigeria exploration and production (E & P) operational environment. The study estimated a balance micro panel data model to establish the relationship between RTE (dependent variable) and five exogenous factors known as independent variables. The panel data model comprises a sample of six categories of the upstream firm based on the type of contract arrangements, namely, JVCOs, PSCOs, SCO, SRCOs, NOC and MFCOs. Our estimation covered a time period of seven years between 2010 and 2016. The approach is unique and similar to the studies conducted by Banker and Natarajan, (Citation2008a), Ike and Lee (Citation2014), Pardo (Citation2016, Citation2010), etc.
Baltagi, Bratberg, and Holmås (Citation2005) stated that panel data controls for individual heterogeneity, less collinearity among variables and has the capacity to track trends in the data which is impossible for time-series or cross-sectional data. Besides, more degrees of freedom and efficiency are achieved with panel data (Gujarati & Porter, Citation2009). Prior to estimating the parameters of the specified panel data model, the study ascertained which of the estimation models or specification among random effect (RE), fixed Effect (FE) and pooled OLS is suitable for the analysis using Hausman test (Baltagi et al., Citation2005; Hausman, Citation1978; Wooldridge, Citation2002). A central assumption in random effects estimation is that random effects are uncorrelated with the explanatory variables. The chi-square statistic from the Hausman test provides adequate evidence against the null hypothesis that there is mis-specification. Thus, the test results led to the selection of FE regression for the estimation of the parameters of the panel data as against the study conducted by Ike and Lee (Citation2014).
3.3. Data sources and analysis
The variables used for non-parametric analysis in stage one of this study are as shown in Table . The inputs and outputs data used were obtained from the Nigerian Department of Petroleum Resources (DPR), Nigerian Bureaus of Statistics, Nigerian National Petroleum Corporation (NNPC) and Ministry of Petroleum Resources. However, to avoid the challenges of imbalances in the data magnitude, we mean normalized the data collected as recommended by Sarkis (Citation2007). Also, looking at the fact that oil and gas reserves are keenly related, we used barrels of oil equivalent (BOE) as the unit of measurement for oil and gas proved reserves.
Table 2. VRTS-DEA Model Equation 3(a–d) coded in a Microsoft excel spreadsheet to estimate efficiency (2010–2016)
Similarly, in the regression analysis of the panel data, we engaged E-view Econometric Software Package Version 9.0. To carry out the analysis, five independent variables which affect both local and international petroleum investors were considered. These independent variables were transformed by log to prevent the challenges posed by imbalances in the data magnitude and improve normality. The five variables are as follows:
Gross taxes paid per year by each operator as a proxy for upstream policy (4.11$/bbl.);
World crude oil demand per year (WCOD) as reported by Statista in million barrels per year (MMBBL/YR)
Operator’s experience (OEXP) based on the date of first oil mining lease (years);
Proved gas reserves to production ratio (RPGas) direct calculation;
Proved oil reserves to production ratio (RPOil) direct calculation.
5. Presentation of results and analysis
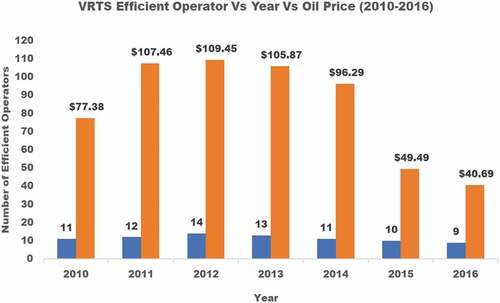
The output-oriented VRTS model results as reported in Table reveals a decreasing trend in RTE of the operators in Nigeria from 2010 to 2016. The efficiency indexes were higher from 2010 up till 2012 compared to between 2012 and 2016. This change may be connected to the increased average crude oil price between 2010 and 2012 and the decreasing trend between 2012 and 2016. Figure illustrates these trends notwithstanding the global economic downturn during the period. In other words, this could mean that operators’ TE responds strongly to crude oil price volatility. Similarly, about 43% of the operators were efficient in 2010 and 2011 respectively while the number of efficient operators reduced to below 42% from 2012 to 2013 and later reduced to an average of 34% in between 2014 and 2016. However, the study uses the decision criteria shown in Table to classify the operators’ TE indexes within the period as follows: about 37% of the operators were TE within the period, 6% performed above average, 10% in the average position, 25% performed below the average while the remaining 22% ranked to be inefficient.
Table 3. Technical efficiency decision criteria
Table 4. Non-parametric analysis results for all the 32 active operators from 2010 to 2016
Figure 2. Sensitivity analysis of efficient operators and crude oil prices per year (2010–2016)

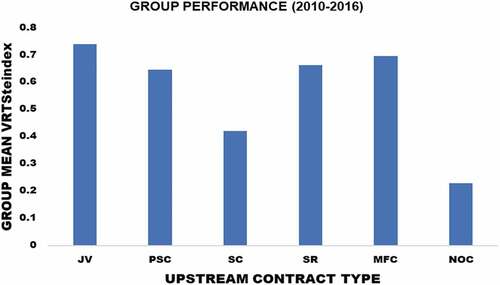
In summary, the group mean performance chart for the five upstream contract arrangements and the NOC is shown in Figure , while Table shows that three of the JVC operators (JVCO5, JVCO2, JVCO3) recorded TE indexes of 100% despite the cash calls challenges. The appearance of the 3 JVC operators on the efficient production frontier may be linked to the increasing investments on new technologies to ensure a proportionate oil and gas production. The SRCOs as well as PSCOs recorded mean TE indexes of 65% and 64%, respectively. The eight MFCOs which are mainly indigenous companies recorded higher mean indexes of about 67% compared to 9 SRCs. Nigeria owned NOC recorded 23% TE index, which means that the company was about 77% inefficient within the period. This agrees with some previously reported observations, which in most cases linked NOC poor performance to the overbearing host government interest, a dearth of experts and politics (Eller et al., Citation2010; Wolf, Citation2009).
Figure 3. Group mean performances of Nigeria’s upstream contract arrangements (2010–2016)
The parametric analysis results shown in Table reveals (based on probability value) that the proxy determinants of TE are statistically significant at the conventional level of 5% and 10%. The coefficients of these determinants possess the right sign except the proxy for WCOD. Similarly, constant is also highly significant having the expected sign. On the contrary, GTAX (policy) is statistically insignificant at the conventional significant level. All the independent variables are expressed in percentages; thus, 1% increase in WCOD will on the average bring about 3.57% reduction in TE indexes of the operator. This implies that WCOD impacts negatively on the variation of the TE index of the operators. This is contrary to the a priori expectation and the plausible explanation for this development is the quota system carries out by OPEC.
Table 5. Parametric analysis outputs (Panel model analysis)
Further, increasing OEXP by 1% will on the average bring about 0.37% increase in TE index. By implication, the number of years a particular upstream operator has been in operation enhances its TP positively. So, the more experience on the job, the greater the TE. Likewise, when RPOIL and RPGas are increased by 1%, TE will on the average reduce by 7.56% and 3.95%, respectively. This suggests that proved reserve to production ratio affect TE of the operators negatively. Put differently, the longer the period it takes a firm to deplete its reserve, the less technical efficient the firm becomes. On the contrary, 1% increase in GTAX brings about 1.9% reduction in TE. This implies that increasing upstream taxes via government policy may lower the operators’ TE as well as reducing the gross revenue. Ordinarily, paying more taxes to the host government tends to increase the cost of operation of a firm.
The R2 statistic shows that the specified independent variables (GTAX, WCOD, OEXP, RPOIL and RPGAS) accounted for 90.2% variation in the dependent variable TE indexes, while the adjusted R2 depicts that the independent variables are responsible for 88.4% variation in the dependent variable (TE indexes). The F-statistic which measures the worthiness of R2 shows that R2 is statistically significant, implying that the specified independent variables are jointly significant in explaining the dependent variable. The diagnostic test from Table shows that the residual estimate of the estimated model is normally distributed at 5% significant level, thus the null hypothesis of normality is accepted. The Breusch–Pagan LM and Pesaran CD test statistics reject the null hypothesis of no correlation of the disturbances at conventional significance levels.
4. Policy implications and concluding remarks
In this paper, we have been able to use VRTS-DEA model to estimate TE for 32 active upstream operators in Nigeria. The model is suitable to analyse the TP of upstream oil and gas industries due to its assumption ceteris paribus. The results obtained were used to rank the 32 active operators based on contract as follows: JVC group, 75%; MFC group, 67%; SRC group, 65%; PSC group, 64%; SC-NAOC, 42% and NOC-NPDC, 23%. Similarly, the results of the parametric analysis indicate that four of the selected independent variables are key determinants of the upstream TP in Nigeria, i.e. crude oil demand, operator’s experience, oil reserves to production ratio and gas reserves to production ratio. It appears that 1% increase in gross taxes pay by investors brings about 1.9% reductions in TE of the operator. This implies that increasing upstream taxes via government regulation reduces the operator’s efficiency and perhaps gross revenue. Taxing operators regressively increases the total cost of operations to the investors and even to the host government irrespective of the type of contract in place.
The results also indicate an important policy direction towards the optimum performance of upstream industry in Nigeria. It is recorded that JVCOs perform better than the remaining contracts despite the inability of the host government to remit its cash calls as at when due. Reports show that NNPC is currently owing an accumulated sum of over $9.125billion due to unremitted cash call balance as at September 2016, (NVBN, Citation2016). However, our findings support the cash calls exits policy by the Nigeria government and confirm that the proposed exit is not harmful to both the government and the investors. In considering the performance of the indigenous participants, we submit that the government may put in place an indigenous human resource development strategy to enable the citizens to take absolute responsibility of their resource management. Conclusively, we suggest that further research is required to identify upstream operations’ incentives’ barriers to improve Nigeria oil and gas upstream technical efficiency.
Acknowledgements
We acknowledge the Federal Ministry of Petroleum Resources (MPR) and Petroleum Technology Development Fund (PTDF) for providing financial aids towards this research work. Our appreciation also goes to the Upstream and Planning departments of DPR for making available the data used for this study.
Additional information
Funding
Notes on contributors
Idowu J. Adekunle
Idowu J. Adekunle PhD’s Dissertation centred on “Nigeria upstream petroleum Industry performance analysis using data envelopment analytic approach”. His research interests include: Petroleum Economics and Policy, Upstream Industry Efficiency and Productivity Analysis.
Iledare O. Omowumi
Iledare O. Omowumi (PhD) is the Chirota and Emmanuel Egbogah distinguished Professor and Director at the Emerald Energy Institute, University of Port Harcourt. His research interest is in international petroleum fiscal economics and geopolitics of oil-and- gas resources.
Echendu C. Joseph
Echendu C. Joseph (PhD) is a World Bank Africa Centre of Excellence Scholar. Echendu’s current interest is in petroleum/energy economics modelling, life-cycle project design and analysis, policy and strategy research, petroleum fiscal systems design, and stochastic analysis.
Achi O. Peter
Achi O. Peter is currently a researcher with Kastmide Consult Nigeria limited. He holds BSc and MSc degrees in Economics from the University of Abuja, Nigeria. Peter is presently working on performance analysis of non-energy sector using parametric analysis.
Related Research Data
References
- Baltagi, B. H., Bratberg, E., & Holmås, H. T. (2005). A panel data study of physicians’ labour supplies the case of Norway. Health Economics, 14, 1035–17. doi:10.1002/hec.991
- Banker, R. D., Charnes, A., & Cooper, W. W. (1984). Some models for estimating technical and scale inefficiencies in data envelopment analysis. Management Science, 30(9), 1078–1092. doi:10.1287/mnsc.30.9.1078
- Banker, R. D., & Natarajan, R. (2008a). Evaluating contextual variables affecting productivity using data envelopment analysis. Operations Research, 56, 48–58. doi:10.1287/opre.1070.0460
- Charnes, A., Cooper, W., & Rhodes, E. (1978). Measuring the efficiency of decision-making units. European Journal of Operational Research, 2(6), 429444. doi:10.1016/0377-2217(78)90138-8
- Echendu, J. C., & Iledare, O. O. (2015). Progressive royalty framework for oil and gas development strategy: Lessons from Nigeria. Society of Petroleum Engineers. doi:10.2118/174846-MS
- Eller, S. L., Hartley, P. R., & Medlock, K. B., III. (2010). Empirical evidence on the operational efficiency of national oil companies. EmpiricalEconomics, 40, 623–643.
- Farrell, M. J. (1957). The measurement of productive efficiency. Journal of the Royal Statistical Society. Series A (General), 120(3), 253–290. doi:10.2307/2343100
- Foroughi, A. A. (2013). A revised and generalized model with improved discrimination for finding most efficient DMUs in DEA. Applied Mathematical Modelling, 37(6), 4067–4074. doi:10.1016/j.apm.2012.09.007
- Geisser, S., & Johnson, W. M. (2006). Modes of parametric statistical inference. USA: John Wiley & Sons. ISBN 978-0-471-66726-1.
- Gujarati, D. N., & Porter, D. C. (2009). Basic econometrics (5th ed., pp. 10020). New York, NY: Published by McGraw Hill Irwin, a business unit of the McGraw-Hill Companies, Inc, 1221 Avenue of the Americas. Copyright@2009, 2003, 1988, 1978 by McGraw-Hill Companies Inc.
- Hausman, J. A. (1978, November). Specification tests in econometrics. Econometrica, 46(6), 1251–1271. doi:10.2307/1913827
- Idowu, A. J., Iledare, O. O., & Dada, B. G. (2019). Evaluating technical efficiency of firms of different sizes: A case study of Nigeria upstream players. SPE Reservoir Evaluation and Engineering Journal. doi:10.2118/194210-PA
- Ike, C. B., & Lee, H. (2014). Measurement of the efficiency and productivity of national oil companies and its determinants. Geosystem Engineering, 17(1), 1–10. doi:10.1080/12269328.2014.887045
- Kocisova, K. (2014). Application of data envelopment analysis to measure cost, revenue and profit efficiency (Vol. 94, pp. 3). Košice, Slovak Republic: Technical University of Košice, Statistika.
- Kumbhakar, S. C., & Lovell., C. A. (2003, March 10). Stochastic Frontier Analysis (pp. 333). United Kingdom: Cambridge University Press, Business & Economics. Hb ISBN (2000): 0-521-48184-8.
- Li, L., Li, M., & Wu, C. (2013a). Production efficiency evaluation of energy companies based on the improved super-efficiency data envelopment analysis considering undesirable outputs. Mathematical and Computer Modelling, 58(5), 1057–1067. doi:10.1016/j.mcm.2012.07.001
- Li, X.-G., Yang, J., & Liu, X.-J. (2013b). Analysis of Beijing’s environmental efficiency and related factors using a DEA model that considers undesirable outputs. Mathematical and Computer Modelling, 58(5), 956–960. doi:10.1016/j.mcm.2012.10.016
- Morita, H., & Avkiran, N. K. (2009). Selecting inputs and outputs in data envelopment analysis by designing statistical experiments. Journal of the Operations Research Society of Japan, 52(2), 163–173. doi:10.15807/jorsj.52.163
- Murphy, K. (2012). Machine learning: A probabilistic perspective (pp. 16). London, England: The MIT Press Cambridge. ISBN 978-0262018029.
- NVBN. (2016, September 01). Vanguard business news. FG to Earn $2bn from New Cash Policy. Retrived from: https://www.vanguardngr.com/2016/12/fg-earn-2bn-new-cash-call-policy
- Odularu, G. O. (2012). Crude oil and the Nigerian economic performance. Journal of Oil and Gas Business, 1–29.
- OPEC. (2017). Organization of petroleum exporting countries. Nigeria Facts and Figures. Nigeria: OPEC. Retrived from https://www.opec.org/opec_web/en/about_us/167.htm
- Pardo, M. (2010). Energy efficiency development in German and Colombian non-energy-intensive sectors: A non-parametric analysis. Energy Efficiency, 4(1), 115–131.
- Pardo, M. (2016). Estimating and analysing energy efficiency in German and Colombian manufacturing industries using DEA and data panel analysis. Part II: Non-energy intensive sectors. Energy Sources, Part B: Economics, Planning, and Policy, 11(1), 1–10. doi:10.1080/15567249.2010.551823
- Roman, M., & Gotiu, L. (2017). Non-parametric methods applied in the efficiency analysis of European structural funding in Romania. MPRA Paper No. 80548. Bucharest University of Economic Studies.
- Rouse, P., Putterill, M., & Ryan, D. (1997). Towards a general managerial framework for performance measurement: A comprehensive highway maintenance application. Journal of Productivity Analysis, 8(2), 127–149. doi:10.1023/A:1007743606303
- Rui, Z., Cui, K., Wang, X., Chun, J., Yuwei, L., Zhang, Z., … Patil, S. (2018). A comprehensive investigation on performance of oil and gas development in Nigeria: Technical and non-technical analyses. Energy. doi:10.1016/j.energy.2018.06.027
- Sarkis, J. (2007). Preparing your data for DEA. In J. Zhu & W. D. Cook (Eds.), Modeling Data Irregularities and Structural Complexities in Data Envelopment Analysis (pp. 305–320). Boston, MA: Springer US. Retrieved from http://link.springer.com/10.1007/978-0-387-71607-7_17.
- Sepehrdoust, H. (2011b). Housing production and determination of technical efficiency. Trends in Applied Sciences Research, 6(7), 686–699. doi:10.3923/tasr.2011.686.699
- Sepehrdoust, H., & Rajabi, E. (2011a). Regional human development index and performance of social security hospitals in Iran. African Journal of Business Management, 6(8), 3076–3081.
- Song, C., Li, M., Zhang, F., He, Y., & Tao, W. (2014). Analysis of energy efficiency for coal-red power units based on data envelopment analysis model. International Conference on Applied Energy, ICAE2014. Energy Procedia, 61(2014), 904–909. doi:10.1016/j.egypro.2014.11.992
- Tafamel, E. A., & Akrawah, O. D. (2015). Cost efficiency of the oil and gas industry in Nigeria: Data envelopment analysis. Archieves of Business Research, 3(6), 138–148.
- Toloo, M. (2012). On finding the most BCC-efficient DMU: A new integrated DEA model. Applied Mathematical Modelling, 36(11), 5515–5520. doi:10.1016/j.apm.2011.11.074
- Toloo, M., & Nalchigar, S. (2009). A new integrated DEA model for finding most BCC-efficient DMU. Applied Mathematical Modelling, 33(1), 597–604. doi:10.1016/j.apm.2008.02.001
- Wang, K., Yu, S., & Zhang, W. (2013, September). China’s regional energy and environmental efficiency: A DEA window analysis based dynamic evaluation. Mathematical and Computer Modelling, Elsevier, 58(5–6), 1117–1127. doi:10.1016/j.mcm.2011.11.067
- Wolf, C. (2009). Does ownership matter? The performance and efficiency of state oil vs private oil (1987–2006). Energy Policy, 37, 2642–2652. doi:10.1016/j.enpol.2009.02.041
- Wooldridge, J. M. (2002). Econometric analysis of cross section and panel data. Massachusetts London, England: The MIT Press Cambridge.
- Zarepisheh, M., Soleimani-Damaneh, M., & Pourkarimi, L. (2006). Determination of returns to scale by CCR formulation without chasing down alternative optimal solutions. Applied Mathematics Letters, 19(9), 964–967. doi:10.1016/j.aml.2005.09.008
- Zheng, X. B., & Park, N. K. (2016). A study on the efficiency of container terminals in Korea and china. The Asian Journal of Shipping and Logistics, 32(4), 213–220. doi:10.1016/j.ajsl.2016.12.004