
 ?Mathematical formulae have been encoded as MathML and are displayed in this HTML version using MathJax in order to improve their display. Uncheck the box to turn MathJax off. This feature requires Javascript. Click on a formula to zoom.
Abstract
The electrical energy produced by solar panel depends on the light intensity falling on the panel, but this process is prone to disturbances from external factors. Unfortunately, models of online solar panel disturbance diagnosis have not been widely developed. This research proposes a model of fog computing using fuzzy rule-based algorithm is capable of automatic monitoring and diagnosing factors affecting solar panel efficiency. Data from physical parameter of sensors are acquired by the System on Chip (SoC) Wi-Fi microcontroller and sent to the fog server via a Wi-Fi gateway. The fuzzy rule-based algorithm consists of investigation rules showing the relationships among efficiency, light intensity, output electrical power, temperature, and humidity. Output of fog network computing is sent to the cloud server and serves as information for users of this investigation system. The fog network system is able to improve cloud performance, in terms of the transmission time has increased performance from 246.1 to 27.9 ms. In general, this system is able to improve relative efficiency of solar panel by 2.1%, compared to solar panels not equipped with this instrument. In order to obtain accurate investigation results, detailed conditions of all possible events in the field are required.
PUBLIC INTEREST STATEMENT
The issue of energy needs is a major problem for all nations in the world. This is due to the increasing population growth which has an impact on industrial growth which has resulted in new energy needs increasing as well. The solution to fulfilling electricity using solar panels has a very good prospect, especially in tropical countries that have abundant sunlight. The development of sensor network systems in this study can be used as a supporting power to improve solar panel performance. This system can be developed on a large number of solar panels so that it can be used as a Supervisory Control and Data Acquisition System (SCADA) in modern solar power plants. This system is very necessary in a system that is far from residential areas to be able to always supply electrical energy continuously where it is still a problem, especially in important installations such as hospitals, livestock, fisheries, plantations, and other installations.
1. Introduction
Energy crisis is a serious problem faced by almost all countries (Bulut & Muratoglu, Citation2018). The use of fossil fuels to generate electrical energy comes with the side effect of environmental pollution (Leonzio, Citation2017). Another issue that stems from the use of non-environmentally friendly energy sources is the greenhouse effect. Therefore, efforts have been carried out to find new and renewable energy sources (Poruschi & Ambrey, Citation2019). Solar energy is one of the most abundant energy sources with great prospect of further development (Hu, Zheng, Tan, Zhu, & Miao, Citation2015). In tropical regions, solar energy can be obtained almost every day with long duration each time. Photovoltaic (PV) panel is a semiconductor instrument that can alter solar radiation energy into electrical energy (Sampaio & González, Citation2017).
The use of solar energy for electricity has the benefit of economic efficiency in terms of power transmission (Al-Waeli et al., Citation2017). Electrical energy can be provided in dwelling areas without the need for a complex power transmission infrastructure (Goop, Odenberger, & Johnsson, Citation2017). This is possible as for the power transmission system, PV panels do not require step-up transformers for short distance transmission. Moreover, the use of PV panel also supports the green technology campaign. Unlike fossil fuel for power generation, PV panel technology does not produce toxic exhaust gases that cause pollution and endanger people’s health (Xu, Li, Tan, Peters, & Yang, Citation2018). The process of energy conversion from solar power to electricity itself is photonic that results in no greenhouse gases are released (Ngoc et al., Citation2017). One disadvantage of PV panel electricity power generation system is the high initial capital. The price of solar panels is categorically still very expensive. This is due to the fact that they are made of silicon which requires high technology and large investment for its purification (Corcelli et al., Citation2018). Therefore, there needs to be improvement in the efficiency of solar panel use in order to produce electrical energy continuously. Energy management by designing scenario on sources of energy generation can improve the efficiency (Imteaz & Ahsan, Citation2018).
Improvement of solar panel efficiency has been made in terms of material and panel condition in the field. In Australia, electrical energy production from solar panels is affected by environmental conditions and there is a difference in energy productivity between winter and summer (Merino et al., Citation2018; Vega, Amaya, Santamaría, & Rivas, Citation2018). Monitoring for PV panel disturbance is generally carried out by comparing PV input (light intensity) against the power produced (Sueyoshi & Wang, Citation2017). Nonetheless, there are many factors affecting the efficiency of PV panel. Dust is one of the substances that can block sunlight from properly fall onto the panel. The other things that may prevent this sunlight exposure to PV panel are snow, leaves, rainwater, and the likes. Disturbance caused by dust can be mechanically handled using a brush-disk (Chen, Ma, Yue, Guo, & Liang, Citation2018) and the electrostatic method, so that solar panel efficiency is restored (Kawamoto & Guo, Citation2018). A proper solution for disturbance of PV panel in the field can definitely be beneficial for its high productivity.
Physically, diagnosis for solar panel disturbance is carried out by comparing conditions of illumination against the electrical power a solar panel produces. Direct field measurement on light intensity and electrical power produced by a solar panel can easily provide simple investigation results (Andrews, Pollard, & Pearce, Citation2013; Mani & Pillai, Citation2010). However, this direct method is disadvantageous in terms of efficiency and speed as a solution for PV panel maintenance. Therefore, the use of information technology in electronically monitoring solar panels can be of high economic value. Performance of solar panels can be monitored from the electrical energy they produce. Daily energy monitoring for a period of 3 years reveals lower efficiency of the solar panel (Mallor et al., Citation2017). The important variables in monitoring PV panel are light intensity and temperature. These two units can be acquired in the field using special sensor chips that are integrated in a microcontroller that will allow further analyses in order to figure the condition of solar panels (Corte et al., Citation2016).
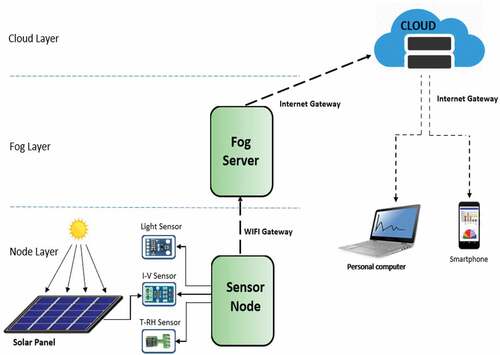
This research proposes a PV panel investigation system using wireless sensor system with fog network model. This model is capable of performing local computing, so that it eases burden in the cloud network. It also provides speedy information with higher network efficiency (Sun, Lin, & Zhang, Citation2018). It comprises sensors of temperature, humidity, light intensity, and electrical power. The System on Chip (SoC) Wi-Fi microcontroller, which is a combination of microcontroller for data acquisition and Wi-Fi radio for data communication, is used in this system. The use of this system is very effective because of its small size and low cost production (Maxim & Zidek, Citation2012). The model proposed here is expected to tackle spatial issues associated with PV panels as they are located in wide areas. This system is integrated in a fog server data base as to allow continuous data history storage. Online data acquisition system is very effective as no weather issues are of concern and it can work in real-time as well (Jun, Sun-Zheng, & Jing-Li, Citation2009). The use of artificial intelligence in diagnosing PV panels is based on a dedicated input sensor used for speedy maintenance in order to ensure productivity and uninterrupted electrical energy supply.
2. Related work
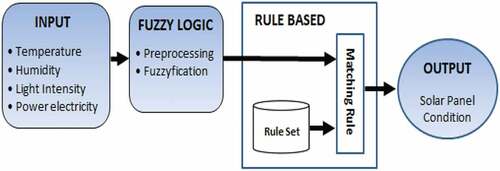
The era of innovation disruption brings about digital revolution that results in interconnected digital devices that make up complex networks (Wu, Rosen, Wang, & Schaefer, Citation2015). The impact of these is growing demand for both digital hardware and software capable for data analysis, system diagnosis, and industrial activity prediction. The whole industry has since set off from being offline into cyber systems that perform processes online and in real-time (Wang, Törngren, & Onori, Citation2015). This situation requires fog-based computing to solve issues at the local level as to support the cloud-based computing system. An architecture of fog network that connects sensors to a cloud server is shown in Figure .
Figure 1. Architecture of a fog network connecting node sensors to a cloud server
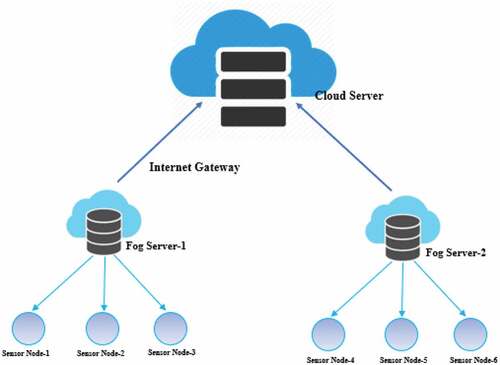
Fog networking is physically capable of connecting sensors on the ground level attached to objects to the cloud. This type of network reduces latency as it transfers computation from the cloud to the local network. It is also able to access more local parameters that allows more data computation and analysis to be carried out in real-time. This network is suitable for diagnostic models of numerous parameters as it will solve the issue of busy networks. The use of local gateway in local data storage network within the fog network makes it even more safe and economical (Kambatla, Kollias, Kumar, & Grama, Citation2014).
Integration of sensors to the fog network that is connected to the cloud has successfully been developed and this in turn, has been integrated to machine learning capable of producing diagnostic instruments in many industries. This kind of system has proven to be able to collect data from all sorts of parameters into one local server and analyze them accordingly in real-time (Zhang, Alrawais, Jiang, & Chen, Citation2015). In order to produce information, a system is constructed at the local server to compute and learn the object(s) being investigated. Fog computing is part of the calculation process in that local server that is aimed at generating values that serve as information for certain purposes. Diagnosis and prediction are two examples of fog computing output (Wu et al., Citation2017).
The Internet of Thing (IoT) has proven to provide effective service as it eliminates spatial and temporal issues. The main components of IoT include a network of sensors that are in direct contact with objects, a gateway to send sensor data, and a cloud to record, store, and process those data (Alrawais, Alhothaily, Mei, Song, & Cheng, Citation2018). This paper proposes a diagnosis method using IoT components of
A sensor system to acquire data from parameters related to condition and productivity of solar panels.
A data communication model using Wi-Fi gateway that connects solar panels to a local gateway server which represents fog networking for optimized system diagnosis.
A fog computing system in the local network to perform diagnosis of solar panels and connects data to the cloud, so that Internet network in the cloud is not overloaded, that may otherwise cause failure in information generation.
In the fuzzy system, sensor data from certain measurements are physical values that can be categorized linguistically, in terms of membership (Liu & Zhang, Citation2018). The function of fuzzy logic membership from sensors in the solar panels is to calculate degree of membership in a fuzzy group. Each linguistic term is associated with a fuzzy set that has specifically defined membership function. In turn, membership function from sensor reading shows mapping of data input points for membership values. Within this fog computing system, each sensor is taken as a definite number of 0 or 1, but in the interval instead [0,1]. Mathematical definition of membership A in the universal number U is written as
Membership function of fuzzy number from the sensor in the solar panels, among others, can be stated in the following equations:
Ascending linear curve:
Descending linear curve:
Triangular function (combination of ascending and descending linear curves):
If sensor values are a combination of membership numbers A and B, then this combination is stated as:
An example of fuzzy membership number function from readings of solar panel temperature sensors is shown in Figure . Each membership does not have a definite value, but it comes with a membership degree [0,1] (Zhou, Li, Shi, Lu, & Cheng, Citation2018).
Figure 2. Fuzzy membership function according to sensor readings
Values of sensor output can be transformed into fuzzy membership function and classified as required. Classification using fuzzy method puts data into certain classes based on probability level of each datum. Classification output is represented in a fuzzy set that depends on the value of x:
where is ck element of fuzzy set y(X) of membership
(x).
In the fuzzy rule-based system, output data from fuzzy classification has to undergo rule-based operation. It is known in mathematics as the p set rule (Gorzalczany & Rudzinski, Citation2016):
A combination of rules r (m1, m2 … mn) can be written as
3. Method
3.1. The fog network system developed
The system built in this research is a wireless sensor system consisting of a Remote Terminal Unit (RTU) attached on a PV panel. The RTU itself contains sensors used and a Wi-Fi microcontroller to communicate the data acquired. The other part is the Control Terminal Unit (CTU) consisting of a Wi-Fi receiver and a computer. Diagram for RTU and CTU communication system is shown in Figure . The SoC Wi-Fi microcontroller used in the RTU has short communication range between 30–100 m in open space. In order to send data from each node, a Wi-Fi gateway is required to function as a data multiplexer from each node.
Figure 3. Diagram of a fog network communication system
The Wi-Fi gateway attached on the RTU is capable of connecting up to 256 nodes and sends data over tens of kilometers. The gateway of this system works at 2.4 GHz IEEE 802.11b/g frequency with data transmission speed of up to 54 Mbps. Wi-Fi microcontroller ESP8266 functions as the sensor for data acquisition system and as the data interface to the computer via Wi-Fi network. Each Wi-Fi microcontroller on the node is set at 11,680 BPS speeds and at different IP Addresses of the same class. This arrangement is carried out with chip programming on the computer using C language, which is then uploaded on ESP8266 chips.
3.2. Solar panel sensor data acquisition system
Solar panel is a device of high value as it is capable of turning solar energy, which is abundant in nature, into electrical energy that can be stored and used for daily energy needs. The electrical energy produced by PV panels is DC electricity, the power of which is comparable to the light intensity gained by the PV panels. The most important part of a PV panel is the semiconductor material that undergoes photoelectric effect upon being hit by photons from solar radiation. Nowadays, the semiconductor material found in PV panels is made from silicon that can either be monocrystalline, polycrystalline, or amorphous (Mirzaei & Mohiabadi, Citation2017).
A diagram showing the sensor communication system circuit with the SoC Wi-Fi microcontroller ESP8266 is shown in Figure . Ideally, the amount of solar radiation that is turned into PV panel power output can be measured with a circuit of ampere and volt meters. However, it not possible for all of the solar radiation to be turned into electrical energy. PV panel efficiency value (η) is calculated using the following formula:
Figure 4. Diagram of sensor communication system circuit with SoC Wi-Fi microcontroller ESP8266
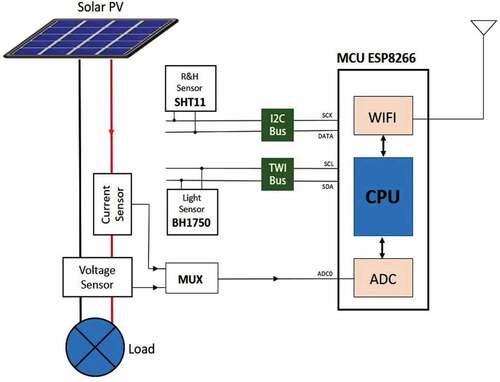
In this equation, Pmax is the electrical power output, which is a multiplication of current and output voltage, E is the solar radiation input, and A is the PV panel area. The unit for electrical power Pmax is in watt, while the solar radiation input is in W/m2, which in lux is equal to 1 W/cm2 = 6.83 × 10⁶ lx (Ryer, Citation1998).
Smart sensor technology for physical environment detection has speedily developed with its integration into microprocessors and microcontrollers for data processing prior to being made into input for devices. A system for PV panel monitoring requires sensors of temperature, humidity, light intensity, current, and voltage. Specifications of the sensors used in this system are shown in Table .
Table 1. Sensor specification for solar panel monitoring
The sensor used in this system consists of two smart sensors (SHT11 and BH1750), an analog sensor (AC172), and a PV Panel voltage sensor, made of two resistors, as voltage divider. SHT11 is a smart sensor for temperature and humidity that uses the two wire interface (TWI) protocol to read both units. BH1750 sensor is a light intensity sensor. It takes an Inter Integrated Circuit-protocol (I2C) to read this sensor. ACS172 is a current sensor and has output of analog signals. Hence, an Analog-to-Digital Converter (ADC) is required to read the current passing through this sensor.
The voltage sensor is built from voltage dividing sensors, and as in the current sensor, an ADC is needed to read its output. In the Wi-Fi-microcontroller ESP8266, there is 1 ADC channel ADC, while the system actually requires two ADCs. Hence, a multiplexer is constructed using a relay to acquire both current and voltage form the solar panel. A microcontroller is needed to read both the smart sensors and the analog sensors. This research employs the SoC Wi-Fi microcontroller ESP8266 that can be programmed to generate TWI and I2C protocols and turn analog signals into digital signals via the ADC input on the chip.
3.3. Fuzzy rule-based system
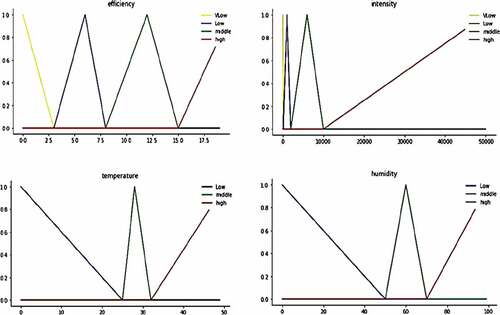
Computation process in a fog server consists of fuzzification of sensor input and rule development on the solar panel to state a disturbance. Fuzzification is performed against data of illuminance, efficiency, temperature, and humidity. The four variables are then categorized into membership functions of very low, low, medium, and high. The span classification is based on real conditions in the field. That means clustering tailored to the needs oriented to the system’s ability to distinguishing the disturbance conditions in the field. For example, the develop of a range of light intensity conditions in solar panels has been divided into four levels namely very low, low, medium, and high. The range of values of very low and low is very different, very low is on range I < 100 lx, while the low is at 100 ≤ I ≤ 2000 lx. The value of the intensity range is based on experimental circumstances that aim to distinguish between the night (I < 100 lx), and overcast (100 ≤ I ≤ 2000 lx). Graphs of fuzzy logic membership function are shown in Figure .
Figure 5. Graph of fuzzy logic membership function of sensor readings on solar panels
Output of fuzzy logic system computation is then used as input of the rule-based system developed to determine disturbance on solar panels. Rule-based system is one example of artificial intelligent with the principle of knowledge manipulation to gather more useful information. The rule-based system in this solar panel diagnosis can automatically run inferences that determines conditions swiftly and then stores it in the data base. Data history is kept for decision support system in optimizing output power of PV panels. Rule-based system employs rules set by people and automatically executed by the computer. This system is suitable for noncomplex regulation systems, with more accurate and speedy results (Gegov, Petrov, Sanders, & Vatchova, Citation2017).
Rules set in the rule-based system for solar panel is based on input facts from sensor data base to execute an action. These rules make use of AND or OR logics to connect facts. Architecture of the rule-based system for solar panel diagnosis is shown in Figure . Condition represents premises or facts, and conclusion represents actions for those premises or facts. Condition can either a premise or a group of premises connected to AND and OR logical operators. Meanwhile, conclusion can be an action taken or a conclusion based on a shown premise.
Figure 6. Architecture of the rule-based system for solar panel diagnosis
Rule is a general knowledge of application domain. It maintains originality, modularity, and ease in explanation as it is used as it is, as if it were stated by an expert. The drawback of this rule is that it is not easy to gain a complete and perfect set of knowledge on a complex domain, as there may not be any expert who can reveal his/her knowledge or there may not be enough experts on the domain concerned. Diagram of rule-based system flow is shown in Figure .
Figure 7. Diagram of rule-based system flow
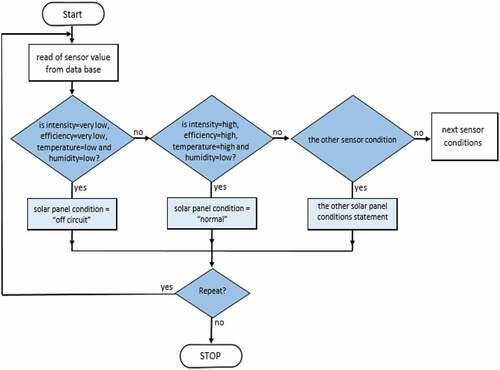
The programming script for this rule-based system is written with the CTU computer that stores the data base of solar panel sensors in the field. The program is written independently as is not connected to the data acquisition system and sensor data recording to the data base, as to prevent data traffic congestion during execution. Procedure for rule-based system programming starts with sensor data loading from the data base, which is then matched with the rule conditions set. Each input condition probability will result in a matching statement. Diagnosis of all solar panels includes conditions of intensity, efficiency, temperature and humidity. Proportion is classified by experiment and are categorized into very low, low, medium, high, and very high. If a sensor condition does not come with a rule, then the loop in considered closed, and the condition recorded in the computer is taken as the same to the prior condition and then the last data base is taken. The input is called promise, which is the initial condition of rule based. Through computer programming that has been built, the output of diagnostic results called conclusion has been obtained. In computer programming, both are often expressed in commands: IF … THEN … . An example of such programming is
IF (illuminance = ’High’) and (efficiency = ’High’)
AND
temperature = ’High’) and (humidity = ’Low’)
THEN
begin
conclusion: = ’Normal’
END
4. Result and discussion
An instrument for PV panel online and real-time monitoring and investigation using the rule-based artificial intelligent system has been successfully realized with multi-node wireless sensor configuration. In this research, discussion for one of the nodes of the data base from one PV panel is taken as a sample in the CTU computer. The main input parameters of the rule-based system is efficiency (η), which is calculated from output electrical power reading (P) from the PV panel compared to light intensity (I) that falls upon the PV panel. This system also takes temperature (T) and humidity (H) as additional parameters. The rule-based system for PV panel diagnosis is a set of rules of cause and effect from each input parameter from sensor readings. Hence, testing for the sensor built is important in order to produce an accurate monitoring and investigation system. Sensor calibration is carried out by comparing readings in the CTU database to those from standard instrument readings in the RTU. Results of testing for each sensor are shown in Figure .
Figure 8. Architecture of the rule-based system for solar panel diagnosis
Results of sensor calibration show linear relationships between the sensor being tested and the standard measurement instrument used as comparison (calibrator). Error values are used to quantify differences in values between tested and standard sensors. The less the error value, the more accurate the sensor system developed is. Calibration results of the sensor system developed are shown in Table .
Table 2. Calibration results of the sensor system developed
Results of sensor testing show small error values of less than 1.05% of percentage error. This means that the sensor system developed is capable of monitoring and investigation of PV panel efficiency in the field. In order to analyze input data against electric power output of the PV panel, graphs are used and shown on the computer monitor. Other than showing sensor readings, the graphs also show values of PV panel efficiency calculated using Equationequation (1)(1)
(1) . In this calculation, input of light intensity is turned into units of W/cm2 before being compared to the electric power output of the PV panel.
Results of sensor testing show small error values of less than 1.05% of percentage error. This means that the sensor system developed is capable of monitoring and investigating PV panel efficiency in the field. In order to analyze input data against electric power output of the PV panel, graphs are used and shown on the computer monitor. Other than showing sensor readings, the graphs also show values of PV panel efficiency calculated using Equationequation (1)(1)
(1) . In this calculation, input of light intensity is turned into units of W/cm2 before being compared to the electric power output of the PV panel.
Empirically, investigation for OV panel can be carried out by figuring out efficiency values compared to light intensity. However, this method is not capable of diagnosing the cause of efficiency reduction. Literature studies reveal that efficiency is reduced by sun radiation itself, dust, dirt, rain, snow, and the likes. In tropical regions, diagnosis is based on the most common causes: dust, dirt, and rain. Data on these impurities serve as foundation for the rule-based system for PV panel investigation. Graphs showing variation of PV panel conditions due to external disturbances in tropical areas are shown in Figure .
Figure 9. Graphs of various photovoltaic panel conditions due to external disturbances commonly found tropical areas, photovoltaic panel in normal condition
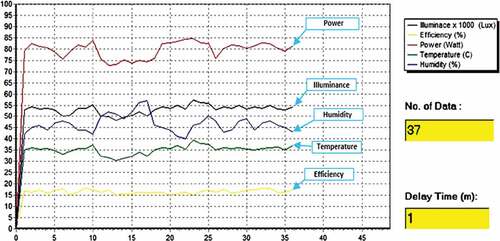
Figure is a graph showing PV panel in normal condition in which it has the highest efficiency as the sensor reads high light intensity. This means that no significant disturbance is experienced by the panel and it has 18.20% efficiency. The PV panel condition at night when it experiences the lowest efficiency as light intensity is almost none (≅0), accompanied with low temperature and high humidity. The PV panel is of low efficiency despite high light intensity, high temperature, and low humidity. This condition differs from the condition at night in that reading for light intensity is high. This means that there is disturbance caused by external natural factors commonly found in literature studies. Analyses of data in the field reveal that this disturbance is caused by falling leaves on the PV panel. The effect of disturbance by leaves and dust in this research is found to slightly differ, with the leaves resulting in the lowest efficiency. Meanwhile, reduction in efficiency due to dust does not reach the extreme low value. If one sensor condition is not found in one of the rules, then sensor reading is conducted again and the status of PV panel condition is taken as the same at it was earlier.
In this system, the fuzzy rule-based algorithm has been built separately with the main program on the server. Rereading was set at 5-min intervals and can be customized a required. Data that has been read by the program from the server are displayed on the “sensor input” section; then, the data are clustered according to the rule and the results are displayed on the “linguistic input” section. Table shows examples of fuzzification testing results based on degree of membership between 0 and 1. This value range is then used to determine sensor condition in linguistic terms.
Table 3. Results of sensor fuzzification
Output of linguistic status changes at membership borders (Dange & Lad, Citation2017). The table shows borders of changes in output values from fuzzification process and also shows that they vary in line with the fuzzy set developed (Sánchez & Causo, Citation2018). In agreement with the discussion of this paper, the method of solar panel diagnosis that is developed based on of fuzzy rule-based system performs fuzzification of output data using the rule-based algorithm execution of rule-based system. It has been displayed in the “condition statement” as a conclusion statement that indicates the condition of the solar panel.
Table serves as justification for testing of the rule-based system developed, which is used to diagnose PV panel. It can be seen in the table that almost all parts of the rule are TRUE. However, there are times when the rule-based system conducts processes that do not fit conditions in the field, for example, in a condition of high light intensity, but with low temperature and humidity. In this condition, the electric power produced by a PV panel is low, that is the system understands the condition as night. This may happen as the rule-based system in the computer does not state specific conditions that may tell differences between two similar conditions (Chang, Pongsanone, & Ernest, Citation2012). In this case, the addition of sensors to obtain parameters that can help differentiate two similar conditions seems to be a good solution. The addition of specific sensors can explain facts in the field in more detail that the rule-based system is capable of representing a wider range of conditions (Albert, Gors, & Schilling, Citation2015).
Table 4. Rules on the computer used to determine the solar panel condition based on the sensor input
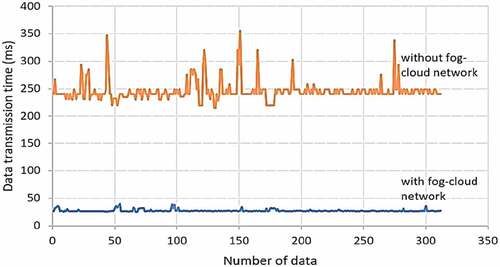
This research has tested different effectiveness between a cloud network supported by fog network and that a cloud network only. The important parameters proposed for performance test for both models are data transmission time/network communication delay. The test was carried out for 14 days with a measurement interval of 1 h. The results of testing these parameters is shown in Figure . Then the measurement results are averaged to get the difference values from the drivers using the fog–cloud network model. In general, the data transmission time has changed at any time. This relates to cellular activities that use broadband Internet network (Mao, Hu, & Kumar, Citation2018). During the day, transmission quality is reduced and this time of day shows lower transmission time. This means that the use of fog networking plays a crucial part in the utilization of cloud network. It can be seen in Figure that network performance increases with the use of fog–cloud networking, compared to only using cloud networking alone. The fog–cloud networking has been able to improve data transmission time from 246.1 to 27.9 ms.
Figure 10. Graph of the results of testing the data transmission time parameters for performance using fog
This research has successfully investigated the performance of fuzzy rule-base fog–cloud computing for real-time solar panel disturbance investigation. Testing of solar panel productivity with the use and nonuse of investigated instrument has been carried out. Testing data were taken from the server in everyday for a period of 1 months. These represent average efficiency value of each solar panel. Results of sensor readings for solar panel efficiency are shown in Figure . The graph shows that efficiency of both solar panels lowers after a few days of measurement. The solar panel that is equipped with the fog–cloud network immediately provides a notification so that it returns to normal after several notifications and hence, corrective steps.
Figure 11. Graph of results of sensor readings for solar panel efficiency
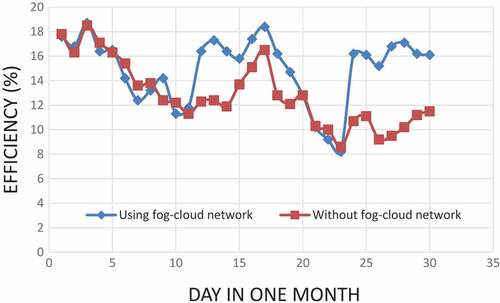
In normal conditions, the solar panels in this research have average efficiency of 17.2%, while when dust is present, their efficiency drop to 7.6%. Early notification system can therefore restore a 9.6% efficiency gain in that sort of event. When disruptions from leaves are detected, solar panel efficiency may drop to as low as 1.6%. From the results of this study, an average efficiency increase of 14.9% has been obtained, while without using the fog–cloud network, the efficiency is obtained by an average of 12.8%. Hence, the diagnosis system developed here is capable of improving efficiency by up to 2.1% when such a disruption takes place. Sustainability of electricity supply is vital for either industry or emergency installations such as hospitals, farms, and fisheries. The server computer calculates average solar panel efficiency for conditions of either no disturbance or when disruptions due to rain, leaves, and dust take place.
There two main advantages of this research in improving solar panel performance: efficiency and sustainability (Zhang, Wang, Li, Zhang, & Wang, Citation2016). The use of artificial intelligence both online and in real-time allows for speedy diagnosis that solar panels can readily be conditioned to optimum efficiency. It also guarantees adequate electric energy supply from solar panels as based on environmental condition. The wireless sensor technology here helps solar panel technicians by relieving them from the arduous work of going to the field with measuring instruments to check solar panel conditions and manually draw conclusion from the data found. This system relies on the essence of artificial intelligent in which notification can directly informed by computers. A speedy notification of solar panel condition has economic repercussions as it concerns with the sustainability of electricity supply.
5. Conclusion
The online fuzzy rule-based system using SoC Wi-Fi microcontroller has proven to be effective in monitoring the efficiency and diagnosing the condition of PV panel with the help of sensors for physical parameters input and electrical power output on solar panels. In general, the conditions resulting from diagnosis are based on the correlation of light intensity, temperature, and humidity parameters with electric power output of PV panel. The system developed here is capable of continuously monitoring PV panel efficiency and disturbances found in the field. Rules are set based on conditions in the field from observations and supported by data taken by sensors that are stored in the data base of the RTU computer. There are discrepancies in the result of rule-based truth table test. This shows that there are some undefined rule-based values in the computer system developed. This means that in order to build a rule-based system, detailed conditions of all possibilities in the field are required. Additional sensors may be needed to perfect results of PV panel diagnosis against abnormalities. The purpose of this research has been achieved by referring to the improvement of solar panel efficiency from the maintenance side. The use of online rule-based diagnostic system can speed up the handling of interference so that the total efficiency and continuity of electricity production in solar panels can be improved.
Acknowledgements
We would like to thank for Dean of Faculty of Science and Mathematics, Diponegoro University, Semarang, Indonesia, for the financial support with PNBP Research Project 2017.
Additional information
Funding
Notes on contributors
Suryono Suryono
Suryono Suryono is registered as a senior lecturer and researcher in Department of Physics, Science, and Mathematics Faculty of Diponegoro University, Semarang, Indonesia since 1998. He holds a bachelor’s degree in science (S.Si) from Diponegoro University Indonesia in 1998 and a master’s degree in science (M.Si) from Bandung Institute of Technology in 2003. A PhD degree is achieved in the field of ultrasonic sensor applications for the measurement of solid materials using tomographic models at Gadjah Mada University in 2011. He has developed an industrial information system research center with research area in the developing sensors for food security, health, and renewable energy. Research in the field of new energy is focused on solar panels which have very good prospects, especially in tropical countries like Indonesia. This is considered to be very important because energy issues are a major problem in all countries.
Related Research Data
References
- Albert, M., Gors, M., & Schilling, K. (2015). Telemedical applications with rule based decision – and information-systems (TARDIS). IFAC-Papers Online, 48-10, 007–19. doi:10.1016/j.ifacol.2015.08.099
- Alrawais, A., Alhothaily, A., Mei, B., Song, T., & Cheng, X. (2018). An Efficient revocation scheme for vehicular ad-hoc networks. Procedia Computer Science, 129(3), 12–318. doi:10.1016/j.procs.2018.03.081
- Al-Waeli, A. H. A., El-Din, M. M. K., Al-Kabi, A. H. K., Al-Mamari, A., Kazem, H. A., & Chaichan, M. T. (2017). Optimum design and evaluation of solar water pumping system for rural areas. International Journal of Renewable Energy Research, 7, 12–20.
- Andrews, R. W., Pollard, A., & Pearce, J. M. (2013). The effects of snowfall on solar photovoltaic performance. Solar Energy, 92, 84–97.
- Bulut, U., & Muratoglu, G. (2018). Renewable energy in Turkey: Great potential, low but increasing utilization, and an empirical analysis on renewable energy-growth nexus. Energy Policy, 123, 240–250. doi:10.1016/j.enpol.2018.08.057
- Chang, N., Pongsanone, N. P., & Ernest, A. (2012). A rule-based decision support system for sensor deployment in small drinking water networks. Journal of Cleaner Production, 29(28–37), 2012.
- Chen, E. Y., Ma, L., Yue, Y., Guo, B., & Liang, H. (2018). Measurement of dust sweeping force for cleaning solar panels. Solar Energy Materials and Solar Cells, 179, 247–253. doi:10.1016/j.solmat.2017.12.009
- Corcelli, F., Ripa, M., Leccisi, E., Cigolotti, V., Fiandra, V., Graditi, G., … Ulgiati, S. (2018). Sustainable urban electricity supply chain – indicators of material recovery and energy savings from crystalline silicon photovoltaic panels end-of-life. Ecological Indicators, 94, 37–51. doi:10.1016/j.ecolind.2016.03.028
- Corte, F. G. D., Cocorullo, G., Corsonello, P., Felini, C., Merenda, M., Perri, S., … Verdilio, D. (2016). A microchip integrated sensor for the monitoring of high concentration photo-voltaic solar modules. Procedia Engineering: 30th Eurosensors Conference 2016, 168, 1601–1604. doi:10.1016/j.proeng.2016.11.470
- Dange, P. S., & Lad, K. R. (2017). A fuzzy rule based system for an environmental acceptability of sewage treatment plant. KSCE Journal of Civil Engineering, 21, 2590–2595. doi:10.1007/s12205-017-1504-y
- Gegov, A., Petrov, N., Sanders, D., & Vatchova, B. (2017). Boolean matrix equations for node identification in fuzzy rule based networks. International Journal of Knowledge-Based and Intelligent Engineering Systems, 21, 69–83. doi:10.3233/KES-170353
- Goop, J., Odenberger, M., & Johnsson, F. (2017). The effect of high levels of solar generation on congestion in the European electricity transmission grid. Applied Energy, 205, 1128–1140. doi:10.1016/j.apenergy.2017.08.143
- Gorzalczany, M., & Rudzinski, F. (2016). A multi-objective genetic optimization for fast, fuzzy rule-based credit classification with balanced accuracy and interpretability. Applied Soft Computing, 40, 206–220. doi:10.1016/j.asoc.2015.11.037
- Hu, T., Zheng, M., Tan, J., Zhu, L., & Miao, W. (2015). Intelligent photovoltaic monitoring based on solar irradiance big data and wireless sensor networks. Ad Hoc Networks, 35, 127–136. doi:10.1016/j.adhoc.2015.07.004
- Imteaz, M. A., & Ahsan, A. (2018). Solar panels: Real effciencies, potential productions and payback periods for major Australian cities. Sustainable Energy Technologies and Assessments, 25, 119–125. doi:10.1016/j.seta.2017.12.007
- Jun, C., Sun-Zheng, Y. U., & Jing-Li, L. (2009). The design of a wireless data acquisition and transmission system. Journal of Networks, 4, 1042–1049.
- Kambatla, K., Kollias, G., Kumar, V., & Grama, A. (2014). Trends in big data analytics. Juornal of Parallel and Distributed Computing, 74, 2561–2573. doi:10.1016/j.jpdc.2014.01.003
- Kawamoto, H., & Guo, B. (2018). Improvement of an electrostatic cleaning system for removal of dust from solar panels. Journal of Electrostatics, 91, 28–33. doi:10.1016/j.elstat.2017.12.002
- Leonzio, G. (2017). Solar systems integrated with absorption heat pumps and thermal energy storages: State of art. Renewable and Sustainable Energy Reviews, 70, 492–505. doi:10.1016/j.rser.2016.11.117
- Liu, H., & Zhang, L. (2018). Fuzzy rule-based systems for recognition-intensive classification in granular computing context. Granular Computing, 3, 355–365. doi:10.1007/s41066-018-0076-7
- Mallor, F., León, T., Boeck, L. D., Gulck, S. V., Meulders, M., & Meerssche, B. V. (2017). A method for detecting malfunctions in PV solar panels based on electricity production monitoring. Solar Energy, 153, 51–63. doi:10.1016/j.solener.2017.05.014
- Mani, M., & Pillai, R. (2010). Impact of dust on solar photovoltaic (PV) performance: Research status, challenges and recommendations. Renewable and Sustainable Energy Reviews, 14, 3124–3131. doi:10.1016/j.rser.2010.07.065
- Mao, Q., Hu, F., & Kumar, S. (2018). Simulation methodology and performance analysis of network coding based transport protocol in wireless big data networks. Simulation Modeling Practice and Theory, 84, 38–49. doi:10.1016/j.simpat.2018.01.005
- Maxim, V., & Zidek, K. (2012). Design of high performance multimedia control system for UAV/UGV based on SoC/FPGA Core. Procedia Engineering, 48, 402–408. doi:10.1016/j.proeng.2012.09.532
- Merino, S., Sánchez, F. J., Sidrach, C. M., Guzmán, F., Guzmán, R., Martínez, J., & Sotorrío, P. J. (2018). Optimization of energy distribution in solar panel array configurations by graphs and Minkowski’s paths. Applied Mathematics and Computation, 319, 48–58. doi:10.1016/j.amc.2017.01.044
- Mirzaei, M., & Mohiabadi, M. Z. (2017). A comparative analysis of long-term field test of monocrystalline and polycrystalline PV power generation in semi-arid climate conditions. Energy for Sustainable Development, 38, 93–101. doi:10.1016/j.esd.2017.01.002
- Ngoc, T. N., Phung, Q. N., Tung, L. N., Sanseverino, E. R., Romano, P., & Viola, F. (2017). Increasing efficiency of photovoltaic systems under non-homogeneous solar irradiation using improved dynamic programming methods. Solar Energy, 150, 325–334. doi:10.1016/j.solener.2017.04.057
- Poruschi, L., & Ambrey, C. L. (2019). Energy justice, the built environment, and solar photovoltaic (PV) energy transitions in urban Australia: A dynamic panel data analysis. Energy Research & Social Science, 48, 22–32. doi:10.1016/j.erss.2018.09.008
- Ryer, A. (1998). Light measurement handbook, Newburyport: International Light .
- Sampaio, P. G. V., & González, M. O. A. (2017). Photovoltaic solar energy: Conceptual framework. Renewable Sustainable Energy Reviews, 74, 590–601. doi:10.1016/j.rser.2017.02.081
- Sánchez, L., & Causo, I. (2018). A framework for learning fuzzy rule-based models with epistemic set-valued data and generalized loss functions. International Journal of Approximate Reasoning, 92, 321–339. doi:10.1016/j.ijar.2017.10.008
- Sueyoshi, T., & Wang, D. (2017). Measuring scale efficiency and returns to scale on large commercial rooftop photovoltaic systems in California. Energy Economics, 65, 389–398. doi:10.1016/j.eneco.2017.04.019
- Sun, Y., Lin, F., & Zhang, N. (2018). A security mechanism based on evolutionary game in fog computing. Saudi Journal of Biological Sciences, 25, 237–241. doi:10.1016/j.sjbs.2017.09.010
- Vega, A., Amaya, D., Santamaría, F., & Rivas, E. (2018). Energy resource management integrating generation, load control and change in consumption habits at the residential level. International Journal of Renewable Energy Research, 8, 12–20.
- Wang, L., Törngren, M., & Onori, M. (2015). Current status and advancement of cyber-physical systems in manufacturing. Journal of Manufacturing System, 37, 517–527. doi:10.1016/j.jmsy.2015.04.008
- Wu, D., Liu, S., Zhang, L., Terpenny, J., Gao, R. X., Kurfess, T., & Guzzo, J. A. (2017). A fog computing-based framework for process monitoring and prognosis in cyber-manufacturing. Journal of Manufacturing Systems, 43, 25–34. doi:10.1016/j.jmsy.2017.02.011
- Wu, D., Rosen, D. W., Wang, L., & Schaefer, D. (2015). Cloud-based design and manufacturing: A new paradigm in digital manufacturing and design innovation. Computer-Aided Design, 59, 1–14. doi:10.1016/j.cad.2014.07.006
- Xu, Y., Li, J., Tan, Q., Peters, A. L., & Yang, C. (2018). Global status of recycling waste solar panels: A review. Waste Management, 75, 450–458. doi:10.1016/j.wasman.2018.01.036
- Zhang, S., Wang, T., Li, C., Zhang, J., & Wang, Y. (2016). Maximum power point tracking control of solar power generation systems based on type-2 fuzzy logic. Proceedings of 2016 12th World Congress on Intelligent Control and Automation (WCICA), Guilin (pp. 770–774).
- Zhang, Z., Alrawais, G., Jiang, Z., & Chen, Y. (2015). A cloud-based framework for lean maintenance, repair, and overhaul of complex equipment. Journal of Manufacture Science Engineering, 137, 040908–040918. doi:10.1115/1.4030619
- Zhou, Y., Li, H., Shi, C., Lu, N., & Cheng, N. (2018). A fuzzy-rule based data delivery scheme in VANETs with intelligent speed prediction and relay selection. Wireless Communications and Mobile Computing, 2018, 1–15.