
 ?Mathematical formulae have been encoded as MathML and are displayed in this HTML version using MathJax in order to improve their display. Uncheck the box to turn MathJax off. This feature requires Javascript. Click on a formula to zoom.
Abstract
In recent years there has been a growing interest in offshore wind energy thanks to the various advantages it offers. The offshore wind energy is used for the production of electric energy above all in the shallow waters but different research activities and large-scale demonstrations are also under way for the deep waters with scientific and technological advances that open possibilities also for new markets such as the Mediterranean Sea. In this context, the present paper aims to estimate the large-scale offshore wind production of the Mediterranean Sea. The methodology uses an open GIS platform and considers bathymetric data, annual average wind speed data, environmental data, turbines technical characteristics and administrative information. Three depth categories have been considered. The overlap between depth categories and annual average wind speeds ranges has allowed to determine the areas potentially suitable for wind farms allocation. On the basis of optimal wind farm layouts and of the characteristic of the type of turbines considered, the theoretical maximum annual offshore wind production has been estimated for whole Mediterranean area and it is about 742 TWh/year. Moreover, for each depth category, the theoretical annual wind offshore production for each Mediterranean country has been estimated.
Public Interest Statement
This paper deals with the estimation of large-scale offshore wind energy production in the Mediterranean Sea. The evaluation methodology is based on an open GIS platform and uses bathymetric data, annual average wind speed data, environmental data, turbines technical characteristics and administrative information. The estimation of the theoretical maximum annual offshore wind energy production capacity has been carried out considering three depth categories, three turbines models and different types of foundations and platforms. The overlap between depth categories and annual average wind speeds ranges has allowed to determine the areas suitable for offshore wind energy. For each of these areas, based on optimal wind farm layouts, the theoretical maximum number of turbines that can be installed has been determined, and based on the type of turbines chosen, the theoretical maximum annual offshore wind production for the whole Mediterranean area has been estimated. Evaluations have been also made for each Mediterranean country.
1. Introduction
Wind energy production has seen significant growth over the last decades with a considerable increase in installed power worldwide. Currently, on the basis of the trends registered and the various projects under development, the most interesting perspectives for the exploitation of wind energy mainly concern offshore wind, thanks to the various advantages that it offers, and offshore wind is one of the fastest growing maritime sectors (European Wind Energy Association [EWEA], Citation2013).
Investments in offshore wind are increasing even though the major investments still concern onshore wind energy in relation to its lower installation and maintenance costs. However, recent tender results in Europe for large-scale offshore wind projects indicate possible 40% to 50% cost reductions for new plants by 2021 (Observatoire Méditeranéen de l’Energie [OME], Citation2016). Europe installed 15.638 MW of new wind power capacity during 2017; offshore installations grew 101% compared to 2016 (WindEurope, Citation2018a).
Actually, offshore wind farms are installed in shallow waters mostly in Europe. Including sites that are partially grid-connected, there are now 92 offshore wind farms in 11 European countries (WindEurope, Citation2018b). The offshore wind farms currently operating are characterized by a water depth of less than 50 m and referring to fixed foundations. Just to mention the older ones, Walney Extension (Capacity 659 MW—Irish Sea—Water depth 19–23 m), Gemini Wind F. (Capacity 600 MW—North Sea—Water depth 28–36), London Array (Capacity 630 MW—North Sea—Water depth 0–25 m), Gode Wind (1 + 2) (Capacity 582 MW—North Sea—Water depth 30 m), Race Bank (Capacity 573 MW—North Sea—Water depth 6–13 m).
The most common types of foundation are monopile, gravity based foundations (GBF), suction bucket foundations (SBF), tripod and jacket.
Regarding deep waters, research and development (R&D) activities have increased considerably in recent years and several studies and models are under development and experimentation (Carbon Trust, Citation2015). These activities are opening up new perspectives for the offshore wind farm installation also in deep water. For deep waters the supporting structures for wind turbines are floating type; the main types of structures are the Semi-Submersible (SS), the Tension Leg Platform (TLP) and the Spar Buoy (SB).
Regarding the SS type, the first turbine has been installed in the “WindFloat Project” in Portugal by Principle Power. Inc. “Windfloat” is one of the most mature concepts in the market. Other concepts of SS wind turbines are “Mitsui”, the “GustoMSC Tri-Floater”, the “Vertiwind” prototype, the “VolturnUS”, the “SeaReed” concept (Carbon Trust, Citation2015). There are several studies conducted for this type of structure with reference to the aerodynamic and damping aspects (Le Boulluec, Ohana, Martin, & Houmard, Citation2013; Roddier, Cermelli, & Weinstein, Citation2009; Viselli, Goupee, & Dagher, Citation2014; Zhang & Ishihara, Citation2016).
Regarding TLP typology, the Massachusetts Institute of Technology, together with the National Renewable Energy Laboratory, NREL, was the first to evaluate the possibility of using TLPs for wind turbine installation as early as 2006. Currently, the projects concerning TLPs are still in the scale test phase; an example of this is the “Gicon SOF” project developed by the German company Gicon. Other concepts under development are “Pelastar”, “TLP Wind” “Blue H”,“Eco TLP” (Carbon Trust, Citation2015). For the TLP typology different studies have been carried out also in relation to the different projects under development (Bachynski & Moan, Citation2012; Jagdale & Ma, Citation2010; Nihei & Fujioka, Citation2010; Wehemeyer, Ferri, Skourup, & Freegard, Citation2013).
The first floating turbine of the Spar-buoy type was installed off the southwest coast of Karmoy Island, in Norway, by Statoil as part of the “Hywind” pilot project. In October 2017 the world’s first floating wind farm, the 30 megawatt Hywind Scotland, became operating. Hywind Scotland floating offshore wind farm is made up of five 6 MW wind turbines and it is situated 29 km off Peterhead, Scotland. Another full-scale prototype of floating wind turbine is “GOTO-FOWT” developed by the Japanese Ministry of Environment. Several studies have been carried out in recent years on the Spar typology with particular reference to the Hywind turbine prototype and to the GOTO concept (Nielson, Hanson, & Skaare, Citation2006; Riefolo, Del Jesus, García, Tomasicchio, & Pantusa, Citation2018; Sethuraman & Venugopal, Citation2013; Tomasicchio et al., Citation2017, Citation2018; Utsunomiya, Nishida, & Sato, Citation2009).
To develop new offshore designs in deep waters of the Atlantic, Deep North Sea and Mediterranean Sea, the regulatory authorities are focusing on the development of supportive legislative framework (Global Market Insights, 2018).
Regarding the Mediterranean area, the energy consumption will grow by more than 50% until 2040. In particular, while North Mediterranean countries will see a progressive decrease of energy demand, South and East Mediterranean countries will grow very fast as a result of demographic trends and economic development (OME, Citation2016). Specifically, electricity demand in the South and East Mediterranean is expected to almost triple by 2040. In terms of generation, renewable energy would account for more than 60% by 2040 on average. Solar PV and wind would be the two dominant technologies (OME, Citation2016).
The Mediterranean Sea is characterized by a high wind potential but its deep waters have so far limited the development of offshore wind farms. However, scientific and technological advances are opening up interesting prospects for offshore wind energy also in deep waters and for new markets such as the Mediterranean. Offshore wind farms are not yet operating in the Mediterranean. However, in the next few years, the first offshore wind farm of Italy and of the Mediterranean Sea will be operational off the port of Taranto. The site will comprise 10 Senvion 3MW turbines installed in water depths ranging between 3 and 18 meters (www.windpoweroffshore.com). In 2018 the Turkish Ministry of Energy launched a tender for the country’s first offshore wind power plant (1.2 MW) and in February 2019 the European Commission approved French plans to support four demonstration floating wind farms for producing electricity. Three of these projects (“Golf du Lion”, “Eolmed”, and “Provence Grand Large”) will be located in the Mediterranean Sea (www.europa.eu).
Regarding the Mediterranean area, some studies have dealt with the offshore wind condition with particular reference to mapping aspects on the basis of the offshore wind data deriving from satellite (Calaudi, Arena, Badger, & Sempreviva, Citation2013; Furevik, Sempreviva, Cavaleri, Lefèvre, & Transerici, Citation2011).
Other studies have focused on the assessment of offshore wind potential in the Mediterranean with the use of numerical models (Balog, Ruti, Tobin, Armenio, & Vautard, Citation2016; Menendez et al., Citation2014) and also in relation to future climate change (Koletsis, Kotroni, Lagouvardos, & Soukissian, Citation2016). In Menendez et al. (Citation2014) authors proposed a high-resolution atmospheric hindcast over the Mediterranean area using the Weather Research and Forecasting (WRF) model with the Advanced Research dynamical solver (WRF-ARW model). Two data sets of wind hindcast were produced and used to characterize offshore wind fields. A validation of the hindcast data was carried out in order to evaluate their reliability considering buoy and satellite data. Authors have also detected areas with high power density (over 350 W/m2 at 10 m a.s.l.), coastal regions with <6000 h of wind speed between 2.5 and 25 m/s, and regions with a 50-year return period wind speed higher than 25 m/s. In particular, areas with high power density were detected in the Aegean Sea and in the Gulf of Lion. In Balog et al. (Citation2016) authors proposed numerical simulations of near-surface wind fields from regional climate models (RCMs). Remote sensing observations were used to assess the skill of the simulated fields and a technique for estimating the potential energy from the wind fields over the Mediterranean area was described. A map of offshore wind energy potential atlas was presented and were selected some potential sub-regions for wind farms installation. In particular, the Strait of Gibraltar close to Spanish coast, the Gulf of Lion, the sub-area west of Sardinia, South of Sicily, the central part of the basin, the Greece archipelago and the west part of the Turkish coast were selected. The Gulf of Lion and the Sea of Crete were considered as the most appealing potential areas for wind farms. In Koletsis et al. (Citation2016), the wind speed as well as the resulting wind power potential over the maritime areas of the Mediterranean Sea and a large part of the Black Sea are analyzed by exploring an ensemble of six regional climate model simulations of the current and two future periods produced in the frame of the ENSEMBLES project. Results showed a decrease in mean wind speed and wind power potential over the central Mediterranean Sea with the exceptions of an increase over the Aegean, Alboran Seas and Gulf of Lion, that also presents an important seasonality.
A feasibility study of floating wind technology in deep waters was presented by Zountouridou, Kiokes, Chakalis, Georgilakis, and Hatziargyriou (Citation2015). In particular, the research activity presents a feasibility for the Santorini offshore wind farm in the Aegean Sea. Authors presented a techno-economic study of the project, estimating the complete payback period, the net present value and the internal rate of return, and also a social benefits analysis.
In this context, the present paper deals with the assessment of large-scale offshore wind production of the Mediterranean Sea. Compared to previous studies, novelty of the present paper consists of the estimation of the theoretical maximum annual offshore wind production for the whole Mediterranean area, considering three depth categories, optimized wind farm layouts, and three types of turbines.
The methodology of this work is based on the use of an open GIS platform and considers bathymetric data, annual average wind speed data, environmental data, turbines technical characteristics and administrative information.
Three depth categories have been considered (0–50 m, 50–250 m, 250–500 m) and annual average wind speed range of 4–5–6–7–8 m/s at 100 m a.s.l has been considered. The overlap between depth categories and annual average wind speeds ranges allowed to determine the areas potentially suitable for wind farms allocation. For each of these areas, based on optimal wind farm layouts that take into account the wake effect, the type of foundation and the mooring, the theoretical maximum number of turbines that can be installed has been determined. Based on the determined number of turbines and the type of turbines chosen, the theoretical maximum annual offshore wind production has been estimated for the whole Mediterranean area. Finally, based on exclusive economic zone (EEZ) boundaries, evaluations have been also made for each Mediterranean country.
The present work makes a first estimation of the theoretical maximum offshore wind potential aware that for the real production and feasibility of wind farms this type of study must be integrated with other site-specific considerations.
2. Data & method
2.1. Data
As previously mentioned, the methodology of this work is based on an open GIS platform that uses the data sourced from various open databases, appropriately processed through some plug-ins. In particular, the open-source Geographic Information System QGIS software (www.qgis.org) has been used.
The reference data are:
- Bathymetric data;
- Annual average wind speed data;
- Environmental data;
- Turbines technical characteristics;
- Administrative information.
In the following, the data sources used are listed.
Bathymetric data have been obtained from the “General Bathymetric Chart of the Oceans” (GEBCO) database (https://www.gebco.net/); GEBCO aims to provide the most authoritative, publicly available bathymetry data sets for the world’s oceans. These data are made available in shapefile format; the GEBCO grid is a continuous, global terrain model for ocean and land with a spatial resolution of 15 arc seconds.
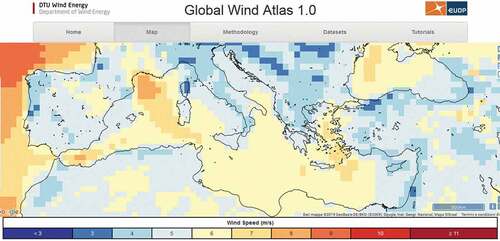
Annual average wind speed data have been derived from the “Global Wind Atlas 1.0” of the Department of Wind Energy of the Technical University of Denmark (DTU Wind Energy) (http://science.globalwindatlas.info/), determined using the Modern-Era Retrospective analysis method for Research and Applications (MERRA) and returned as Aggregated Mean High-resolution Wind Speed Large-scale Wind Forcing at a height of 100 m a.s.l.;
Environmental data concern the delimitation of protected areas and have been derived by the Protected Planet website (https://www.protectedplanet.net/). Protected Planet is the most up to date and complete source of information on protected areas, managed by the United Nations Environment World Conservation Monitoring Centre (UNEP-WCMC) with support from IUCN and World Commission on Protected Areas (WCPA). It is a publicly available online platform where users can discover terrestrial and marine protected areas, access related statistics and download data from the World Database on Protected Areas. The marine protected areas of the Mediterranean have been extracted from the shapefile available on this website;
The turbines technical characteristics refer to the rotor size, to the tower height, to the power curves, to the mooring systems, etc. These data have been derived from the manufacturers’ websites. Turbines from 3 to 6 MW have been considered;
Administrative information refers to the marine boundaries. These data have been derived from the “Marine regions” dataset (http://www.marineregions.org/). This dataset combines the boundaries of the world countries and the Exclusive Economic Zones (EEZ) of the world. It was created by combining the ESRI world country database and the EEZ V7 dataset. The EEZ is a sea zone prescribed by the United Nations Convention on the Law of the Sea over which a State has special rights regarding the exploration and use of marine resources, including energy production from water and wind.
2.2. Method
Regarding the bathymetric data obtained from the Gebco database, in shapefile format and related to bathymetric of all over the world, preliminary activity has been the extrapolation of data for the Mediterranean and the delimitation of the area using the geometric modification tools.
The bathymetric data thus obtained have been subsequently, through spatial interrogation procedures, selected and saved in separate shapefiles by depth categories. The following depth categories have been created:
depth category from 0 to 50 m;
depth category from 50 to 250 m;
depth category from 250 to 500 m.
The depth categories have been chosen in relation to the installation depths of the main types of foundations and platforms for wind turbines (Carbon Trust, Citation2015):
for the depth category from 0 to 50 m, the use of fixed type foundations has been considered, (monopiles, gravity-based foundation, suction bucket foundation, tripod, jacket);
for the category from 50 to 250 m, the use of two types of floating structures has been chosen: the Semi-Submersible type (SS) and the Tension Leg Platform typology (TLP);
for the category from 250 to 500 m, the use of the Spar Buoy (SB) typology has been chosen.
Regarding the floating platforms, the applicable water depth for most concepts begins at around 50 m depth. Spars tend to require at least 100 m depth due to the large draft required. Spars are also able to operate in deeper waters than the other concepts, at up to 500 m, while TLP, semi-submersible, and multi/hybrid platforms can operate in depths up to 400 m. Application in even deeper waters is expected to be possible but will lead to increased costs due to the size of the longer mooring lines (Carbon Trust, Citation2015).
From the areas within these categories have been excluded the areas at a distance of less than 5 miles from the coast to reduce visual impact (Sullivan, Kirchler, Cothren & Winters, Citation2013) and the protected marine areas.
Regarding the large-scale wind forcing, it has been derived from Global Wind Atlas 1.0—TDU Wind Energy. The data used in the Global Wind Atlas were chosen from the best available global datasets. In a reanalysis, observations around the globe and a numerical weather prediction model simulating one or more aspects of Earth system are combined objectively to generate a synthesized estimate of the state of the system. In the 2010s four large atmospheric reanalysis projects took place. All provide an output at a horizontal resolution below 1° × 1°. Three of these reanalyses (i.e., CFDDA, CFSR and MERRA) were generalized and later used in the global wind atlas.
Wind data used in the present work refer to average wind speed from MERRA simulations from 1979–2013. The data are on the native MERRA 0.4 lat x 0.5 lon grid. These data have been extracted and georefenced for the Medirerranean basin, obtaining a shapefile (Figure ). Threshold of annual average wind speed (at 100 m a.s.l.—reference hub height) has been set at 4 m/s, while the maximum value considered is 8 m/s because the distribution frequency relative to higher wind speeds is negligible. The wind speed range thus selected corresponds to 97% of the distribution frequency.
Figure 1. Global wind Atlas 1.0 web page, which highlighted the perimeter of the area of interest
The favorable areas for wind farms have been obtained by overlapping depth categories and annual average wind speeds ranges.
Has been called “exclusive area of a single turbine” the minimum area occupied by a single turbine to take into account the wake effect and the roto-translational movements.
Regarding the determination of the exclusive area of a single turbine in a wind farm, the following criteria have been used:
for the depth category from 0 to 50 m, the studies in the literature related to the determination of wind farm layouts for fixed type foundations have been examined (Aghabi Rivas, Citation2007; Hou, Hu, Soltani, & Chen, Citation2015; Liu &Wang, Citation2014; Sanchez Perez-Moreno, Dykes, Merz, & Zaaijer, Citation2018).
In particular, the approach proposed by Sanchez Perez-Moreno et al. (Citation2018) has been considered. Authors presented a comparison between two approaches for developing the preliminary design of an offshore wind plant turbine layout, electrical collection system, and support structures. The first was a sequential approach neglecting potential interactions between components of the wind farm. The second approach used Multidisciplinary Design Analysis and Optimisation (MDAO), where all components are jointly optimized with the overall system levelised cost of energy (LCOE) as a global objective function. Studying the cases of regular and irregular layouts, the integrated approach always showed a greater improvement in the LCOE of the final design compared to the design resulting from the traditional sequential approach.
Figure 2. Layout and infield cable topology of the regular-layout wind plant using MDAO approach (Sanchez Perez-Moreno et al., Citation2018)
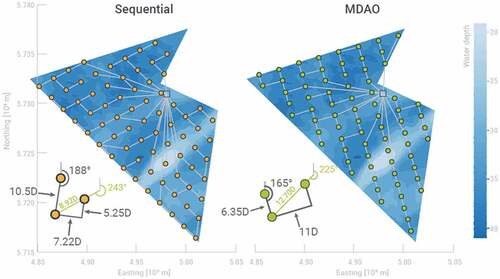
This approach with a regular layout and optimized with MDAO has been used in the work presented here, considering a grid having spacing of 12.7 D on the diagonal and 6.35 D and 11.00 D on the X and Y directions respectively, where D is the rotor diameter (Figure ).
for the depth category from 50 to 250 m, for SS structures with catenary mooring, based on the existing literature, the layout proposed by Knapschaefer (Citation2016) has been considered (Figure ). For the calculation of the catenary length, the maximum depth of the category has been considered.
Figure 3. Layout of integrated mooring system for wind farms (Knapschaefer, Citation2016)
Within this topic, studies on TLP typology are not currently available in the literature. Therefore, it has been considered the same layout chosen for the depth category 0–50 m but with an increase of 10% in distance to take into account the translational movements to which this structure is subjected, as observed in the tank experiments and determined by simulations with numerical models (Chodnekar, Mandal, & Balakrishna Rao, Citation2015; Stewart, Lackner, Robertson, Jonkman, & Goupee, Citation2012; Tomasicchio et al., Citation2012; Zamora-Rodriguez et al., Citation2014).
for the depth category from 50 to 250 m (SB typology), the same layout as the SS type has been used.
Regarding the choice of turbines, three models have been considered:
for the depth category from 0 to 50 m the VESTAS V112–3.0 3 MW turbine, D = 112 m;
for the depth category from 50 to 250 m, the 4.5 MW Gamesa G128/4500 turbine, D = 128 m;
for the depth category from 250 to 500 m, the SENVION 6.2–126 turbine from 6.150 MW, D = 126 m.
The turbines have been chosen with different characteristics and dimensions and with rated power increasing for the three depth categories. The following table (Table ) shows the main characteristics of the turbines.
Table 1. Main characteristics of the turbines
The results obtained relating to the exclusive area of each turbine are described in the “Results and Discussion” Section in Table , while the theoretical maximum number of turbines that can be installed in the areas suitable for wind farms previously determined are shown in Table .
Table 2. Total and net area, and distribution of the area for annual average wind speeds for each depth category
Table 3. Exclusive area for each type of wind turbine foundation/platform
Table 4. Values of theoretical annual offshore wind production by depth category
To determine the energy producibility of a wind turbine it is not sufficient to know the mean speed of the wind at a given site. It is also important that data showing, for a defined time period, the histogram of the percentage duration of the different wind speed is available. From this histogram, it is possible to obtain the histogram of the statistical frequency of occurrence of wind speed. The time distribution of the wind speed for a given site is usually described by using the Weibull statistical distribution function since it comes nearer to the distribution frequency of the mean wind speeds (ABB, Citation2011). The annual production of electrical energy [kWh] can be theoretically expressed and assessed by using Weibull distribution as regards the wind speed at the installation site and the curve of the electric power produced by the wind turbine as a function of the wind instantaneous velocity. As a consequence, the annual producibility can be expressed through the following relation (ABB, Citation2011):
where 8760 is the number of hours per year, P(v) is the power output [kW] of the wind turbine at a wind velocity v [m/s] deduced from the power curve given by the manufacturer, f(v) is statistical distribution function of occurrence frequency of wind speeds at the installation site.
For the wind data, the statistical distribution function of occurrence frequency has been derived from Global Wind Atlas 1.0. Figure shows the Wind Speed Areal Histogram.
The power curves have been acquired by the manufacturers and specialized websites (Senvion, Citation2019; Vestas, Citation2019; Gamesa, Citation2019); these curves have been used to extrapolate the power data [kW] relating to the speeds of 4–5–6–7–8 m/s.
Figure 4. Wind speed areal histogram (Global wind atlas 1.0.—DTU wind energy)
For each average wind speed, the annual energy production for each turbine has been estimated and for the total of turbines installable in the related areas. Annual energy production has also been estimated in relation to the different depth categories. Results are shown in “Results and Discussion” Section, Table . Finally, the annual energy production for each country has been estimated using the EEZ boundaries (Table ).
Table 5. Theoretical maximum annual wind offshore production for each Mediterranean country for the three depth categories
3. Results and discussion
The total areas for depth categories and the net areas obtained by eliminating the areas at a distance of less than 5 miles from the coast and the marine protected areas are shown in the following figure (Figure ).
Figure 5. Total area for each depth category (top); net area for each depth category (bottom)
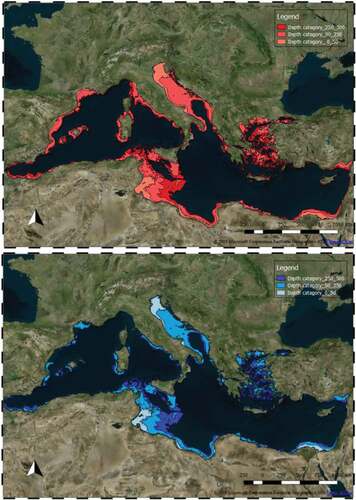
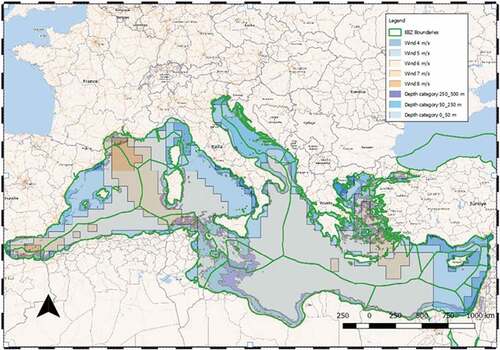
Figure shows the overlap between the depth categories and the areas at different annual average wind speed.
Figure 6. Overlap between the depth categories and the areas at different annual average wind speed
The following table (Table ) shows for each depth category the areas with reference to the total area, to the total net area and to the net area for the different annual average wind speeds obtained by eliminating the areas at a distance of less than 5 miles from the coast and the marine protected areas (“Net area Wind 4” = net area with wind speed of 4 m/s; “Net area Wind 5” = net area with wind speed of 5 m/s; “Net area Wind 6” = net area with wind speed of 6 m/s; “Net area Wind 7” = net area with wind speed of 7 m/s; “Net area Wind 8” = net area with wind speed of 8 m/s).
It is to be noted that the net area is about 30% less than the total area. It is also to be noted that for all the depth categories the largest area available is that with an annual average wind speed of 6 m/s.
By overlapping the depth category areas with the areas related to annual average wind speed ranges, the potentially more favorable areas for wind farm installation have been identified as showed in Figure . The areas circled in red are those more suitable for wind farms installation.
Figure 7. Areas potentially more suitable for offshore wind farms installation
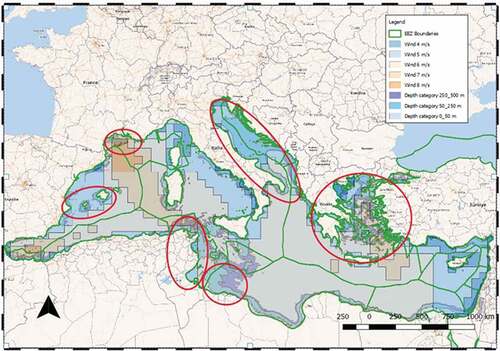
It should be highlighted that, compared with other studies, the overlap carried out in this work between wind speed data and depth has allowed to make a more detailed assessment of the potential areas suitable for wind farms installation.
The greatest wind speeds are found in France. This country is characterized by high annual average wind speeds (7–8 m/s) but, due to the high depths of the seabed, over 500 m, the area potentially exploitable for wind farms is only the Gulf of Lion.
The areas at annual average wind speed of 6 m/s mainly concern the North Africa countries, especially Tunisia and Libya. Tunisia is characterized by speed 5–6–7 m/s for all three categories of depth and the main areas of interest are the Gulf of Tunisy, the Gulf of Hammamet and the Gulf of Gabes. Regarding Lybia, it is characterized by an annual average wind speed of 6 m/s and in the area of the Gulf of Tripoli from Abu Kammash to Misurata it can exploit the whole EEZ area; instead, from Misurata to Benghazi it can exploit a lower part of EEZ because the depths are greater than 500 m.
Greece, although with annual average wind speeds of 5–6–7 m/s is able to exploit almost entirely the Aegean Sea and the area near the Gulf of Patras up to the Diapontia Islands.
Italy is characterized by wind speeds of 5–6 m/s and the most exploitable areas are the South-West of Sicily and Sardinia, the Ionian sea of the Apulia region, and the whole Adriatic Sea. The Adriatic Sea can also be entirely exploited, although with a wind speed of 5 m/s, from Croatia.
Regarding the determination of the exclusive area of a single turbine, Table shows the values obtained for each type of structure on the basis of the assumptions described above.
Obviously, the greatest extension of the exclusive area concerns the SB type in relation to the length of the catenary mooring due to the greater depths of the category.
For each depth category and for each area related to annual average wind speeds, the theoretical maximum number of turbines that can be installed has been estimated. As already mentioned, for the three depth categories, the different turbine models described in Table have been considered, and the range of average wind speed 4–8 m/s has been chosen as it corresponds to 97% of the distribution frequency. The following table (Table ) shows the theoretical annual offshore wind production by depth category obtained.
On the basis of the values obtained and described in the previous table (Table ), the total theoretical annual offshore wind production considering the TLP type for the depth category 50–250 m is 741,87 TWh/year, while considering SS typology it is lower and equal to 634,9 TWh/year.
For each depth category, the theoretical annual wind offshore production for each Mediterranean country has been estimated on the basis of the EEZ boundaries with reference to the total maximum production of 741,87 TWh/year.
In particular, the theoretical maximum offshore wind production for each of the three depth categories and the total production for each country has been estimated. A further estimate has been made considering the ratio between the total production of each country and its area. This ratio expresses an areal density of production.
Table summarizes the results obtained, Figure shows the annual offshore wind production by country (%) for the three depth categories, while Figure shows the total production and the areal density of production.
Figure 8. Annual offshore wind production by country (%) for the three depth categories
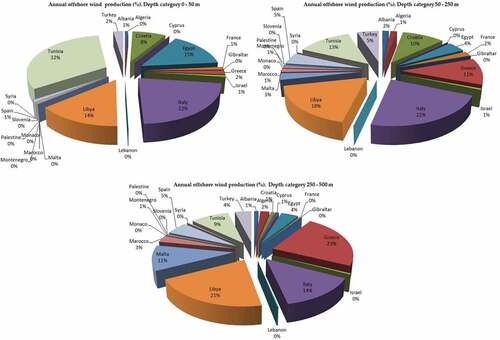
In agreement with the observations made previously on the areas potentially suitable for wind farms installation, it can be noted that for the 0–50 m depth category the largest theoretical maximum annual wind offshore production is for Tunisia, Italy, Egypt, Libya and Croatia. For the depth category 50–250 m, the largest production involves, as before, Italy, Tunisia, Libya, Croatia but also Greece. For the depth category 250–500 m, Greece has the highest production followed by Libya, Italy, Malta and Tunisia.
Figure 9. Total offshore wind production (%) (left); areal density of production (%) for each country (right)
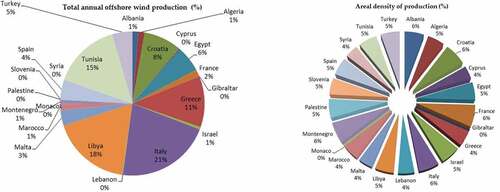
Regarding the areal density of production, it is to be noted that France, which is characterized by a smaller area suitable for wind farms than other countries, has the highest areal density value due mainly to the higher wind speeds. The same is true for Montenegro, while Italy has an equivalent areal density to that of France and Montenegro, which however reaches thanks to the high value of area available for wind farms. Follow Spain and the countries of North Africa. For Spain, the assessments are the same as those of France, while the countries of North Africa, Tunisia and Libya, such as Italy, reach the same value of the areal density thanks to the large areas available. Also Greece, like Italy and the countries of North Africa, has a good value of areal density, mainly due to the high area extension.
4. Interconnections and ship routes
Following are some considerations in relation to the electrical network connecting the offshore wind farms. Currently, the interconnections existing in the Mediterranean Sea are few even if there are interconnection projects undergoing advanced study (Adam & Kowal, Citation2013). Figure and Table show the interconnection projects through the Mediterranean (situation end of 2011).
Figure 10. Existing submarine links and potential transmission projects in the Mediterranean (Adam & Kowal, Citation2013)
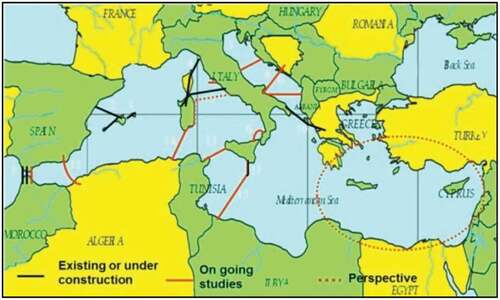
Table 6. Interconnection projects through the Mediterranean (situation end of 2011): existing (no color), decided (in green) and studied (yellow)
Based on the above, some considerations can be made in relation to the areas identified in this paper as areas suitable for the offshore wind farms. The interconnection projects under study between Italy and the North African and Eastern European countries could be used to connect the wind farms. Other projects, such as DESERTEC and MEDGRID, which include a European super grid linking renewable energy projects throughout North Africa, the Middle East and Europe, could be integrated taking into account the developments of offshore wind energy, especially that in deep water in the Mediterranean Sea.
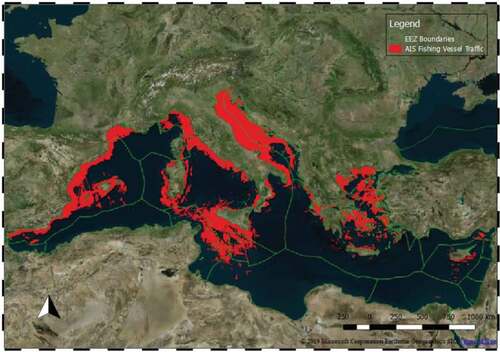
Finally, another consideration must be made on the interaction between wind farms and ship/fishing vessels traffic; in fact, considering only the fishing vessels traffic mapped in the Mediterranean area (Vespe et al., Citation2016), it is evident that most of the areas suitable for the allocation of offshore wind farms are characterized by intense fishing vessels traffic, as shown in Figure . Therefore, the offshore wind farms realization and the regulation of fishing vessels traffic must be appropriately assessed in relation to the priorities of economic interest between the fishing industry and that of offshore wind energy production for each Mediterranean country.
Figure 11. Map of fishing vessels traffic in the Mediterranean Sea (Vespe et al., Citation2016)
5. Conclusions
In the current study, the large-scale offshore wind production for the Mediterranean Sea has been estimated through a GIS-based procedure and on the basis of the bathymetric data derived from the GEBCO database and from the annual average wind speeds derived from MERRA simulations of the Global Wind Atlas 1.0—TDU Wind Energy.
The novelty of this work, compared with previous studies, consists in the assessment of the most suitable areas for the wind farms installation considering not only the wind speed data but also the depths, in the estimation of the theoretical maximum offshore wind energy production based on characteristics of the turbines and optimized layouts, and in having made this estimate for the entire Mediterranean area with detailed analysis of each country.
The Mediterranean countries resulted in more suitable for the installation of offshore wind farms are Italy, Libya, Tunisia, Greece. For Italy, the suitable areas are the South-West part of Sicily and Sardinia, the Ionian Sea of the Apulia region, and the whole Adriatic Sea. The Gulf of Tunisy, the Gulf of Hammamet and the Gulf of Gabes are the exploitable areas for Tunisia, while for Libya the area of interest is the Gulf of Tripoli. The Aegean Sea, the Gulf of Patras and the Diapontia Islands are the areas exploitable for Greece. The results are in agreement with previous studies.
The areal density of production allowed to highlight countries, as France (Gulf of Lion) and Spain (Balearic Sea), that have high wind speeds and are suitable to offshore wind production, but which can exploit restricted areas, and other countries which, on the other hand, achieve good production in relation mainly to the large availability of areas.
Aware that a more realistic approach for the realization of wind farms requires detailed analysis of the specific site, aim of this work was to make a first large-scale evaluation of the offshore wind potential and of the more suitable areas in Mediterranean Sea, in relation to the technical and scientific advances of the sector, which are opening up interesting prospects also for the Mediterranean Sea. In particular, the concrete feasibility of wind farms in the identified areas should take into account the presence of ports, the existence of underwater power grid, ships/fishing vessels traffic, environmental aspects and the potential conflicts between the various economic sectors for each country.
Correction
This article has been republished with minor changes. These changes do not impact the academic content of the article.
Additional information
Funding
Notes on contributors
D. Pantusa
Daniela Pantusa received the degree in Civil Engineering in 2002 from University of Calabria and her Ph.D degree from University of Calabria in 2007. She is currently Researcher Associate at the Department of Innovation Engineering, University of Salento. Her research activity is mainly focused on optimization of water resource management, drinking water supply systems, hydraulic and maritime engineering, offshore wind energy.
G.R. Tomasicchio
Giuseppe Roberto Tomasicchio is Full Professor of Hydraulic Structures, Coastal Engineering and Hydrology at Innovation Engineering Department of University of Salento. His research interests are directed towards a better understanding of some Coastal and Offshore Engineering topics as wave breaking and longshore transport, coastal structures, such as reshaping or berm breakwaters, armour stone degradation, long term wave prediction, rehabilitation of polluted beaches, design and structural risk of coastal structures, wave induced forces at pipelines, and forces at floating structures, offshore wind energy.
References
- ABB. (2011). Technical application papers no.13—Wind power plants. Retrieved from https://library.e.abb.com/public/92faf0c1913f5651c1257937002f88e8/1SDC007112G0201.pdf
- Adam, F., & Kowal, J. (2013, September 2–6). Medgrid—An industrial initiative for the development of interconnections between the Mediterranean power grids. 15 European conference on power electronics and applications (EPE). Lille, France.
- Aghabi Rivas, R. (2007, August 15). Optimization of offshore wind farm layouts (Master thesis). Technical University of Denmark, Lyngby.
- Bachynski, E. E., & Moan, T. (2012). Design considerations for tension leg platform wind turbines. Marine Structures, 29(1), 89–21. doi:10.1016/j.marstruc.2012.09.001
- Balog, I., Ruti, P. M., Tobin, I., Armenio, V., & Vautard, R. (2016). A numerical approach for planning offshore wind farms from regional to local scales rover the Mediterranean. Renewable Energy, 85, 395–405. doi:10.1016/j.renene.2015.06.038
- Calaudi, R., Arena, F., Badger, M., & Sempreviva, A. M. (2013). Offshore wind mapping Mediterranean area using SAR. Energy Procedia, 40, 38–47. doi:10.1016/j.egypro.2013.08.006
- Carbon Trust. (2015). Floating offshore wind: Market and technology review. Retrieved from https://www.carbontrust.com/media/670664/floating-offshore-wind-market-technology-review.pdf
- Chodnekar, Y. P., Mandal, S., & Balakrishna Rao, K. (2015). Hydrodynamic analysis of floating offshore wind turbine. Procedia Engineering, 116, 4–11. doi:10.1016/j.proeng.2015.08.258
- EWEA, European Wind Energy Association. (2013). Deep water—The next step for offshore wind energy. Retrieved from https://ewea.org
- Furevik, B. R., Sempreviva, A. M., Cavaleri, L., Lefèvre, J.-M., & Transerici, C. (2011). Eight years of wind measurements from scatterometer for wind resource mapping in the Mediterranean Sea. Wind Energy, 14(3), 355–372. doi:10.1002/we.v14.3
- Gamesa. (2019). Power curve gamesa G128-4500. Retrieved from https://www.thewindpower.net/turbine_en_81_gamesa_g128-4500.php
- https://www.gebco.net/
- Global Market Insights. Retrieved from https://www.gminsights.com/industry-analysis/offshore-wind-energy-market
- Global Wind Atlas 1.0.. Retrieved from http://science.globalwindatlas.info/
- Hou, P., Hu, W., Soltani, M., & Chen, Z. (2015). Optimized placement of wind turbines in large-scale offshore wind farm using particle swarm optimization algorithm. IEEE Transactions Sustainable Energy, 6(4), 1272–1282.
- Jagdale, S., & Ma, Q. W. (2010, June 20–25). Practical simulation on motions of a TLP-type support structure for offshore wind turbines. The twentieth international offshore and polar engineering conference (ISOPE). Beijing. ISOPE-I-10-058.
- Knapschaefer, J. (2016). Researchers develop offshore integrated mooring system for wind farms. Alternative energy 2016. Retrieved from https://www.enr.com/articles/39295-researchers-develop-offshore-integrated-mooring-system-for-wind-farms?v=preview
- Koletsis, I., Kotroni, V., Lagouvardos, K., & Soukissian, T. (2016). Assessment of offshore wind speed and power potential over the mediterranean and the black seas under future climate changes. Renewable Sustainable Energy Review, 60, 234–245. doi:10.1016/j.rser.2016.01.080
- Le Boulluec, M., Ohana, J., Martin, A., & Houmard, A. (2013, June 9–14). Tank testing of a new concept of floating offshore wind turbine. Proceedings of the ASME 2013 32nd international conference on ocean, offshore and arctic engineering OMAE2013. Nantes, France.
- Liu, F., & Wang, Z. (2014). Offshore wind farm layout optimization using adapted genetic algorithm: A different perspective. Neural and evolutionary computing 2014. Retrieved from https://arxiv.org/pdf/1403.7178.pdf
- Menendez, M., García-Deíz, M., Fita, L., Fernández, J., Méndez, F. J., & Gutiérrez, J. M. (2014). High-resolution sea wind hindcasts over the Mediterranean area. Climate Dynamics, 42(7–8), 1857–1872. doi:10.1007/s00382-013-1912-8
- Nielson, F. G., Hanson, T. D., & Skaare, B. (2006, June 4–9). Integrated dynamic analysis of floating offshore wind turbines. Proceedings of 25th international conference on offshore mechanics and arctic engineering. Hamburg, Germany. OMAE2006-92291.
- Nihei, Y., & Fujioka, H. (2010, June 6–11). Motion characteristics of a TLP type offshore wind turbine in waves and wind. Proceedings of the 29th international conference on ocean, offshore and arctic engineering. OMAE2010-21126. Shanghai, China.
- OME - Observatoire Méditeranéen de l’Energie. (2016). GEM, global energy for the Mediterranean - Special: COOP22 edition, N°15 november 2016. Retrieved from http://www.ome.org/publications/gem-15-special-cop22-edition/
- Riefolo, L., Del Jesus, F., García, R. G., Tomasicchio, G. R., & Pantusa, D. (2018, June 17–22). Wind/wave misalignment effects on mooring line tensions for a spar buoy wind turbine. ASME 2018 37th international conference on ocean, offshore and arctic engineering (pp. V001T01A063; 8). Madrid, Spain. Paper No. OMAE2018-77586, doi:10.1115/OMAE2018-77586
- Roddier, D., Cermelli, C., & Weinstein, A. (2009, May-June 31–5). WINDFLOAT: A floating foundation for offshore wind turbines part I: Design basis and qualification process. Proceedings of the ASME2009 28th international conference on ocean, offshore and arctic engineering, Honolulu, Hawaii, OMAE2009-79229
- Sanchez Perez-Moreno, S., Dykes, K., Merz, K. O., & Zaaijer, M. B. (2018). Multidisciplinary design analysis and optimisation of a reference offshore wind plant. The science of making torque from wind (TORQUE 2018), IOP conf. Series: Journal of Physics: Conference Series, 1037, 042004. doi:10.1088/1742-6596/1037/4/042004
- Senvion. (2019). Power curve Senvion 62M-126 Retrieved from https://www.senvion.com/global/en/products-services/wind-turbines/6xm/62m126/
- Sethuraman, L., & Venugopal, V. (2013). Hydrodynamic response of a stepped spar floating wind turbine: Numerical modelling and tank testing. Renewable Energy, 52, 160–174. doi:10.1016/j.renene.2012.09.063
- Stewart, G., Lackner, M., Robertson, A., Jonkman, J., & Goupee, A. (2012, June 17–22). Calibration and validation of a fast floating wind turbine model of the deepcwind scaled tension-leg platform. Proceedings of 22° international offshore and polar engineering conference. Rhodes, Greece.
- Sullivan, R. G., Leslie, K. B., Cothren, J., & Winters, L. S. (2013). Offshore wind turbine visibility and visual impact threshold distances. Environmental Practice, 15, 33–49. doi:10.1017/S1466046612000464
- Tomasicchio, G. R., Armenio, E., D’Alessandro, F., Fonseca, N., Mavrakos, S. A., Penchev, V., … Jensen, P. M. (2012). Design of a 3D physical and numerical experiment on floating off-shore wind turbines. Proceeding of 33°Conference on Coastal Engineering, Santander, Spain, 2012 in Coastal Engineering Proceedings, 1(33), DOI:10.9753/icce.v33.structures.67
- Tomasicchio, G. R., Avossa, A. M., Riefolo, L., Ricciardelli, F., Musci, E., D’Alessandro, F., & Vicinanza, D. (2017, June 25–30). Dynamic modelling of a spar buoy wind turbine. ASME 2017 36th international conference on ocean, offshore and arctic engineering, volume 10: Ocean renewable energy (pp. V010T09A083; 10). Trondheim, Norway. Paper No. OMAE2017-62246, doi:10.1115/OMAE2017-62246
- Tomasicchio, G. R., D’Alessandro, F., Avossa, A. M., Riefolo, L., Musci, E., Ricciardelli, F., & Vicinanza, D. (2018). Experimental modelling of the dynamic behaviour of a spar buoy wind turbine. Renewable Energy, 127, 412–432. doi:10.1016/j.renene.2018.04.061
- Utsunomiya, T., Nishida, E., & Sato, T. (2009, June 21–26). Wave response experiment on SPAR-type floating bodies for offshore wind turbine. Proceedings of the nineteenth (2009) international offshore and polar engineering conference. Osaka, Japan.
- Vespe, M., Gibin, M., Alessandrini, A., Natale, F., Mazzarella, F., & Osio, G. C. (2016). Mapping EU fishing activities using ship tracking data. Journal of Maps, 12(sup1), 520–525. doi:10.1080/17445647.2016.1195299
- Vestas. (2019). Power curve vestas V112-3.0. Retrieved from https://stopthesethings.files.wordpress.com/2015/12/vestas-v112-specs.pdf
- Viselli, A. M., Goupee, A. J., & Dagher, H. J. (2014, June 8–13). Model test of a 1:8 scale floating wind turbine offshore in the Gulf of Maine. Proceedings of the ASME 2014 33rd international conference on ocean, offshore and arctic engineering OMAE2014. San Francisco, CA.
- Wehemeyer, C., Ferri, F., Skourup, J., & Freegard, P. B. (2013, June–July 30–5). Experimental study of an offshore wind turbine TLP in ULS conditions. Proceedings of the twenty-third (2013) international offshore and polar engineering. Anchorage, AK. International Society of Offshore and Polar Engineers (ISOPE).
- WindEurope. (2018a). Wind in power 2017. Annual combined onshore and offshore wind energy statistics. Retrieved from https://windeurope.org/wp-content/uploads/files/about-wind/statistics/WindEurope-Annual-Statistics-2017.pdf
- WindEurope. (2018b). Offshore wind in Europe. Key trends and statistics 2017. Retrieved from https://windeurope.org/wp-content/uploads/files/about-wind/statistics/WindEurope-Annual-Offshore-Statistics-2017.pdf
- Zamora-Rodriguez, R., Gomez-Alonso, P., Amate-Lopez, J., De-Diego-Martin, V., Dinoi, P., Simos, A. N., & Souto-Iglesias. (2014, June 8–13). Model scale analysis of a tlp floating offshore wind turbine. In OMAE2014, proceedings of the ASME 2014 33rd international conference on ocean offshore and arctic engineering. San Francisco, CA.
- Zhang, S., & Ishihara, T. (2016). Hydrodynamic response of a semi-submersible floating offshore wind turbine: Numerical modelling and validation. 15th world wind energy conference. Tokyo.
- Zountouridou, E. I., Kiokes, G. C., Chakalis, S., Georgilakis, P. S., & Hatziargyriou, N. D. (2015). Offshore floating wind parks in the deepWaters of Mediterranean Sea. Renewable Sustainable Energy Review, 51, 433–448. doi:10.1016/j.rser.2015.06.027