
Abstract
The Fukushima Daiichi Nuclear Power Plant accident caused by the tsunami following the Great East Japan Earthquake in March 2011 resulted in contamination in Namie and Iitate, located in Fukushima Prefecture. These villages are in mountainous areas where achieving decontamination by removing soil is difficult. However, washout by rain is expected. The mountainous land is eroded by rainfall, so the soil will flow out into rivers and ponds. We assumed that polluted soils would have accumulated in ponds, and investigated the sediment to evaluate the mountain decontamination ability of rainfall. Although the surface of the pond sediment was radioactive, highly contaminated layers that were expected to have formed due to heavy rain immediately after the accident were not found. We recognized that the separation of the contaminated soils based on the particulate mean size was carried out in the pond.
PUBLIC INTEREST STATEMENT
The accident at the Fukushima Daiichi Nuclear Power Plant caused widespread contamination in Fukushima Prefecture. Decontamination by removing soil is difficult in mountainous areas. However, washout by rain is expected to occur. The mountainous land will be eroded by rainfall and soils are thought to flow into ponds. We assumed that contaminated soils would have accumulated in ponds, and investigated the sediment to evaluate the decontamination ability of rainfall.
Our analysis showed that the surface of the pond sediment was radioactive. The radioactivity pattern varied as a function of distance from the mouth of the stream and we found that the separation of the contaminated soils based on the particulate mean size was carried out in the pond. The degree of contamination of the ponds depends on the characteristics of the surrounding environment. We found that contaminated clay flows easily from paddy fields into ponds, whereas it seemed to flow less readily from mountains.
1. Introduction
An accident occurred at Fukushima Daiichi Nuclear Power Plant due to the tsunami after the Great East Japan Earthquake in March 2011. The nuclear reactors in the power plant caused hydrogen explosions; radioisotopes in the nuclear reactors were released mainly into the Pacific Ocean due to the westerly wind but partly flowed northwest of the power plant (Terada, Katata, Chino, & Nagai, Citation2012), descended with rain, and contaminated Namie and Iitate villages in Fukushima Prefecture.
The Japanese government evacuated residents and forbidden their residence in areas exceeding a dose of 20 mSv/y (2.28 μSv/h) (Ministry of Education, Culture, Sports, Science and Technology, Citation2013). The soil was contaminated with radioisotopes, consisting mainly of 131I, 134Cs, and 137Cs, which have half-lives of 8 days, 2 years, and 30 years, respectively (Tagami et al., Citation2011). Though the amounts of radioactive of three isotopes were almost same, 137Cs isotopes mainly remain in the soil owing to the long life. Takahashi et al. reported that the specific activities of 134Cs and 137Cs were 623 Bq/kg and 730 Bq/kg in 2011, respectively, while they were 164 Bq/kg and 837 Bq/kg in 2016, respectively (Takahashi, Wakabayashi, Tamura, & Onda, Citation2018).
We confirmed previously that 137Cs is strongly adsorbed on clay in the soil and is not soluble in acid or alkaline solution (Ishii et al., Citation2012). The Japanese government dealt with radiation exposure of the residents by removing the topsoil of areas with a dose of ≥ 0.23 μSv/h at 1 m above the ground (Ministry of the Environment, Government of Japan).
Decontamination, such as removal of topsoil, was performed in urban areas, school grounds, and rice fields, but not in mountainous areas, because such manual methods are difficult to perform on mountainous land. However, natural purification mechanisms, such as the effects of rainfall, are expected to decontaminate these areas.
Japan is a long and narrow, and about 75% of the land area is mountainous. Therefore, the rivers in Japan have a short distance from the upstream at high altitudes to the estuary, and the water in the rivers flows down steep. Japan has a lot of rainfall, and the average annual precipitation is twice the world average (about 1,700 mm) (Ministry of Land, Infrastructure, Transport and Tourism of Japan, Revers in Japan, Citation2006).
Soil erosion occurs by the following mechanism. When it rains on the ground, the impact of the rain hitting the ground surface (raindrop impact) causes the scattering of soil (raindrop erosion) (Kinnell, Citation2005). Raindrop erosion destroys the soil structure, and the scattered soil particles clog the pores on the soil surface. As a result, the penetration of rainwater is blocked, and the rainwater flows the surface of the ground and causes erosion. Therefore, the rainfall helps the movement of soil particles, and they may flow surface of the ground (Yohimura, Onda, & Kato, Citation2015), and erode the mountain soil. We consider that the mountain soil eroded by rainfall will flow into rivers and ponds (Laceby et al., Citation2016; Thai et al., Citation2015; Wakiyama et al., Citation2017), because we confirmed previously that soil particles containing 137Cs flowed from mountains to rivers due to mountain erosion by rainfall (Ohnuma & Ishii, Citation2018).
In mountainous areas, ponds are used to reserve water for rice fields, and also for carp raising, etc. Assuming that polluted soil has accumulated in the bottom of such ponds, we investigated the sediment to determine the level of contamination therein. Residents are now gradually returning to Iitate village, which is one of 11 municipalities that were contaminated and evacuated after the nuclear power plant accident.
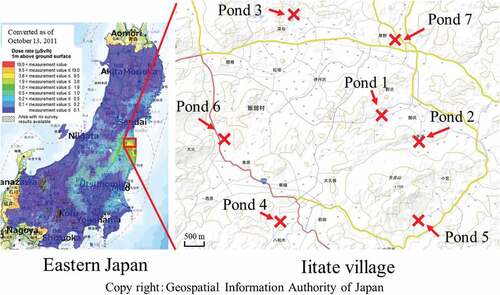
In this study, we collected sedimentary soil samples from seven ponds at four locations in Iitate village (Figure ), and analyzed the radioactivity levels.
Figure 1. Sampling sites of ponds in Iitate village
2. Experiment
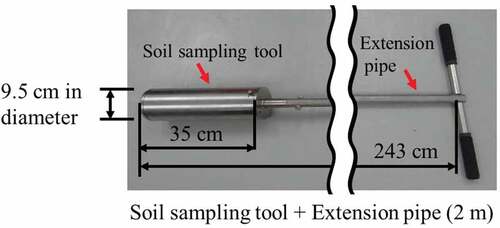
As shown in Figure , sampling of the soil from the bottom of the ponds was carried out using a sampling tool from a boat. The sampling tool consisted of a hand sampler 9.5 cm in diameter and 35 cm in length (HS-30L; Fujiwara Scientific) connected with an extension pipe of about 2.5 m (Figure ). The sedimentary soils in the pond were sampled at each pond bottom at a depth of about 150 cm or less from the surface of the water, and the sample size was about 10–30 cm in length and about 9.5 cm in diameter. We surveyed the dose along the stream flowing into the ponds with a scintillation survey meter (TCS-161; ALOKA) and were sampled the soil where the highest dose value using the hand sampler.
Figure 2. Sampling of sedimentary soil at the bottom of the pond
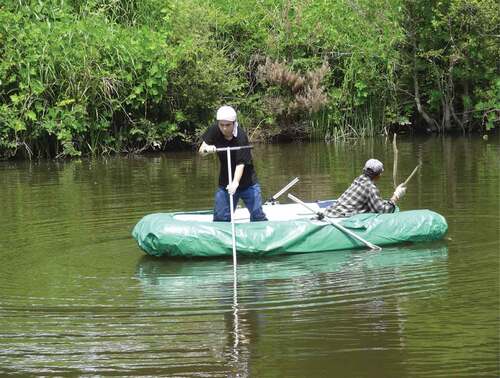
Figure 3. Tool for sampling sedimentary soil at the bottom of the pond
The collected soil was classified by a wet method using four stainless steel sieves (Sanpo) with aperture sizes of 53 μm, 212 μm, 1 mm, and 2 mm.
We used a germanium semiconductor detector (GX 2018; Canberra) to detect 662 keV γ-rays from 137Cs in the sedimentary soil. We measured the weights of the soil samples and determined the specific activity of the sedimentary soil from the ponds.
3. Results and discussion
3.1. Radioactivity as a function of depth from the surface of the pond bottom
Figure shows the specific activities of sediment in ponds 1 to 7 as a function of depth. The origin is the surface of each pond bottom. The depth represents the accumulation of soil flowed from the mountain by erosion in rain. As shown in Figure , an accumulation of contaminated soil from mountains was observed at the bottom of the ponds, indicating decontamination of mountains by erosion due to rainfall.
Figure 4. Depth dependence of specific activity in each pond (The samples were taken at evenly spaced distances from the pond inlet to the opposite bank or outlet)
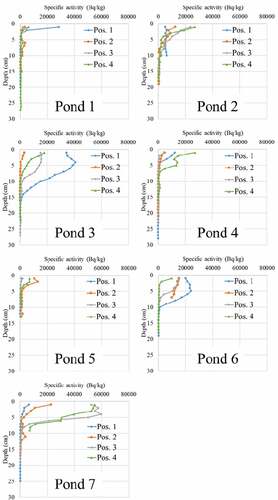
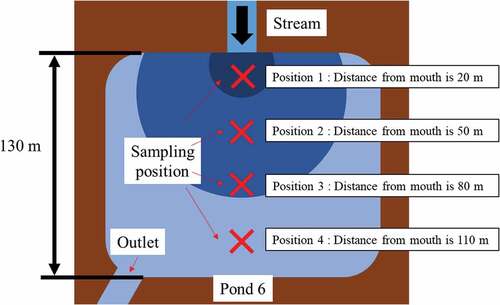
The profile of pond 6 is of interest because of the radioactivity level by depth corresponding to the sampling position. In the pond 6, the specific activity on the surface of the sediment decreased most clearly among the ponds investigated by the distance from the inlet to the sampling position, and the specific activity as a function of depth also changed. Figure shows a schematic representation of the sampling position of pond 6 (Similarly for other ponds, as far as possible we took samples at evenly spaced distances from the pond inlet to the opposite bank or outlet). The specific activity decreased by about half at a depth of 9 cm at position 1, at a depth of 6 cm at positions 2 and 3, and at a depth of 1 cm at position 4 in pond 6. The sediment layer of the contaminated soil at sampling position 1 was thick due to heavy soil deposition from the stream, whereas that at sampling position 4 became thin because light soil flowed in and out of the area. Bigger and heavier particles tend to stop at position 1, thereby increased the sedimentary layer. Further positions 2, 3, 4 tend to be reached by lighter particles, that can be more easily carried away by the water motion. As a consequence, there is more accumulation of radioactive soil at position 1 and less for positions 2, 3, 4, respectively, so that for position 1 the activity dies away with depth more slowly than for the other positions. In addition, we consider concentration also to be relevant since the 0-depth activity is deeper for position 1 and progressively lower for the others.
Figure 5. Schematic diagram showing the separation of the contaminated soils based on the particulate mean size of inflow soil at pond 6
We classified soil particles less than 53 μm from the soil on the sediment surface of pond 6, and measured the particle size distribution in the range of 0.2 to 100 μm using a particle counter with a detection limit of 0.2 μm, which measures the size and shape of particles via optical microscopy static image analysis (Morphologi G3; Malvern).
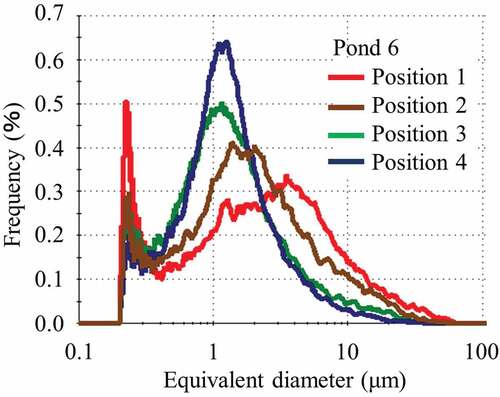
Figure shows the particle size distribution in the range of 0.2 to 100 μm of the classified soil particles less than 53 μm on each sedimentary soil surface sampled in pond 6. As shown in the figure, the peaks in particle size distribution became sharper increasing of sampling distance, and there was a shift toward smaller particle diameter with increasing distance from the mouth of the stream. A separation of the contaminated soils based on the particulate mean size was carried out in pond 6. Most of the particles in the contaminated water pouring into the pond were not precipitated, and typically passed into the pond outlet.
Figure 6. Particle size distribution in the range of 0.2 to 100 μm of classified soil with a particle size of less than 53 μm sampled in pond 6
As indicated in Figure , Ponds 1 and 2 showed a different tendency from pond 6. Pond 1 basically has low specific activity of the sediment. Pond 2 shows that the depth dependence of specific activity changes rapidly toward the sediment surface. We consider that the cause of this is the environment around the pond (Figures and ).
Figure 7. Aerial photographs of the areas around ponds 1
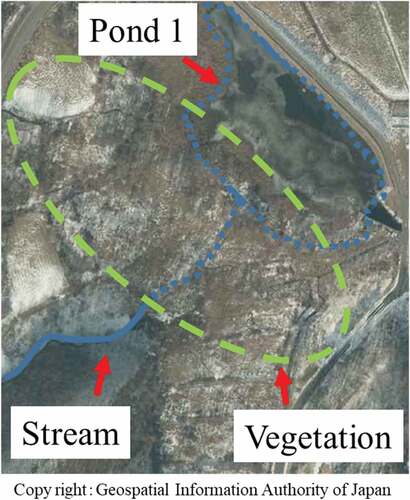
Figure 8. Aerial photographs of the areas around ponds 2
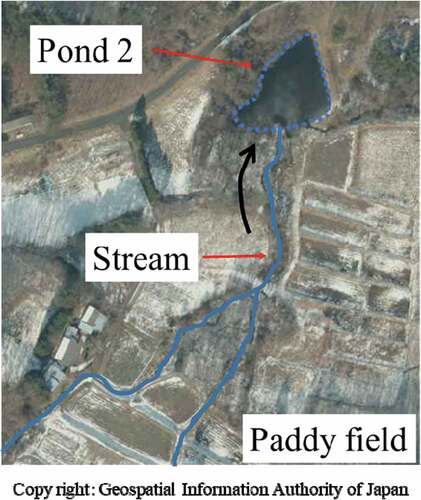
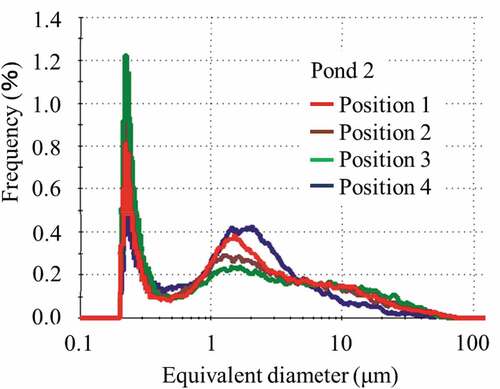
The pond 1 had high levels of vegetation, the amount of water entered the pond 1 is small, the water that enters the pond 2 is a stream that flows through the paddy fields and contains many clay particles, and the flow of water was not in one direction as in pond 6. Figure shows the particle size distribution of the soil particles less than 53 μm on the sedimentary soil surface sampled in pond 2. As shown in this figure, the peak shape in particle size distribution are less pronounced in comparison to pond 6; however, the peak positions were almost the same and did not depend on the sampling position. Contaminated soil separation was not carried out in ponds 1 and 2.
Figure 9. Particle size distribution in the range of 0.2 to 100 μm of classified soil with a particle size of less than 53 μm sampled in pond 2
3.2. Differences in degree of contamination of ponds
As sedimentary soil flows into ponds from the surrounding environment, its specific activity depends on that of the soil around the pond. Figure shows the ratio of specific activity on the sedimentary soil surface to that on the surface of the soil around the pond, for each pond.
Figure 10. Ratio of specific activity on the surface of the sedimentary soil to that on the surface of the soil around each pond (The ratio is calculated by “the mean value of the specific activity of the surface of the sedimentary soil”/“the specific activity of the surface of the soil around the pond”, and error bars are standard error.)
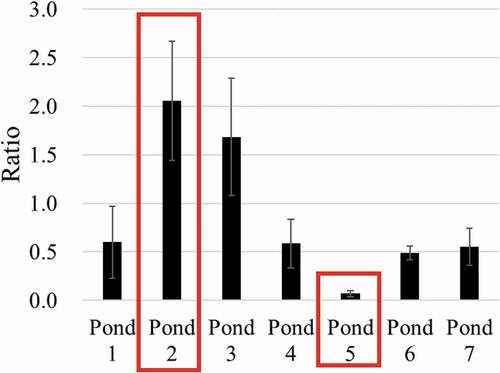
As shown in Figure , specific activity in ponds 2, 3, 5 is very different from ponds 1, 4, 6, 7 (which show a similar ratio among themselves) and is also very different among 2, 3 and 5, with 2 and 5 showed extreme high and extreme low ratio. Therefore, we investigated the topography around ponds 2 and 5, the mass distribution and radioactivity distribution by particle size.
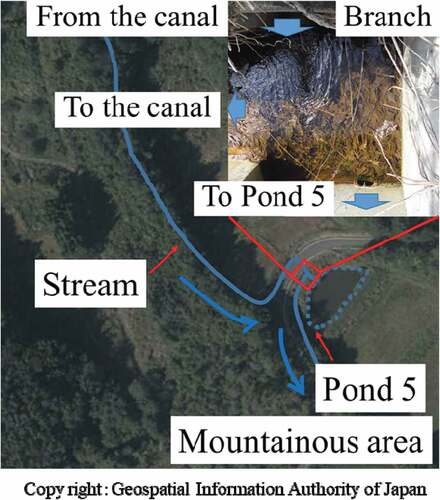
Figures and 1 shows aerial photographs of ponds 2 and 5. In the case of pond 2, the soil flows through a paddy field (gradient, 30 m/500 m), and the stream that flows into the pond 2 is a naturally formed stream and soil is easy to flow into. Pond 5 is on the slope of a mountainous area, and the soil flows through a mountain field (gradient, 60 m/500 m), water flowed into the pond 5 passes through the canal constructed within the vegetation, and soil inflow is blocked by the vegetation. In addition, there is a branch at the entrance of the pond 5. We consider that the soil around the pond 2 is eroded by the rain and easily flows into the stream, but the soil around the pond 5 is not eroded by the rain and the contaminated soil remains.
Figure 11. Aerial photographs of the areas around ponds 5
We considered that the sample with high specific activity on the surface of the pond sediment had high correlation with the soil on the surface around pond, classified the soil on the sedimentary surface at sampling position 4 of pond 2 and sampling position 2 of pond 5, and the soil on the surface around ponds 2 and 5, and measured the mass and radioactivity.
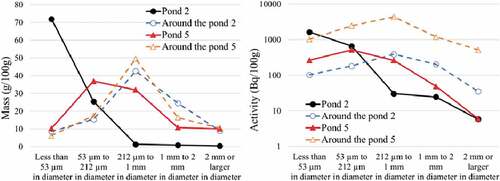
Figure shows the mass and activity distribution for each soil particle size, on the sedimentary soil surface and the surface of soil surrounding ponds 2 and 5. The mass distribution patterns of the soils surrounding ponds 2 and 5 were similar. In pond 2, there were many soil samples less than 53 μm, while pond 5 had few such samples. This difference was due to the flow path passing through the paddy field in pond 2. The radioactivity distribution patterns of the soils around ponds 2 and 5 were similar, but the patterns of the soils in ponds 2 and 5 were different for particles less than 53 μm and from particles between 212 μm and 1 mm. The radioactivity of sediment with particle size less than 212 μm in pond 2 was higher than that of the soil around pond 2. This was because contaminated clay with a particle diameter less than 212 μm flows into the pond via the paddy field.
Figure 12. Mass distribution and radioactivity distribution for each particle size of soil in the sedimentary soil surface and surface soil around ponds 2 and 5
4. Conclusions
We analyzed the sediment in ponds, and the soil around them, in Iitate Village, Fukushima Prefecture. The radiation dose from radioactive isotopes originating from the Fukushima Nuclear Power Plant accident was still high in this area. Contaminated soils have flowed into the ponds due to rainfall. We sampled sediment from the pond bottom and investigated the mass and radioactivity in each pond, and the particle size range.
The results of our analyses indicated that the surface of the pond sediment was radioactive, but the highly contaminated layers expected to be formed by heavy rain immediately after the accident were not observed, due to the movement of contaminated particles toward the pond bottom. The radioactivity pattern varied as a function of distance from the mouth of the stream and we found that the separation of the contaminated soils based on the particulate mean size was carried out in the pond.
The degree of contamination in the ponds depends on the characteristics of the surrounding environment. We found that contaminated clay flowed easily from paddy fields to the ponds, whereas it seemed to flow less readily from mountains.
The result is a part of Iitate Village. Our future task is to expand this survey and make sure that the results are similar.
Acknowledgements
We would like to thank Dr. A. Takeuchi, Dr. H. Arai, and Mr. M Sato for their help with the experiment. We are also grateful to Prof. A. Hasegawa for helpful advice. T. Ohnuma is grateful for the support of Prof. S. Matsuyama and Prof. C. Inoue. The authors are also grateful to anonymous editors for their language edits in this article.
Additional information
Funding
Notes on contributors
Tohru Ohnuma
Our group is engaged in research on remediation engineering of living environments contaminated with radioisotopes.
This paper will contribute to the recovery of Fukushima Prefecture from the contamination caused by the Fukushima Daiichi Nuclear Power Plant accident.
References
- Ishii, K., Terakawa, A., Matsuyama, S., Hasegawa, A., Nagakubo, K., Sakurada, T., … Fujiwara, M. (2012). Measures against radioactive contamination due to Fukushima first nuclear power plant accidents part Ⅲ: Removing and decontamination of contaminated soil. International Journal of PIXE, 22, 13–11. doi:10.1142/S0129083512400323
- Kinnell, P. I. A. (2005). Raindrop-impact-induced erosion processes and prediction: A review. Hydrological Processes, 19, 2815–2844. Published online in Wiley InterScience. Retrieved from www.interscience.wiley.com
- Laceby, J. P., Chartin, C., Evrard, O., Onda, Y., Garcia-Sanchez, L., & Cerdan, O. (2016). Rainfall erosivity in catchments contaminated with fallout from the Fukushima Daiichi nuclear power plant accident. Hydrology and Earth System Sciences, 20, 2467–2482. doi:10.5194/hess-20-2467-2016
- Ministry of Education, Culture, Sports, Science and Technology. (2013). Kikankonnankuikinituite [ The data about the difficult-to-return-to area]. Retrieved from http://www.mext.go.jp/b_menu/shingi/chousa/kaihatu/016/shiryo/__icsFiles/afieldfile/2013/10/02/1340046_4_2.pdf
- Ministry of Land, Infrastructure, Transport and Tourism of Japan. Rivers in Japan. (2006). Retrieved from http://www.mlit.go.jp/river/basic_info/english/pdf/riversinjapan.pdf
- Ministry of the Environment, Government of Japan. Progress on off-site cleanup and interim storage facility in Japan. (2015). Retrieved from http://josen.env.go.jp/en/pdf/progressseet_progress_on_cleanup_efforts.pdf
- Ohnuma, T., & Ishii, K. (2018). Assessment of the effect of rainfall erosion on radioactive decontamination by analyzing the sedimentary layer formed by soil transported from mountains. Cogent Engineering, 5, 1429985. doi:10.1080/23311916.2018.1429985
- Tagami, K., Uchida, S., Uchihori, Y., Ishii, N., Kitamura, H., & Shirakawa, Y. (2011). Specific activity and activity ratios of radionuclides in soil collected about 20 km from the Fukushima Daiichi nuclear power plant: Radionuclide release to the south and southwest. Science of the Total Environment, 409, 4885–4888. doi:10.1016/j.scitotenv.2011.07.067
- Takahashi, J., Wakabayashi, S., Tamura, K., & Onda, Y. (2018). Downward migration of radiocesium in an abandoned paddy soil after the Fukushima Dai-ichi nuclear power plant accident. Journal of Environmental Radioactivity, 182, 157–164. doi:10.1016/j.jenvrad.2017.11.034
- Terada, H., Katata, G., Chino, M., & Nagai, H. (2012). Atmospheric discharge and dispersion of radionuclides during the Fukushima Dai-ichi nuclear power plant accident. Part II: Verification of the source term and analysis of regional-scale atmospheric dispersion. Journal of Environmental Radioactivity, 112, 141–154. doi:10.1016/j.jenvrad.2012.05.023
- Thai, P. K., Suka, Y., Sakai, M., Nanko, K., Yen, J. H., & Watanabe, H. (2015). Export of radioactive cesium from agricultural fields under simulated rainfall in Fukushima. Environmental Science Processes & Impacts, 17, 1157–1163. doi:10.1039/C5EM00063G
- Wakiyama, Y., Konoplev, A., Wada, T., Takase, T., Byrnes, I., Carradine, M., & Nanba, K. (2017). Behavior of 137Cs in ponds in the vicinity of the Fukushima Dai-ichi nuclear power plant. Journal of Environmental Radioactivity, 178–179, 367–376. doi:10.1016/j.jenvrad.2017.07.017
- Yohimura, K., Onda, Y., & Kato, H. (2015). Evaluation of radiocaesium wash-off by soil erosion from various land uses using USLE plots. Journal of Environmental Radioactivity, 139, 362–369. doi:10.1016/j.jenvrad.2014.07.019