
 ?Mathematical formulae have been encoded as MathML and are displayed in this HTML version using MathJax in order to improve their display. Uncheck the box to turn MathJax off. This feature requires Javascript. Click on a formula to zoom.
Abstract
PT. IT is a textile company that produces grey cloth and printing batik. The production process of making grey cloth and printing batik uses a machine that has the potential to cause noise. The noise level that occurs in one production area reaches 100 dB. This value exceeds the threshold value required by the Republic of Indonesia Minister of Health Regulation No 70 of 2016. Therefore, it is necessary to do research to reduce noise levels in the production area. The noise level measurement and calculation procedure refer to SNI 7231-2009 and KEP-48/MENLH/11/1996. The calculation of the maximum time of exposure to noise workers refers to NIOSH. Noise impact questionnaires are processed with descriptive statistics. The calculation of Noise Reduction Rating (NRR) refers to the Regulation of the Minister of Health of the Republic of Indonesia No 70 in 2016. From the 16 measurement points in the weaving department, 11 points with noise levels above NAB are obtained. The impact of noise perceived by workers includes communication disruption, physiological disorders, and psychological disorders. In order to overcome these problems, it was proposed noise control by using Ear Protector in the form of earmuff with NRR 48 dB.
PUBLIC INTEREST STATEMENT
The textile industry is a industry with a high noise level. Noise due to the character of the textile industry production machinery has a high noise level plus the placement of many machines in one room resulted in an increase in cumulative noise levels. The highest noise level weaving department of PT. IT of 105.03 dB, the lowest noise level of 87.53 dB. This noise level exceeds the required NAB. The impact of noise felt by workers includes communication disorders, physiological disorders, and psychological disorders. Noise control in the weaving department by using noise hierarchy control which includes: elimination, substitution, engineering control and administrative control and the use of personal protective equipment (PPE). Noise control by elimination, substitution, and engineering control cannot be applied. PPE by wearing ear protectors Noise control in the weaving department is done using ear protectors in the form of earmuffs with NRR 48 dB.
1. Introduction
Noise is all the unwanted sounds originating from the tools of the production process and/or work tools which at a certain level can cause hearing loss (Indonesia Ministry of Manpower Regulation Number 5 of 2018). Noise caused by production process activities is often found in the textile industry. Several studies have shown that the noise level generated by the textile industry is more than 90 dB (Abbasi et al., Citation2011; Praveen et al., Citation2014; Nassiri et al., Citation2016). This high noise is caused by the character of the production machine in the textile industry has a high noise level coupled with the placement of many machines in one room resulting in an increase in cumulative noise levels (Jayawardana et al., Citation2014).1
High noise levels have a negative impact on employees in the textile industry. Employees in the textile industry are very valuable assets and an important element in the production process. Therefore, employees must be maintained, fostered and developed to increase their productivity. One of them is by reducing the time of exposure to the noise level received by textile industry employees. Hidayah (Citation2011) states that noise in the workplace of the weaving department affects fatigue in the workforce. High levels of noise in the workplace will cause a decrease in worker concentration and a decrease in worker performance (Fanny,Citation2015; Nassiri et al., Citation2013; Sarode, Citation2014). Noise in the workplace can cause operator work stress (Failasufa et al., Citation2014; Suciati, Citation2013). In addition to work stress and labor fatigue, the noise of the work environment of the weaving department also has an impact on the emotional disturbances and cardiovascular burden of the operator (Prabawati, Citation2016).
The existence of the textile industry in Central of Java Province has a significant role in the economy of this region. The textile industry contributes quite significantly in terms of absorption of the number of workers and the value of exports (Suhardi & Kuncoro, Citation2013). PT. IT is one of the textile industries in Central Java Province. Products produced by PT. IT is in the form of grey cloth and printing batik. The production department of PT. IT is divided into two, namely the weaving department and the printing department. The weaving department produces grey cloth while the printing department produces printing batik. The number of workers at PT. IT is 1,000 people. Working hours at PT. IT is divided into three shifts these are shift 1, shift 2, and shift 3. Workers who work in shift 1 starts working from 07.00 to 15.00 Western Indonesian Time (WIB), shift 2 starts from 15.00 to 23.00 WIB, and shift 3 starts from 23.00 to 07.00 WIB. The division of work shifts applies to production employees.
Problems that occur at PT.IT is the condition of the work environment that does not support workers in carrying out production process activities. The working environment condition, in this case, is the noise level that exceeds the threshold value. Based on the results of initial measurements in the weaving department, the noise level is known as 100 dB. While the noise level in the printing department is 78 dB. The noise level in the weaving department is above the predetermined threshold value based on the Permenkes No. 70 of 2016 at 85 dB with a maximum time of exposure which is 8 hour. The noise level of the printing department is below the specified threshold value or can be said still within safe limits. High noise levels in the weaving department will have a negative impact on workers in this department. The management of PT. IT must improve the noise conditions in the weaving department.
The objectives of this study are as follows: 1) to find out the noise level in all machine areas in the weaving department, 2) to find out the maximum time of exposure to noise workers, 3) to find out the noise impacts felt by workers in the weaving department, 4) to provide noise control proposals in the weaving department.
2. Research method
This research was carried out through the following stages:
2.1. Data collection
The data that was used in this study consist of primary data and secondary data. Primary data were in the form of noise data at measurement points in the weaving department and noise impact data felt by weaving department workers. Secondary data collected include general data on weaving section workers, weaving department layouts, types, and specifications of production machines, and employee work times in the weaving department.
The equipment used to measure noise includes 4 in 1 multi-function environment meter, stopwatch to determine measurement time, and GPS application to determine measurement points. The questionnaire was used to collect data about the noise impacts felt by the production department operators of the weaving department. The questionnaire used refers to Rahmi (Citation2009). The questionnaire was given to 40 workers in the weaving department.
2.2. Noise measurement procedure
The noise measurement procedure is based on SNI Citation7231-2009. The timing of noise level measurement and noise level calculation refers to the KEP-48/MENLH/11/1996.
2.3. Measurement of noise level
The noise level measurement was carried out for 24 h by dividing the measurement time during the day which is 16 h and at night which is 8 h. The measurement period for daytime was done between 06.00 and 22.00 WIB. The time range for night measurements was done between 22.00 and 06.00 WIB. Noise level measurements were carried out every 5 second for 10 minute with the height of a 4 in 1 multi-function measuring meter from the 1.5-meter floor.
When measuring the noise level in the weaving department of PT. IT, it was divided into seven that is:
the measurement of the noise level at 06.00 WIB represents the time range of 06.00–09.00 WIB.
the measurement of the noise level at 09.00 WIB represents the time range of 09.00–14.00 WIB
the measurement of the noise level at 14.00 WIB represents the time range of 14.00–17.00 WIB
the measurement of the noise level at 17.00 WIB represents the time range of 17.00–22.00 WIB
the measurement of the noise level at 22.00 WIB represents the time range of 22.00–24.00 WIB
the measurement of the noise level at 24.00 WIB represents the time range of 24.00–03.00 WIB
the measurement of the noise level at 03.00 WIB represents the time range of 03.00–06.00 WIB
Weaving department noise measurement points are 16 points including Picanol Loom machine area, RRT Loom machine area, Toyoda Loom machine area, Palettan area, Pencucukan area, Control room, Sizing area, Warping area, Operator room, and Workshop room. The determination of measurement points is shown in Table .
Table 1. The measurement point of the weaving department
2.4. Calculation of equivalent continuous sound pressure level (Leq), daytime noise level (Ls), night noise level (Lm), and daytime and night noise level (Lsm)
The formula used to calculate Leq, Ls, Lm, and Lsm refers to the KEP-48/MENLH/11/1996 as follows:
Information:
| Leq | = | = The equivalent continuous sound pressure level within 10 minutes |
| n | = | = The amount of noise level measurement data every 5 seconds for 10 minutes |
| Tn | = | = Frequency noise level data at each noise interval |
| ln | = | = Average noise level at each noise interval |
| Ls | = | = Daytime noise level |
| T1 | = | = Noise level measurement time intervals during the period of 06.00–09.00 WIB |
| T2 | = | = Noise level measurement time intervals during the period of 09.00–14.00 WIB |
| T3 | = | = Noise level measurement time intervals during the period of 14.00–17.00 WIB |
| T4 | = | = Noise level measurement time intervals during the period of 17.00–22.00 WIB |
| L1 | = | = Leq calculation results in the period of noise level measurement at 06.00 WIB |
| L2 | = | = Leq calculation results in the period of noise level measurement at 09.00 WIB |
| L3 | = | = Leq calculation results in the period of noise level measurement at 14.00 WIB |
| L4 | = | = Leq calculation results in the period of noise level measurement at 17.00 WIB |
| Lm | = | = Night noise level |
| T5 | = | = Noise level measurement time intervals during the period of 22.00–24.00 WIB |
| T6 | = | = Noise level measurement time intervals during the period of 24.00–03.00 WIB |
| T7 | = | = Noise level measurement time intervals during the period of 03.00–06.00 WIB |
| L5 | = | = Leq calculation results in the period of noise level measurement at 22.00 WIB |
| L6 | = | = Leq calculation results in the period of noise level measurement at 24.00 WIB |
| L7 | = | = Leq calculation results in the period of noise level measurement at 03.00 WIB |
| Lsm | = | = Daytime and night noise level |
2.5. Comparison of the Lsm value with the noise threshold value
The results of the Lsm calculation are then compared with noise threshold values for industrial areas based on the Permenkes No. 70 of 2016. The allowable threshold value is 85 dB with a maximum exposure time that is 8 hour.
2.6. Calculating the maximum time for noise-exposed worker
The formula used to calculate the maximum time for noise-exposed workers refers to the National Institute of Occupational Safety and Health (NIOSH) as follows:
Information:
| T | = | = The maximum time of workers may face (contact) with the noise level (in minutes) is known as the maximum of the time exposure (NIOSH formula) |
| 480 | = | = 8 working hours/day. 1 hour = 60 minutes |
| L | = | = Noise level (intensity (dB)) |
| 85 | = | = Exchange rate |
| 3 | = | = Intensity trade-off, that is a number that shows the relationship between the intensity of noise and noise. |
2.7. Processing of questionnaires to determine the noise impact felt by workers
Questionnaires filled out by respondents are then processed using descriptive statistical methods.
2.8. Control of noise
Control of noise in this study was carried out by using the Ear Protector (APT). The stages in choosing ear protector were done by calculating the Noise Reduction Rating (NRR) by using the following equation:
NRR for single protection:
NRR for multiple protection. The multiple protection means using two ear protections (APT) namely earplug and earmuff.
3. Result and discussion
3.1. Data from results of noise measurement
Noise measurement is carried out every 5 s for 10 min. Data from the noise collected for 10 min were 120. Data from noise measurement at point 1 are shown in Table .
Table 2. Results of noise measurement of point 1 at 06:00 WIB (dB)
From the table, it can be concluded to indicate that the noise levels with a maximum of 104.9 dB, to a minimum of 94.7 dB at point 1. The measurements of noise levels result are then processed into a table of noise levels frequency distribution of point 1 shown in Table .
Table 3. Noise levels frequency distribution of point 1 at 06:00 WIB
3.2. The Leq, Ls, Lm, and Lsm value calculation
The next stage is to calculate the value of Leq, Ls, Lm, and Lsm for all measurement points in the weaving department. The following is the Leq value calculation of measurement point 1 at 06.00 WIB using EquationEquation (2.1)(2.1)
(2.1) .
By using EquationEquation (2.1)(2.1)
(2.1) , the Leq value of point 1 is at 09:00 WIB, 14:00 WIB, 17:00 WIB, 22:00 WIB, 24:00 WIB, and 03:00 WIB can be figure out. The results of the Leq value calculation of point 1 are fully described in Table .
Table 4. Leq value calculation of point 1 at all time measurement
The results of the Leq value calculation of point 1 during the time measurement are the basis in calculating the Ls, Lm, and Lsm value of the measurement point 1. The Ls value calculation refers to EquationEquation (2.2)(2.2)
(2.2) , to the Lm value of 2.3, to the Lsm value calculation of 2.4. The following is the Ls, Lm, and Lsm value calculation of the measurement point 1.
Based on the Lsm value calculation obtained the average value of one point noise for 24 h (Lsm) is equal to 102.50 dB. By using EquationEquations 2.2(2.2)
(2.2) and Equation2.3
(2.3)
(2.3) , and Equation2.4
(2.4)
(2.4) obtained the values of Ls, Lm, and Lsm for the 16 noise measurement points shown in Table . The Lsm value then will be compared with the threshold value (NAB) based on the Indonesia Ministry of Health Regulation No 70 years 2016.
Table 5. The value of Ls, Lm, and Lsm of weaving department at PT. IT
The result of Lsm value calculation from the 16 measurement points has 11 measurement points with the value of the Lsm exceeding the required NAB with the highest Lsm value at the 11th measurement point (machine area Toyoda Loom) of 105.03 dB, to the lowest at the 15th measurement point (machine area warping 1) of 84.50 dB. There are five measurement points with values below the NAB, even though it is also close to NAB. This indicates that the noise levels in the weaving department have been dangerous for workers.
The difference in noise intensity between one point and another point is caused by several factors including the noise source strength and its distance from the noise source. The farther away, sound waves that propagate through the air will experience a decrease in intensity due to friction with the air. In addition to both the impact of sources and distances, there is a barrier in the form of a wall surrounding the noise source which will certainly reflect the sound coming out of the production machines.
3.3. The time of exposure to noise calculation at all measurement points
The next stage is to calculate the time of exposure to noise allowed by NIOSH using an Equation of (2.5). The following is an example of the time of exposure to noise calculation with a maximum of point 1.
The time of exposure of workers to noise at point 1 with a noise level of 102.5 dB is 8.42 min or 0.14 h. The results of the length of time of exposure of workers calculation for all measurement points are shown in Table .
Table 6. The length of time of exposure to the 16 measurement points
Based on the length of time of exposure to noise is perceived by workers after it has been calculated using an equation of 2.5, obtained 11 measurement points that exceed the NIOSH standard which is 8 h of exposure for noise levels of 85 dB. The longest time of exposure to noise at point 15 (machine area warping 1) with the time of exposure of 538.78 min or 8.98 h. The shortest time of exposure to noise at point 11 (toyoda loom machine) with the time of exposure of 4.69 min or 0.08 h. The higher the noise level, the shorter the time of exposure. The lower the noise level, the longer the time of exposure. Workers are allowed to be perceived as noise to a specified time limit. In this regard, further handling of 11 measurement points with a noise level that exceeds the noise quality standard is necessary in order to avoid work-related illnesses for workers mainly caused by high noise levels.
3.4. Noise impacts felt by weaving department workers
The next stage of the study is to identify the noise impacts felt by weaving department workers. The results of processing questionnaires filled in by weaving department workers are divided into two, namely questionnaires related to the identity of respondents and questionnaires related to the noise impact. The respondents from the weaving department were 40 people. The results of processing the questionnaire related to the identity of the respondents are shown in Figure .
Figure 1. The identity of the respondent
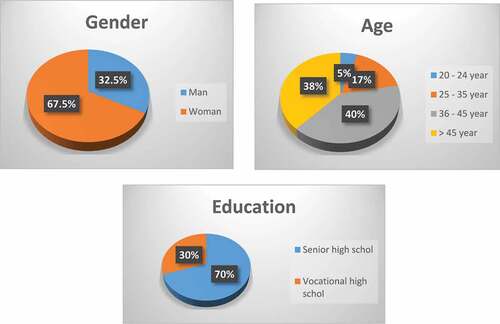
The respondents in this study were mostly female with a percentage of 67.5%. The age of respondents is mostly in the range of 36–45 years with a percentage of 40%, to more than 45 years with a percentage of 38%. Respondents education was divided into two, namely senior high school (70%) and vocational high school (30%).
The results of the processing of noise impact questionnaires felt by respondents were shown in Figures –. The figure showed that respondents experienced communication disruption of 92.5% (Figure ).
Figure 2. Communication disruption
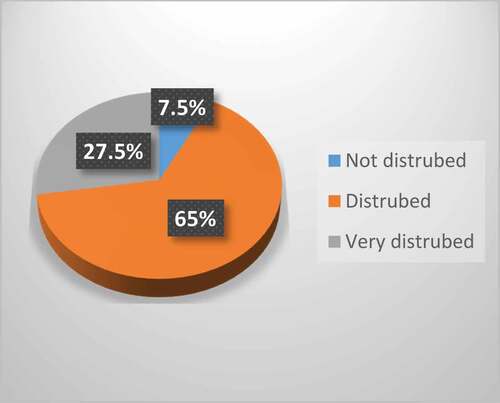
Figure 3. Physiological disorders
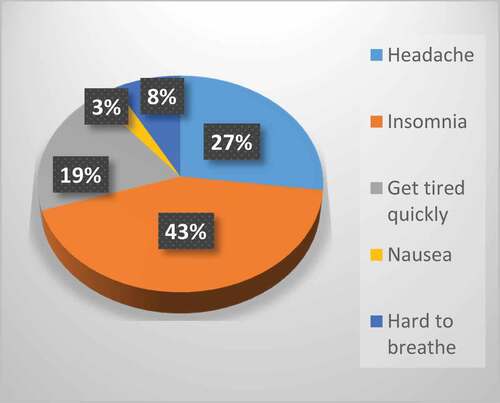
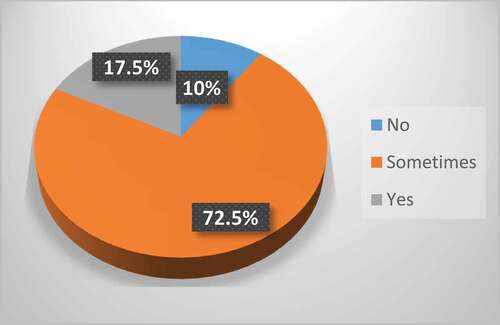
Figure 4. Psychological disorders
The communication disruption level is disturbed by 65%, to a very disturbed of 27.5%. Communication disruption experienced by respondents in the form of difficulties to understand the words of his co-workers, communication between co-workers by shouting, and reprimand from co-workers due to lack of understanding what was discussed by his co-workers. If they were left unchecked, it could cause an error in the production process activities. The results of this study reinforce previous studies conducted by Kholik and Krishna (Citation2012); Buksh et al., (Citation2018) as well.
Physiological disorders perceived by respondents are shown in Figure . Physiological disorders included headache of 27%, insomnia of 43%, get tired quickly of 19%, nausea of 3%, and hard to breathe of 8%. The results of this study reinforce the previous study conducted by Mokhtar et al., (Citation2007), Kholik and Krishna (Citation2012), Ibrahim et al., (Citation2014), Buksh et al. (Citation2018) as well.
Psychological disorders due to high noise levels were perceived by most respondents (Figure ). As many as 17.5% complained of having psychological disorders, to 72.5% of respondents stated that they sometimes experienced psychological disorders. Psychological disorders experienced by respondents in the form of feeling uncomfortable when in the workplace and feeling more easily emotion due to high noise workplaces. The results of this study reinforce previous studies conducted by Kholik and Krishna (Citation2012), Ibrahim et al. (Citation2014) as well.
When the weaving department workers are continuously in the noise workplace, they intend to move to work. This is approved by data said that 77.5% of respondents from the weaving department want to change workplaces with lower noise levels (Figure ).
Figure 5. Workers who want to move to work
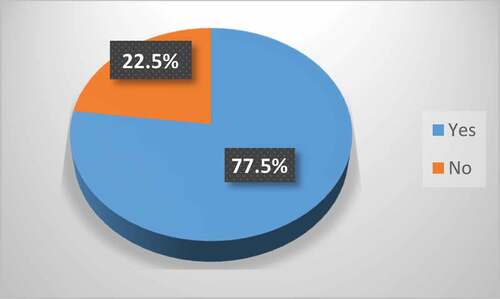
The management of PT. IT has better to carry out the control of noise in the weaving department considering the workers feel uncomfortable with their high noise workplaces. If they were left unchecked, it could cause a decrease in the work productivity of the weaving department workers.
3.5. Noise control of the weaving department
Based on the calculation of the time of exposure to noise at all 16 measurement points, it turns out that there were 11 measurement points that were above the NIOSH standard as described in Table . The noise level is at the 11 measurement points with a maximum of 105.03 dB (point 11), to a minimum of 87.53 dB (point 8). This conducted to indicate that improvements need to be made to reduce the noise level.
Based on the result of Lsm calculation, 11 measurement points exceeded the threshold value (Table ). The measurement points that exceed the threshold value consist of eight measurement points related to the weaving process and three measurement points as support of the weaving process. Measurement points that exceed the threshold value are shown in Table .
Table 7. The measurement points and production process
Table 8. Effective exposure
Noise control carried out in this study is using the Noise Hierarchy Controls Approach. The hierarchy stage includes elimination, substitution, engineering controls and the use of personal protective equipment (PPE). Noise control is focused on the activities of weaving process.
3.5.1. Elimination
Elimination on the noise sources can be done by closing or eliminating the process which become the source of the noise. The main process on the weaving department is weaving. The source of the noise in the weaving department comes from the loom machine. Workers in the weaving department are on duty to oversee the weaving process and connect the yarn if there is a broken yarn. Workers have to stand by near the loom machine with a high risk of noise exposure. The elimination of weaving process can not be done because the merging between weft threads and warp thread is done in the weaving process. Because the elimination can not be done, then the next level of noise control is the substitution stage.
3.5.2. Substitution
Substitution is a replacement of process or noise source with another process or device that has a lower noise level but still allows the access of operation and maintenance. The process of substitution in the weaving process can not be done because the weaving process is the main process of woven fabrics production in the weaving department.
The source of the noise in the PT. IT weaving department comes from the looms machines with an old technology. Old loom machines produce high level of noise. While loom machines with new technology produce low level of noise. Based on interviews with the management of PT. IT, the cost of replacing the old loom machine with a new loom machine is Rp 15,12 billion. With that cost, PT. IT can not afford to buy new loom machines as the replacement of old loom machines. So that, the substitution of old loom machine can not be done. Next level of noise control is engineering control.
3.5.3. Engineering control
Engineering control is one of the efforts that has a significant impact on reducing noise levels. One of the ways that can be done is adding a barrier or enclosure. Barrier is an instrument designed by using dampening material to minimize the noise level that is generated and received by the operators (Figure ). While the enclosure is an instrument used to cover the machine so the noise from the machine does not come out and pollute the environment (Figure ).
Figure 6. Barrier concept on the machine
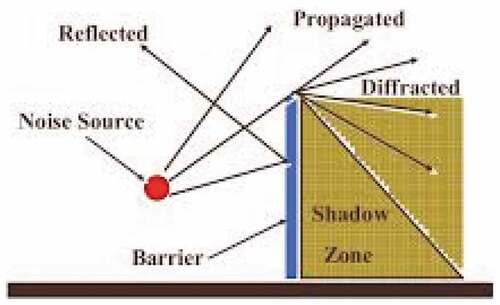
Figure 7. Enclosure concept on the machine
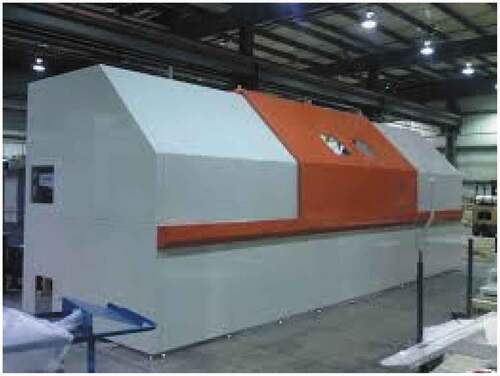
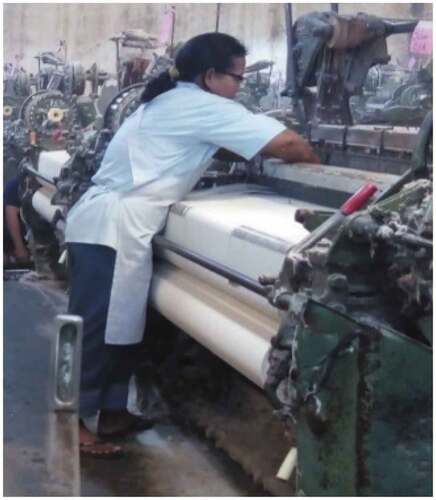
Engineering controls by adding barriers and enclosures can not be done because it can deter the workers to the machines. Weaving activities are a work done by direct interaction between workers and machines. Loom machines at PT. IT is a manual type loom machines that can not be left for a certain time interval (Figure ). This makes workers have to be close to the machine.
Figure 8. Operators when operating the loom machines
3.5.4. Personal protective equipment (PPE)
The next stage of noise control in the weaving department is to use PPE. PPE is provided in the form of ear protection to workers in the area of workplaces. There are two types of ear protectors to protect from the noise workplaces, namely earplugs and earmuffs. Every ear protector has the ability to reduce noise. The effectiveness and ability of ear protectors in reducing noise can be seen based on NRR values. Earplug can reduce noise by 30 dB while earmuff can reduce noise between 40 and 50 dB (Pulat, Citation1992).
The proposed ear protector (APT) is an earmuff with NRR of 48 dB. The following is an example of NRR calculation for single protection at measurement point 1 using an equation of 2.6.
The results of effective exposure calculation for the nine measurement points are shown in Table .
The results showed that using earmuff with an NRR of 48 dB can reduce effective exposure perceived by the weaving department workers. Effective exposure is below the required NAB. Decreasing the noise level received by workers will prevent workers from the risk of hearing loss. Some research also suggests that the use of ear protection equipment can reduce the risk of hearing loss in production workers (Ibrahim et al., Citation2016; Ramadhani et al., Citation2017).
However, compliance with the use of ear protection at work with high noise is still a major problem among workers. The use of ear protection equipment causes workers to experience interference in communicating with co-workers and causes discomfort in the ear (Fitriyani & Wahyuningsih, Citation2016; Ramadhani et al., Citation2017).
The management of PT. IT must require workers in the weaving department to wear earmuffs while working in areas with noise intensity above the NAB. The use of ear muff must also be considered by the management by providing information to workers both during the safety talk or safety meeting so that workers understand the usage of earmuff is good and right in order to maximize the function of the use of ear muff.
4. Conclusion
According to Indonesia Ministry of Health Regulation No. 70 of 2016, noise level day to night (the value of Lsm) in the weaving department of 16 measurement points conducted to indicate that there are 11 measurement points with results above the required NAB. There are 11 measurement points that exceed the NIOSH standard, which are 8 h of exposure for the 85 dB noise level. The majority of weaving department workers experienced communication disruption (92.5%), physiological disorders (100%) and psychological disorders (90%). Noise control in the weaving department is done using ear protector in the form of ear muff with NRR 48 dB.
Additional information
Funding
Notes on contributors

Bambang Suhardi
Bambang Suhardi is a lecturer in Master Program of Industrial Engineering at University Sebelas Maret, Surakarta. His research interests include ergonomic, environmental ergonomic, lean manufacturing, plant layout, and improving work methods in small and medium enterprises. He currently serves as the head a Laboratory Work System Design and Ergonomics, Department Industrial Engineering, Faculty of Engineering, University Sebelas Maret.
Muhammad Abdu Haq Navi
Muhammad Abdu Haq Navi is an alumni of Bachelor Program of Industrial Engineering at University Sebelas Maret, Surakarta and has been graduated on Desember 2018. Now Working at PT. PLN
Rahmaniyah Dwi Astuti
Rahmaniyah Dwi Astuti is a lecturer in Bachelor Program of Industrial Engineering at University Sebelas Maret, Surakarta. His research interest include ergonomics, work system design, and occupational health and safety.
Related Research Data
References
- Abbasi, A. A., Marry, H. B., & Nebhwani, M. (2011). Industrial noise pollution and its impact on workers in the textile based cottage industries: An empirical study. Mehran University Research Journal of Engineering & Technology, 30(1), 35–16.
- Buksh, N., Nargis, Y., Yun, C., He, D., & Gufran, M. (2018). Occupational noise exposure and its impact on worker’s health and activities. International Journal of Public Health and Clinical Sciences, 5(2), 180–195.
- Failasufa, I., Pawenang, E. T., & Indarjo, S. (2014). Hubungan Kebisingan dan Tekanan Panas Dengan Stres Kerja Pada Pekerja Bagian Spinning [Relationship between noise and heat pressure with work stress in spinning section workers]. Unnes Journal of Public Health, 3(4), 1–8.
- Fanny, N. (2015). Analisis Pengaruh Kebisingan Terhadap Tingkat Konsentrasi Kerja Pada Tenaga Kerja di Bagian Proses PT. Iskandar Indah Printing Textile Surakarta [Analysis of the effect of noise on work concentration levels in labor in the process of PT. Iskandar Indah Surakarta textile printing]. INFOKES, 5(1), 52–61.
- Fitriyani, B. B., & Wahyuningsih, A. S. (2016). Hubungan Pengetahuan Tentang Alat Pelindung Telinga (Ear Plug) dengan Kepatuhan Penggunaannya pada Pekerja Bagian tenun Departemen Weaving SL [The relationship between knowledge of ear plugs and compliance for their use in weaving workers in the SL weaving department]. Unnes Journal of Public Health, 5(1), 10–18.
- Hidayah, L. F. (2011). Pengaruh Kebisingan Terhadap Kelelahan Tenaga Kerja di Bagian Mesin Tenun PT. Iskandar Indah Printing Textile. Tugas Akhir [Effect of noise against labor fatigue in weaving machinery parts of PT. Iskandar Indah textile printing] (Final Project). Surakarta: D4 Keselamatan & Kesehatan Kerja, Universitas Sebelas Maret.
- Ibrahim, H., Basri, S., & Hamzah, Z. (2016). Faktor-Faktor yang Berhubungan dengan Keluhan Gangguan Pendengaran pada Tenaga Kerja Bagian Produksi PT. Japfa Comfeed Indonesia, Tbk Unit Makassar Tahun 2014 [Factors related to complaints of hearing loss in the production workers of PT. Japfa Comfeed Indonesia, Tbk Makassar unit in 2014]. Al-Sihah Public Health Science Journal, III(2), 121–129.
- Ibrahim, I. B., Aremu, A. S., Ajao, K. R., & Ojelabi, A. T. (2014). Evaluation of noise pollutan and effects on workers during wheat processing. Journal of Applied Science and Environmental Management, 18(4), 599–601.
- Jayawardana, T. S. S., Perera, M. Y. A., & Wijesena, G. H. D. (2014). Analysis and control of noise in a textile factory. International Journal of Scientific and Research Publication, 4(12), 1–7.
- KEP-48/MENLH/11/1996 Tentang Baku Tingkat Kebisingan [concerning noise level standards]. Jakarta: Kantor Menteri Negara Lingkungan Hidup .
- Permenkes No. 70 Tahun 2016 Tentang Standar dan Persyaratan Kesehatan Lingkungan Kerja Industri [regarding standards and requirements for health of the industrial work environment]. Jakarta: Kementerian Kesehatan Republik Indonesia.
- Kholik, H. M., & Krishna, D. A. (2012). Analisis Tingkat Kebisingan Peralatan Produksi Terhadap Kinerja Karyawan [Analysis of noise level production equipment on employee performance]. Jurnal Teknik Industri, 13(2), 194–200. doi:10.22219/JTIUMM.Vol13.No2.194-200
- Mokhtar, M., Kamaruddin, S., Khan, Z. A., & Mallick, Z. (2007). A study on the effects of noise on industrial workers in Malaysia. Jurnal Teknologi, 46(A), 17–30. doi:10.11113/jt.v46.279
- Nassiri, P., Monazam, M., Dehaghi, B. F., Abadi, L. I. G., Zakerian, S. A., & Azam, K. (2013). The effect of noise on human performance: A clinical trial. The International Journal of Occupational and Environmental Medicine, 4(2), 87–95.
- Nassiri, P., Nabiollah, M., & Negar, R. (2016). Survey of noise pollution in weaving unit of Parsabaft textile factory and providing some noise control ways. International Research Journal of Applied and Basic Sciences, 10(7), 876–881.
- Prabawati, F. (2016). Perbedaan Gangguan Emosional dan Beban Kardiovaskular pada Tenaga Kerja yang Terpapar Kebisingan di Atas dan di Bawah Nilai Ambang Batas di PT. Iskandar Indah Printing Textile. Tugas Akhir [Differences in emotional disorders and cardiovascular loads in workers exposed to noise above and below threshold values at PT. Iskandar Indah textile printing]. (Final Project). Sukoharjo: Kesehatan Masyarakat, Universitas Muhamadiyah Surakarta.
- Praveen, M., Mugundhan, K. P. K., & Visagavel, K. (2014). Occupational health & safety in textile industry. International Journal of Research in Engineering and Technology, 3(Special Issue 11), 168–172. doi:10.15623/ijret.2014.0323037
- Pulat, B. M. (1992). Fundamental of industrial ergonomics. Englewood Clifts, NJ: Hall International.
- Rahmi, A. (2009). Analisis Hubungan Tingkat Kebisingan dan Keluhan Subyektif (Non Auditory) Pada Operator SPBU di DKI Jakarta Tahun 2009. Tugas Akhir [Analysis of the relationship between noise levels and subjective (Non auditory) complaints in gas station operators in DKI Jakarta in 2009] (Final Project). Depok: Departemen Keselamatan & Kesehatan Kerja, Universitas Indonesia
- Ramadhani, S., Silaban, G., & Hasan, W. (2017). Pemakaian APT dengan Gangguan Pendengaran Pekerja Ground Handling di Bandara Kualanamu (Use of APT with Hearing Loss for Ground Handling Workers at Kualanamu Airport). Jurnal Kesehatan Masyarakat Andalas, 12(1), 3–9. doi:10.24893/jkma.v12i1.229
- Sarode, A. (2014). The factors affecting employee work environment & it’s relation with employee productivity. International Journal of Science and Research, 3(11), 2735–2737
- SNI 7231-2009 Perhitungan dan Evaluasi Tingkat Kebisingan [Noise level calculation and evaluation]. Jakarta. Badan Standardisasi Nasional
- Suciati, W. S. (2013). Pengaruh Kebisingan Terhadap Stress Kerja Pada Pekerja Bagian Weaving di PT. Iskandar Indah Printing Textile. Tugas Akhir [Effect of noise against job stress on weaving section workers at PT. Iskandar Indah textile printing] (Final Project). Surakarta: D4 Keselamatan & Kesehatan Kerja, Universitas Sebelas Maret.
- Suhardi, B., & Kuncoro, M. (2013). Key determinants of deindustrialization in textile and products of textile industries: Evidence from Surakarta and Karanganyar, Indonesia. The Empirical Economics Letters, 12(5), 465–472.