
 ?Mathematical formulae have been encoded as MathML and are displayed in this HTML version using MathJax in order to improve their display. Uncheck the box to turn MathJax off. This feature requires Javascript. Click on a formula to zoom.
Abstract
A holistic approach integrating all aspects of building design directly affected by its energy performance is necessary for supporting decision-making throughout the design process. In this work, a decision-support methodology for the energy design of buildings is proposed, considering the three dimensions of the concept of sustainability, and adapted to the level of information detail available in the early design stages. The 4 modules composing this methodology are (i) a set of 36 key design variables defining the building design, (ii) a set of 16 indicators covering environmental, economic and user comfort aspects of building performance affected by energy-related design decisions, (iii) a calculation method for the performance indicators composed of 7 simulation models, and (iv) a knowledge base of building elements, energy sources and meteorological data. The methodology is primarily aimed to assist architects and engineers who participate in the design of office buildings in a French context.
PUBLIC INTEREST STATEMENT
The energy design of buildings can be defined as the decision-making for the selection and sizing of the elements of structures that have a decisive influence on their energy performance. The specific conditions of construction and the heterogeneity of the design criteria make each building a different case: there is no formula that works for all possible situations. To simplify its task, the designer, through his expertise and experience, offers validated solutions in other projects and adapts them to the context of the new project. Nevertheless, the increasing demands in terms of energy performance push the design of buildings beyond the usual solutions, making the work of the designer more and more complex. The objective of this paper is to develop a decision support methodology for the energy design of sustainable office buildings in the early stages of a construction project.
1. Introduction
The building sector is characterized by high energy consumption rates and high emissions of greenhouse gases. In 2010, the sector accounted for 40% of final energy consumption and 36% of all carbon dioxide emissions in the European Union (European Commission, Citation2013). Therefore, improving the energy performance of buildings represents a cost-effective way of reducing climate change and improving energy security (Eichhammer et al., Citation2009).
Current approaches focusing solely on the reduction of energy consumption during the operation phase of buildings may cause undesirable results. These include a degradation of user comfort conditions and an increase of both the investment cost and the environmental impact of construction products. A holistic approach integrating other aspects directly affected by the energy performance of buildings is thus necessary for supporting decision-making throughout the design process.
International initiatives such as the European projects OPEN HOUSE (Citation2013) and SuPerBuildings (Hakkinnen, Citation2012) as well as the works of the technical committee CEN TC350 (European Committee for Standardization, Citation2011, Citation2010, Citation2012a, Citation2012b) converge on integrating the concept of sustainability into the decision-making process of building design. This is done by considering criteria covering the three dimensions of sustainable development: environment, economy and society. This approach is more effective when applied during the early stages of a building project, when design decisions have a higher impact potential on building performance (Agency, International Energy, Citation2003). However, these stages are characterized by a limited availability of information, which complicates performance assessment.
Various tools and methodologies are proposed in the literature to assist decision-making in the early stages of the energy design of buildings by considering multiple sustainability-related criteria simultaneously (D’Amico & Pomponi, Citation2018; Gan et al., Citation2018; Meex, Hollberg, Knapen, Hildebrand, & Verbeeck, Citation2018b; Moghtadernejad, Chouinard, & Saeed Mirza, Citation2018). Ochoa and Capeluto (Citation2009) propose NewFacades, a decision-support tool for the design of facades that evaluates the performance of design alternatives based on their energy consumption and daylight glare index. Wang, Zmeureanu, and Rivard (Citation2005) employ a multi-objective optimization algorithm to find Pareto solutions combining life-cycle cost and an exergy-based environmental impact indicator. Similarly, Baek, Park, Suzuki, and Lee (Citation2013) have studied the effects of eco-architectural techniques on life-cycle costs and carbon dioxide emissions. Attia, Gratia, De Herde, and Hensen (Citation2012) help selecting passive and active strategies using energy consumption or generation in the design of nearly zero energy buildings in an Egyptian context. Hamdy, Hasan, and Siren (Citation2013) propose a three-stage optimization model for designing nearly zero-energy buildings using present worth, space heating demand, summer comfort, difference in life-cycle cost and primary energy consumption indicators. Requirements for the implementation of Life Cycle Assessment in early stage design of buildings have been proposed by Meex, Hollberg, Knapen, Hildebrand, and Verbeeck (Citation2018a); their methodology is designed for architects, in order to take into account environmental impact in these early design stages. Similarly, Gervásio, Santos, Martins, and Simões da Silva (Citation2014) presented a life-cycle approach in early design stages in which the life-cycle environmental performance is estimated by a macro component; their approach allows overcoming the lack of design data in order to guide the designers in achieving a long-term building efficiency. Furthermore, a design-decision support tool named UrbanSOLve has been proposed and tested by Nault, Waibel, Carmeliet, and Andersen (Citation2018); it aims to design the neighborhood according to its energy and daylight performance. In this tool, the performance evaluation is based on a predictive approach using a metamodeling and an optimization procedure in order to identify the design parameters that maximize the benefits and minimize the costs; this tool can also generate different alternatives of design, leading practitioners to compare them before planning their own final design decisions.
In general terms, the evaluation tools used in the early design stages are based on simplified calculation algorithms, which allow for short simulation times and require a limited amount of input data in order to be compatible with the level of information available at these design stages. However, these tools consider at most two of the three aspects of the concept of sustainability at a time, normally complemented with energy consumption criteria.
In this context, we propose a progressive decision-support methodology for the energy design of buildings which considers the three dimensions of sustainability and which is adapted to the level of information detail available in the early design stages. Furthermore, we propose a model for structuring decision-making to be integrated into the decision support methodology in order to take into account the progression of design decisions throughout the building design process. The methodology is primarily aimed to assist architects and engineers who participate in the design of office buildings in a French context.
2. Progressive decision support methodology
The aim of the proposed methodology is to provide an overview of the impact of energy-related decisions on all aspects of the building influenced by energy performance, in order to assist through the selection and sizing of the related building elements. The methodology is based on a comparative assessment of design alternatives through the concept of sustainability and based on a whole life-cycle approach.
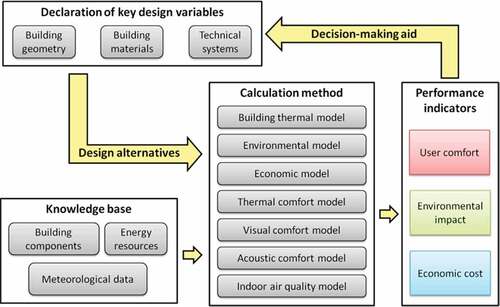
Four modules compose the proposed methodology:
A set of 36 key design variables defining the building design, representative of the decisions taken during the early stages, and a set of 16 indicators covering environmental, economic and user comfort aspects of building performance affected by energy-related design decisions.
A calculation method for the performance indicators composed of seven simulation models and adapted to the level of information detail available in the early design phases.
A progressive logic of the design decisions given as a model of sequential distribution of the choices to be made at each phase of the project. This logic is based on a basic building configuration, representing values to be considered by default for the choices that have not yet been decided in a given phase.
A knowledge base of building elements, energy sources and meteorological data, used to effortlessly translate design decisions into their corresponding simulation parameters.
An overview of the proposed methodology and its composing modules is shown in Figure .
Figure 1. Overview of the proposed progressive decision-support methodology
2.1. Key design variables
Based on an analysis of the decision-making process during the early design stages, 36 key design variables have been identified as having a decisive impact on the energy performance of the building. These variables cover building geometry, materials and technical systems, and are presented in Table .
Table 1. Key building design variables in the early design stages
A series of hypotheses and simplifications were considered for the definition of the key design variables. In order to simplify geometrical input requirements, identified as one of the main barriers towards decision-support tools use during early design stages (Attia et al., Citation2012), a rectangular building plan and a typical distribution of interior spaces, both representative of office buildings, were considered as presented in Figure . Table proposes the building spatial dimensions.
Figure 2. Distribution of interior spaces in the building plan
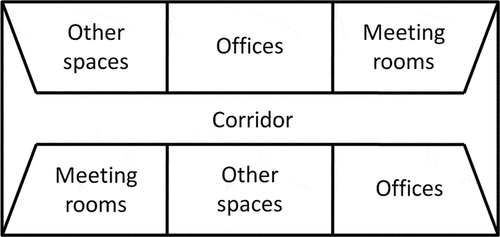
Table 2. Spatial dimension values of the building
While energy consumption of the building is calculated based on its heating, cooling, mechanical ventilation and artificial lighting needs, no design variables regarding artificial lighting or system operation parameters were taken into account at this point, since these are normally defined during later stages of the design process. Thus, typical values for these variables in the office building were considered.
2.2. Performance indicators and calculation methods
In order to characterize the impact of energy-related design decisions, a set of 16 indicators was selected covering the three dimensions of sustainability, based on the performance-based approach followed by the OPEN HOUSE and SuPerBuildings projects as well as the works of the CEN TC350. These performance indicators are compatible with the limited level of information detail available at the early design stages and are calculated using simple calculation algorithms with a reduced cost in simulation time. Furthermore, their selection is consistent with the current availability of sources of simulation parameters, including environmental profile databases, considered as one of the main obstacles for analysis in France (LEBERT et al., Citation2013).
The selected performance indicators are presented in Table and further information regarding their selection criteria and calculation are given in the following sections. The perimeter of analysis of the environmental and economic evaluations includes (i) the building components used both during the construction phase and the operation phase (due to component replacement), and (ii) the energy resources consumed by technical systems during the operating phase.
Table 3. Performance indicators for the energy design of sustainable buildings
2.2.1. Environmental indicators
The assessment of the environmental performance at a building level based on the individual contributions of each building component is described in the EN 15,643–2 standard (European Committee for Standardization, Citation2011). The environmental contribution of a type of flow associated with the building’s life cycle is calculated as the product of the amount of functional units of said flow used during the analysis period
and the respective environmental impacts vector per unit
:
To evaluate the environmental impact throughout the building, the individual contributions of all material and energy flows considered in the scope of analysis are aggregated. Finally, the values of the environmental profile of the building are expressed in terms of the floor area and the duration of the period of life-cycle analysis (set as 50 years in this work), in order to facilitate comparison between different building design alternatives.
2.2.2. Economic indicators
According to ISO 15,686-5 (International Organization for Standardization, Citation2008), the contribution of a type of flow to the overall cost of the building is simply given as the product of the number of functional units of the flow used throughout the analysis period
and its associated cost per unit
:
This method applies for the calculation of the construction cost, given at the time of the building’s delivery. In contrast, when calculating operating costs which take place at a later stage in the building’s lifetime, these expenses must be updated by projecting its future value to its equivalent value at the reference date. This is done through the discount rate “” as shown below:
where “” is the time (in years) between the building’s delivery date and the date of the operating expense.
2.2.3. Social indicators
2.2.3.1. Hygrothermal comfort model
Although hygrothermal comfort may depend on a large number of parameters, a thermal model based on an interval of acceptable air temperatures is prevalent in current practice because of its implementation simplicity. Such a simple model has been retained in this work in accordance with the chosen building thermal model, which does not include any equation for humidity transfers.
In this model of thermal comfort, two temperatures are specified: the indoor air temperature and the operative temperature of the indoor environment. The estimation of the operative temperature of an indoor space usually depends on the conditions of relative humidity and air velocity and on the activity level and clothing of the occupants. However, in the case of office buildings, this temperature can be approximated as the average of the temperature of the walls surrounding a space
and the air temperature inside the space
(American Society of Heating, Citation2004):
The percentage of time of thermal comfort at each thermal zone of interest is then calculated as the ratio between the time of comfort during occupancy and the total number of hours of annual occupancy. Finally, this hygrothermal comfort indicator is given as the weighted average based on the surface area of the spaces of interest (offices and meeting rooms).
2.2.3.2. Visual comfort model
In general, a space can be considered autonomous in terms of daylight when the value of illuminance inside is higher than the level required by the type of activities. The level of illuminance required for an office space is normally considered equal to 500 lux, as proposed in the EN 15,251 standard (European Committee for Standardization, Citation2007).
In this work, the average Daylight Factor is used to calculate the illuminance level in each of the spaces of interest. This Daylight Factor, commonly used to evaluate the potential of access to daylight, is given as the ratio between the indoor illuminance level on a reference plane and the corresponding outdoor illumination level under an overcast sky (Université catholique de Louvain, Citation2014). Its calculation involves the geometry of the space as well as the optical properties of the internal surfaces enclosing this indoor space.
Based on this Daylight factor and the required indoor illuminance level of 500 lux, a corresponding minimum value of the outdoor illuminance is calculated for each space. This minimum level is then compared at each time step of the simulation to the outdoor illuminance level for building location, thus determining the number of occupancy hours during which the space is autonomous in terms of daylight.
As in the case of the hygrothermal comfort indicator, the daylight autonomy at the building level is given as the weighted average based on the surface area of offices and meeting rooms.
2.2.3.3. Acoustic comfort model
In this work, the weighted standard level difference of the building facades is obtained using the calculation method proposed by the French certification Qualitel (HOUSE Citation2012). This method incorporates the result of the complex analysis of spectral profiles defined in the EN 12,354 standard into a single parameter characterizing each façade component: the reduction index. This value depends on the type, thickness and position of each wall layer composing the facade.
As specified in the Qualitel certification, three types of acoustic transmissions are to be considered in the calculation of the weighted standard level difference: direct, indirect and equipment transmissions. Indirect transmissions are negligible when the isolation required is less than 35 dB, which is usually the case. Furthermore, acoustic transmissions through equipment such as air intakes are not considered in this work because they are not yet defined in the early stages of the design project. Thus, only direct acoustic transmissions are considered here: the definition of weighted standard level difference of a composite façade is then given in terms of the volume of the space
as well as the surface area
and reduction index
of windows and opaque walls:
In the case of windows, the reduction index is usually given by the manufacturer based on the type ad number of glazing elements. The reduction index of an opaque wall
is calculated as the sum of the value related to the structural wall
and its correction due the thermal insulation
, both values given in the Qualitel certification for a wide range of materials, as shown below:
2.2.3.4. Indoor air quality model
The calculation method of the expected percentage of user satisfaction with the quality of indoor air is given as a generalization of the comfort levels proposed in EN 15,251 (European Committee for Standardization, Citation2007). In this standard, 4 categories of comfort related to indoor air quality are proposed as a function of the air change rate per occupant. Each category is associated to a given percentage of user dissatisfaction with the air quality. The indicator selected in this work represents the complementary amount of this percentage; it thus represents, for each selected air change rate, the ratio of occupants which are considered to be satisfied with the indoor air quality.
In order to generalize the assignment of a percentage of user satisfaction for any given value of the ventilation rate per occupant , an equation defining the relationship between these two quantities has been obtained through a regression analysis. The expected percentage satisfied
is thus estimated as follows:
2.3. Progressive decision-making model
Decision-making through the building design process follows a natural progression from general decisions, such as building geometry and facade glazing ratio, to more specific decisions, such as glazing type and thermal insulation thickness. In order to aid the decision-making throughout the early design stages, in this work, we propose a progressive decision-making model as a support guide to structure decision-making in the energy design of buildings. This progressive model is to be integrated into the performance assessment methodology described in the previous sections, aimed at the energy design of sustainable buildings.
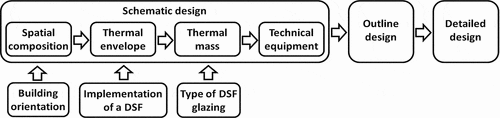
The design process of a building varies from a country or region to another. In France, the progression of a construction project is dictated by the legal framework on public works performed by private providers (JORF, Citation1994). Among the various project phases identified in this framework, it is essential in the first three where critical decisions vis-à-vis energy building design are taken. These design stages (“Esquisse”, “Avant-Projet Sommaire” and “Avant-Projet Détaillé”) are translated in this work as Schematic Design, Outline Design and Detailed Design, as shown in Figure .
Figure 3. Building design stages in the proposed decision-making model

During the schematic design phase, an initial but complete proposal for the design of the building is defined in broad terms. All aspects of the building are considered, at least in very general terms, to define the overall outline of the energy strategy. In order to introduce a linear logic in the design process, the schematic design phase is divided into four sequential sub-stages, as shown in Figure . These steps are mostly related to or have an impact on one of the following building aspects: spatial composition, thermal envelope, thermal mass and technical equipment. At each of these sub-stages, design decisions are primarily related to or have an impact on the aspect in question.
After an initial definition of the building design has been declared, the following two stages are aimed at increasing the precision of variable declaration. In the outline design phase, the initial proposal defined in the previous phase is complemented by increasing the level of accuracy of design decisions, especially in terms of building envelope composition and the choice of technical systems. The detailed design phase is characterized by a higher level of accuracy in the declaration of all design variables from the two previous stages; in this third phase, the designer makes specific decisions for the dimensioning of building elements, mainly concerning the composition of the building envelope and the choice of materials.
Table shows the design decisions to be made at each of the design stages as proposed in the progressive decision-making model. Two levels of precision are identified in the decision-making model proposed here:
On a general level, typologies of either numerical values or types of building components are proposed, given as typical design choices representing a family of components or a representative interval of values.
On a more precise level, specific numerical values or types of building components are to be declared.
Table 4. Design decisions composing the progressive decision-making model
In order to evaluate the performance indicators at the earlier phases, where only general decisions are fixed, a set of default values describing a default initial building configuration will be used to fill in the blanks (specific values which have not been fixed). This set of default values has to represent the most common values for a given building type in the corresponding implementation context. These default values are to be identified from surveys of high-performance buildings as to serve as proven starting points for good energy building design (see sections 3.2 and 4.2).
2.4. Basic knowledge database
A basic knowledge database containing the simulation parameters describing the key design variables (see Table ) has been compiled. It consists of three types of information:
Environmental, economic and technical data describing the building components and materials.
Environmental and economic data describing the energy sources used by the technical systems.
Meteorological data, including solar irradiation, wind speed and illumination levels of various geographical locations.
3. Building thermal modelling
3.1. Definition of the basic thermal model
The selected thermal model is based on a multizone building nodal network model, as proposed in the works of Roux (Citation1984) and Caccavelli, Roux, and Brau (Citation1987). In this model, the main building elements, including walls, windows, floor slabs and inside air mass, are modeled as a network of resistances and capacities, as shown in Figure .
Figure 4. Principle of the thermal-electrical analogy for a wall toward a nodal network model
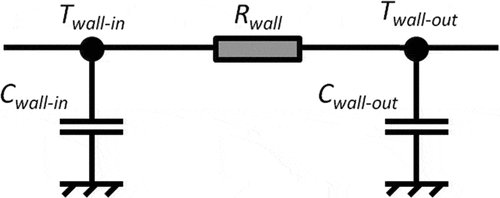
Based on this principle, building elements are represented as follows:
the elements composing the envelope of the thermal zones, including roof, bottom floor, walls and intermediate floors between thermal zones, are modeled using a thermal resistance
as well as 2 thermal capacitances
partitions within the same thermal zone are modeled by a thermal capacitance,
glazing elements, whose thermal inertia is considered negligible compared to that of opaque walls, are represented by a thermal resistance.
Additionally, each thermal zone is considered at a homogeneous air temperature value.
Figure presents the whole thermal-electrical representation of the elements composing the building, as well as all the thermal exchanges considered in the building thermal model.
Figure 5. Nodal thermal model of a building zone and thermal exchanges with external resources
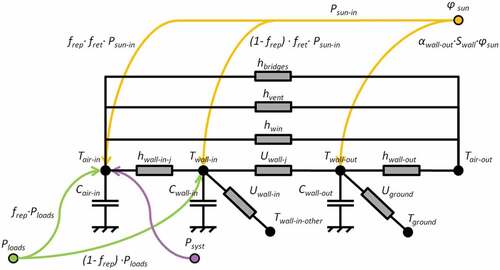
For each of these nodes, different heat exchange phenomena are considered in the thermal balance:
convection and radiation between the air inside the thermal zone and the inner surface of the walls,
convection, radiation and conduction between the air inside the thermal zone and the outdoor air, through the windows,
convection due to air flow between the thermal zones and the outdoor air,
absorption of solar radiation by the air inside the thermal zone and by the inner and outer surfaces of the walls,
absorption of heat flow from internal loads (occupancy, office equipment and lighting) by the air inside the thermal zone and the inner surfaces of the walls,
convection between the air inside the thermal zone and the heating and cooling technical systems,
conduction between the inner and outer surfaces of the envelope walls (excluding thermal bridges),
conduction between the air inside the thermal zones and the air outside through the thermal bridges of the envelope,
convection and radiation between the outer surface of the envelope walls of thermal zones and the outdoor air,
conduction between the outer surface of the envelope walls of the thermal zones and the ground.
3.2. Definition of a basic default initial configuration
The choice of the default values that characterize the initial default configuration were identified through a study of the BBC Observatory database (Collectif Effinergie, Citation2014) and are shown in Table . This database compiles energy-efficient project statistics, with High Environmental Quality (HQE) and Low Consumption Building (BBC) certifications as well as other exemplary buildings in France. All of the office building projects, documented in this database in February 2013 (a total of 63 projects), were considered for the identification of the possibilities of choice in this work.
Table 5. Design decision values describing the default initial building configuration
4. Implementation methodology of a complementary system: illustration through the example of a double skin facade
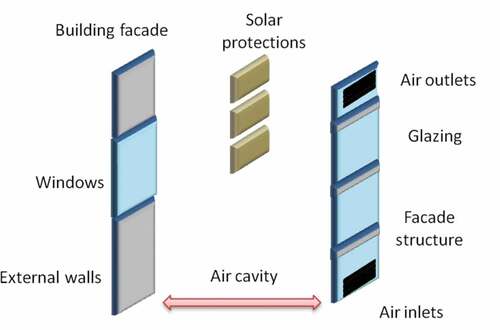
It could be desirable from an architect or engineer point of view, to add a complementary thermal and/or architectural system to the basic building thermal model succinctly described in the last section. In order to illustrate the corresponding implementation methodology, we consider a novel energy system, namely a double skin facade. This energy system can be defined as a traditional façade doubled by the exterior by a second, essentially glazed façade (see Figure ). The appeal of the implementation of such building element is double: (i) during winter, solar heat energy is captured by the cavity between the traditional and the glazed facades, which allows for the creation of a buffer space; this buffer space thus insulates the building from the low temperatures of the exterior environment, (ii) during summer, the heated air inside the cavity leads to a natural air circulation cycle caused by a chimney effect, bringing fresh air to the building façade or interior, through passive means.
Figure 6. Basic components of a double skin facade
4.1. Modeling of the Double skin facade
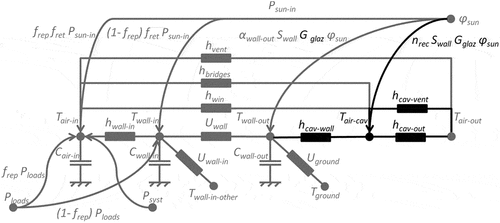
In accordance with the principle of electrical-thermal analogy, in this double skin model, the space created between the building envelope and the glass facade is characterized by an air temperature representative node located inside the cavity (Tair-cav). The temperature characterizing this node is estimated from a simplified formulation of the thermal balance, considering the heat exchange with thermal zones contiguous to the cavity and the outside. The exchange phenomena considered in the modeling of the double skin glass facade are (see Figure ):
conduction, convection and radiation between the air inside the cavity and the outside air, through the glazing which constitutes the facade of the double skin (hcav-out);
conduction, convection and radiation between the air inside the cavity and the air inside the building, through the glazing composing the thermal envelope in contact with this cavity (hwin);
convection and radiation between the air inside the cavity and the outer surface of the opaque walls composing the envelope (hcav-wall);
convection due to the air change outside the cavity, by wind action and by thermal draw (hcav-vent);
exchange between the air inside the cavity and the air inside the thermal zones in contact with it through the thermal bridges of the building envelope (hbridges);
absorption of heat flux due to solar radiation by the air inside the cavity (nrec Swall Gglaz φsun).
The regulatory method for the modeling of sun-tempered buffer spaces has been considered in coherence with the principles of the present work in order to model the Double skin façade (see black added lines and nodes in Figure ), because this method allows a good balance between simplification of calculation and representativeness of the phenomena involved. In order to take into account in a more complete way the impact of the decisions associated with the design of the glazed facade in its thermal behavior, an adaptation to this modeling (Th-BCE 2012 rules, (Centre Scientifique et Technique du Bâtiment, Citation2006)) is proposed in this work with regard to the efficiency of recovery of solar contributions in the cavity . This efficiency is defined as the portion of the solar heat flux remaining in the buffer space relative to the incoming solar heat flux to the cavity. It is usually considered to be constant and equal to 0.8 in the Th-BCE 2012 (0.8); in this work, the value of this output, namely
coefficient (see Figure ), is estimated from the geometric and thermal characteristics of the solar protections and the building envelope, so as to model the influence of these elements in the thermal dynamics of the facade double skin glazed:
Figure 7. Nodal modeling using an electrical-thermal analogy for a thermal zone in contact with the air cavity of a double skin facade
4.2. Addition to the basic default initial configuration
For the design of a double skin facade, the decision values describing the default configuration were obtained from the analysis of a study of 55 projects in office buildings in 10 different countries (Poirazis, Citation2004). These values are shown in Table .
Table 6. Design decision values describing the default initial configuration of the Double skin facade
4.3. Addition to the knowledge database
As shown in Figure , the basic components of a double skin facade are the glazing and the façade structure. Since the glazing types used in double skin facades are practically the same as the ones used in windows, the only component which is not documented in the knowledge database of the base decision-support tool is the façade structure. The environmental, economic and technical characteristics of a metallic structure for such purposes have been added to the knowledge database.
5. Qualification of the decision-support tool
Decision-making for the design of energy-efficient buildings requires a global vision, which integrates, in parallel, the functions of the system (physical comfort of the occupants) and the constraints (environmental costs and impacts). The currently available methodologies and tools that consider these three aspects of building performance are not suitable for design in the early stages of a construction project. It is nevertheless in these first stages of reflection that the most decisive decisions in terms of energy performance are taken. For this reason, the novelty of the proposed method is to support decision-making in a building energy design process by integrating both: the logic of knowledge progression, the social, economic and environmental dimensions of sustainable development. In order to show the interest of the application of the proposed decision-support tool in the design of an office building, a design scenario composed of 3 progressive decisions allocated along the early design stages is further presented. The positioning of these design decisions in the progressive decision-making model is shown in Figure .
Figure 8. Positioning of the design scenario for the Double skin facade according to the proposed progressive decision-making model
In the following three sub-sections, the results, in terms of performance indicator values, are given as the variation in percentage of each performance indicator (see Table ) for a given building configuration () compared to the considered default configuration (
).
5.1. First decision: building orientation
In the schematic design phase, one of the first decisions is to choose the building orientation, relative to the South (for the northern hemisphere) or to the North (for the southern hemisphere). This simple design choice plays a decisive role in the energy performance of the building, particularly in the distribution of incident solar contributions on the building façades (Liébard & De Herde, Citation2005).
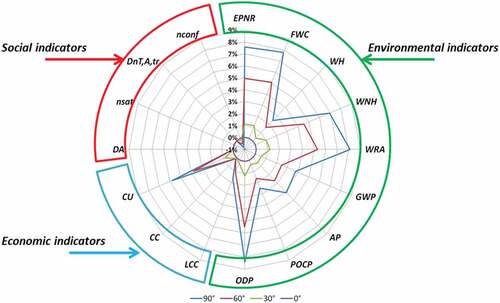
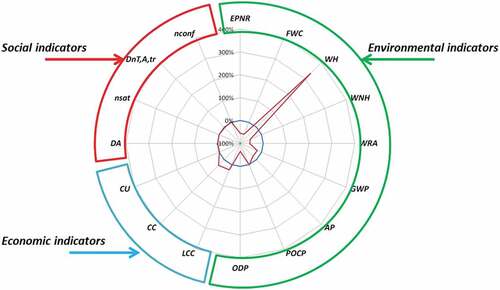
Figure shows the variation of performance indicators of the initial default building by varying its orientation from the South: 0° (South orientation), 30°, 60° and 90° (East orientation). Results of the variations of performance indicators versus building orientation towards the West (–30°, –60°,– 90°) are not presented because they are similar to results versus building orientation towards the East (30°, 60°, 90°), for reasons of symmetry.
One can note that the energy performances of the building, and thus the operating cost of this building, are significantly impacted for orientation variation values (from South) less or equal than 30°. These variations did not affect the cost of the construction and thus of the investments.
In the same way, beyond this zone, a significant increase in the majority of environmental can be observed:
non-renewable primary energy use
•freshwater consumption
non-hazardous solid waste
radioactive solid waste
depletion potential of stratospheric ozone layer
Other indicators are also affected by the variation of this design variable, but to a lesser degree:
hazardous solid waste
Global warming potential
Acidification potential of land and water
Formation potential of tropospheric ozone
•Life-cycle cost
Two indicators present a minimum degree of sensitivity with respect to the variation of the azimuth: the construction cost and the percentage of time of thermal comfort (this last performance indicator being slightly enhanced). Finally, one can point out that the rest of the user comfort indicators (visual, acoustic and air quality) are not affected by the building orientation.
Figure 9. Variation of performance indicators for all building orientations from a south orientation
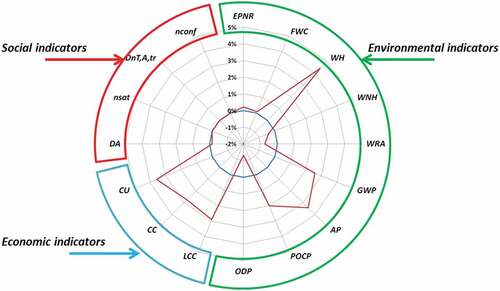
5.2. Second decision: implementation of the DSF
Figure illustrates the variation of performance indicators with the implementation of a double skin facade configuration compared to the default-building configuration. As shown in this figure, the presence of the double-glazed facade has two different effects on the energy performance of the building. As expected, it reduces the building’s heating needs by approximately 20% compared to the basic building configuration; this involves a decrease in the environmental indicators associated with the consumption of electrical energy. At this stage, an analysis in terms of time of ROI (Return On Investment) should be done to support the environmental decision-making. Nevertheless, the large-scale use of glazing and the supporting metal structure that constitute this double skin facade, both components that are associated with high environmental impacts and high costs, have very negative effects on the building’s performance; the most negatively affected indicators are of course the environmental indicator “hazardous solid waste” because of the use of glassing and metal structure, and the three economic indicators, due to the increase in construction materials needs for building.
Figure 10. Variation of performance indicators with the implementation of the double skin facade configuration (red line) compared to the default building configuration without double skin facade (blue line)
5.3. Third decision: type of double skin façade glazing
The third design decision concerns the type of glazing composing the double skin facade. Two types of glazing are proposed in the knowledge database for “Thermal mass” stage of the schematic design phase (see Figure ):
single glazing unit with 6 mm thick clear glass (default building configuration),
double glazing which consists of two sheets of glass 4 mm thick, separated by a space filled with 16 mm of air.
Figure 11. Variation of performance indicators between a double skin facade using single glazing as default configuration (blue line) and another using double glazing (red line)
Results presented in Figure1 concern the comparative impact of this default single glazing and of the double glazing for the double skin façade. It points out that some of the environmental indicators are better for a facade with a single glazing, while others are better results for a facade with double glazing. To understand these indicator behaviors, two different effects have to be considered: indeed, a double glazing allows the reduction of the thermal needs, because of the increase of the thermal performance of the envelope; nevertheless, the implementation of such a type of glazing induces larger environmental impacts and larger investments. Thus, the choice of double glazing leads to reduce the indicators that are more sensitive to the energy consumption of thermal systems, while the choice of single glazing limits those that are more sensitive to the use of building materials.
6. Conclusion
In this work, a progressive decision-support methodology for the energy design of buildings during the early stages has been developed. This methodology provides a quantitative assessment of the impact of technological-related and material-related decisions on the overall building performance, characterized by a set of indicators covering the three dimensions of sustainability and considering the whole building life cycle. The three dimensions concern environmental criteria, comfort criteria and three economic costs and are evaluated by the way of dedicated performance indicators. The selected performance indicators and their calculation algorithms are compatible with the limited level of building detailed information available during the early design stages. Their calculations are based on standard technical databases and on improved energy performance models. Through the case studies presented here, the use of the evaluation tool helped to guide decision-making by offering a global vision of the energy performance of the building. This global vision makes it possible to fully consider the effects of design decisions taking place in different stages of the building’s life cycle. An energy strategy may be attractive because it has positive effects on the building’s performance during operation; however, the implementation can bring negative effects that can mitigate these gains, or even cancel them completely. Consideration of the effects of design decisions on the entire building life cycle and on the set of performance criteria is thus necessary to respond to these types of situations. The proposed progressive decision-making model will lead in the future to a complete decision-support tool for the energy design of buildings throughout the early design stages, considering the three dimensions of sustainability (Velázquez, Citation2015).
Nomenclature
| = | Discount rate (-) | |
| AP | = | Acidification potential of land and water (kg SO2-eq./(m2 year)) |
| Cc | = | Construction cost (€/m2) |
| Cu | = | Operating cost (€/m2) |
| DA | = | Daylight autonomy (% occupation time) |
| = | Weighted standardized level difference (dB) | |
| EPNR | = | Non-renewable primary energy use (kWh/(m2 year)) |
| = | Factor (-) | |
| FWC | = | Fresh water consumption (L/(m2 year)) |
| GWP | = | Global warming potential (kg CO2-eq/(m2 year)) |
| = | Heat exchange coefficient (W m−2 K−1) | |
| = | Environmental impacts vector per functional unit of building flow (-/unit) | |
| = | Environmental impacts vector of building flow (-) | |
| LCC | = | Life cycle cost (€/m2) |
| nconf | = | Percentage of time of thermal comfort (% occupation time) |
| = | Expected percentage satisfied (% user) | |
| ODP | = | Depletion potential of stratospheric ozone layer (kg CFC 11-eq./(m2 year)) |
| = | Power contribution (W) | |
| POCP | = | Formation potential of tropospheric ozone (kg C4H4-eq./(m2 year)) |
| = | Air change rate per occupant (m3/occupant) | |
| = | Amount of functional units of building flow (units) | |
| = | Thermal resistance (K W−1) | |
| = | Reduction index (dB) | |
| = | Surface area (m2) | |
| = | Time (years) | |
| = | Temperature (K) | |
| = | Heat transfer coefficient (W m−2 K−1) | |
| = | Volume (m3) | |
| WH | = | Hazardous solid waste (kg/(m2.year)) |
| WNH | = | Non-hazardous solid waste (kg/(m2.year)) |
| WRA | = | Radioactive solid waste (kg/(m2.year)) |
| Greek symbols | = | |
| = | Solar attenuation coefficient (-) | |
| = | Heat flux density (W m−2) | |
| Subscripts | = | |
| = | Air | |
| = | Thermal bridges of the thermal zone envelope | |
| = | Air cavity of the Double skin facade | |
| = | Building flow (building component, energy resource) | |
| = | Glazing of the Double skin facade | |
| = | Ground below the building | |
| = | Inner side of the thermal zone envelope or inside the thermal zone | |
| = | Thermal loads of the thermal zone | |
| = | Operative | |
| = | Other thermal zones of the building | |
| = | Outer side of the envelope or outside the thermal zone | |
| rec | = | Recuperation of heat gains in the air cavity of the double skin facade |
| = | Repartition of heat gains between the indoor air and the walls | |
| = | Retention of heat gains in the thermal zone | |
| = | Thermal zone | |
| = | Structural material of walls | |
| = | Solar heat gain | |
| = | Technical systems (heating, cooling) | |
| = | Thermal insulation | |
| = | Ventilation | |
| = | Walls of the thermal zone envelope | |
| = | Windows of the thermal envelope |
HIGHLIGHTS
A progressive decision-support methodology for the energy design of buildings.
Assessing building performance considering the three dimensions of sustainability.
16 performance indicators covering environmental impacts, cost and user comfort.
36 key design variables used to describe the building in the early design stages.
Performance assessment compatible with information detail in early stages.
Acknowledgements
The main author would like to thank the Mexican National Council for Science and Technology (CONACyT) for its financial support. The third author would like to thank Erasmus+ program with Morocco for its financial support. Special thanks to team in Nobatek-INEF4, a French national center of excellence in research and innovation in the sustainable construction sector, for its valuable support.
Additional information
Funding
Notes on contributors
Ernesto Velázquez
Ernesto Velázquez is Head Project in environment at Elioth Company. PhD in energetic building design since 2015, his research interest is sustainable buildings.
Denis Bruneau
Denis Bruneau is Full Professor at the Higher National School of Architecture and Landscape of Bordeaux (ENSAP-Bx). He is in charge of GRECCAU lab (Research Group in Ambiances&Comfort and Design in Urban Architecture and Urban Environment). He develops researches in sustainable buildings and thermal engineering.
Zakaria Aketouane
Zakaria Aketouane is Post-Doc researcher at Bordeaux University. PhD in energetics since 2019 from Mohammed V University in Rabat (Morocco), he now develops researches in sustainable buildings and thermal engineering in Bordeaux Institute of Mechanical Engineering (I2M – UMR 5295, a CNRS research laboratory in Bordeaux).
Jean-Pierre Nadeau
Jean-Pierre Nadeau was, until 2018, Full Professor at Ecole Nationale Supérieure d’Arts et Métiers (ENSAM) in Bordeaux, France. He created in 2011 the Mechanical Engineering and Design department of Bordeaux Institute of Mechanical Engineering.
Related Research Data
References
- Agency, International Energy. 2003. Task 23: Optimization of solar energy use in large buildings, integrated design process: A guideline for sustainable and solar-optimised building design.
- American Society of Heating, Refrigerating and Air-conditioning Engineers. (2004). ANSI/ASHRAE standard 55–2004: Thermal environmental conditions for human occupancy.
- Attia, S., Gratia, E., De Herde, A., & Hensen, J. L. (2012). Simulation-based decision support tool for early stages of zero-energy building design. Energy and Buildings, 49(June), 2–22. doi:10.1016/J.ENBUILD.2012.01.028
- Baek, C., Park, S.-H., Suzuki, M., & Lee, S.-H. (2013). Life cycle carbon dioxide assessment tool for buildings in the schematic design phase. Energy and Buildings, 61(June), 275–287. doi:10.1016/J.ENBUILD.2013.01.025
- Caccavelli, D, Roux, J. J, & Brau, J. (1987). Modélisation simplifiée du comportement thermique d’un bâtiment multizone : Prise en compte des phénomènes de ventilation. Revue Générale De Thermique, 31, 585–596.
- Centre Scientifique et Technique du Bâtiment. (2006). Règles Th-CE – Calcul de La Consommation d’énergie et de La Température Atteinte En Été. Réglementation Thermique 2005.
- Collectif Effinergie. (2014). Observatoire BBC : L’observatoire des bâtiments basse consommation. Retrieved from http://observatoirebbc.org/
- D’Amico, B., & Pomponi, F. (2018). Accuracy and reliability: A computational tool to minimise steel mass and carbon emissions at early-stage structural design. Energy and Buildings, 168, 236–250. doi:10.1016/j.enbuild.2018.03.031
- Eichhammer, W., Fleiter, T., Schlomann, B., Faberi, S., Fioretto, M., Piccioni, N., … Resch, G. 2009, March. Study on the energy savings potentials in EU member states, candidate countries and EEA countries final report for the european commission directorate-general energy and transport. Technology, 337. https://ec.europa.eu/energy/sites/ener/files/documents/2009_03_15_esd_efficiency_potentials_final_report.pdf.
- European Commission. 2013. Report from the commission to the European parliament and the council –progress by member states towards nearly zero-energy buildings, Brussels. Retrieved from https://eur-lex.europa.eu/legal-content/EN/TXT/PDF/?uri=CELEX:52013DC0483R(01)&from=EN.
- European Committee for Standardization. (2007). NF EN 15251: Indoor environmental input parameters for design and assessment of energy performance of buildings addressing indoor air quality, thermal environment, lighting and acoustics.
- European Committee for Standardization. (2010). EN 15643–1: Sustainability of construction works - sustainability assessment of buildings - Part 1: General framework.
- European Committee for Standardization. (2011). EN 15643–2: Sustainability of construction works - assessment of buildings - Part 2: Framework for the assessment of environmental performance.
- European Committee for Standardization. (2012a). EN 15643–3: Sustainability of construction works - assessment of buildings - Part 3: Framework for the assessment of social performance.
- European Committee for Standardization. (2012b). EN 15643–4: Sustainability of construction works - assessment of buildings - Part 4: Framework for the assessment of economic performance.
- Gan, V. J. L., Deng, M., Tse, K. T., Chan, C. M., Lo, I. M. C., & Cheng, J. C. P. (2018). Holistic BIM framework for sustainable low carbon design of high-rise buildings. Journal of Cleaner Production, 195, 1091–1104. doi:10.1016/j.jclepro.2018.05.272
- Gervásio, H., Santos, P., Martins, R., & Simões da Silva, L. (2014). A macro-component approach for the assessment of building sustainability in early stages of design. Building and Environment, 73(March), 256–270. doi:10.1016/J.BUILDENV.2013.12.015
- Hakkinnen, T. (2012). Sustainability and performance assessment and benchmarking of a building – final report.
- Hamdy, M., Hasan, A., & Siren, K. (2013). A multi-stage optimization method for cost-optimal and nearly-zero-energy building solutions in line with the EPBD-recast 2010. Energy and Buildings, 56(January), 189–203. doi:10.1016/J.ENBUILD.2012.08.023
- HOUSE, OPEN. (2012). Qualitel « habitat & environnement » : Certifications Habitat Neuf - Référentiel Millésime 2012.
- International Organization for Standardization. (2008). ISO 15686–5: Buildings and constructed assets - service-life planning - Part 5: Life-cycle costing.
- Journal officiel de la République française (JORF). (1994). Décret n°93-1268 du 29 novembre 1993 relatif aux missions de maîtrise d’œuvre confiées par des maîtres d’ouvrage publics à des prestataires de droit privé. NOR : EQUU9301161D. JORF du 1er décembre 1993.
- LEBERT, A., Lasvaux, S., GRANNEC, F., NIBEL, S., ACHIM, F., & SCHIOPU., N. (2013). Capitalisation Des Résultats de l ’ Expérimentation HQE performance. Analyse Statistique Action, 22, 1–235.
- Liébard, A., & De Herde, A. (2005). Traité d’Architecture et d’Urbanisme Bioclimatiques : Concevoir, Édifier et Aménager Avec Le Développement Durable. Observ’ER. Observatoire des énergies renouvelables.
- Meex, E., Hollberg, A., Knapen, E., Hildebrand, L., & Verbeeck, G. (2018a). Requirements for applying LCA-based environmental impact assessment tools in the early stages of building design. Building and Environment, 133, 228–236. doi:10.1016/j.buildenv.2018.02.016
- Meex, E., Hollberg, A., Knapen, E., Hildebrand, L., & Verbeeck, G. (2018b). Requirements for applying LCA-based environmental impact assessment tools in the early stages of building design. Building and Environment, 133(January), 228–236. doi:10.1016/j.buildenv.2018.02.016
- Moghtadernejad, S., Chouinard, L. E., & Saeed Mirza, M. (2018). Multi-criteria decision-making methods for preliminary design of sustainable facades. Journal of Building Engineering, 19(May), 181–190. doi:10.1016/j.jobe.2018.05.006
- Nault, E., Waibel, C., Carmeliet, J., & Andersen, M. (2018, March). Development and test application of the UrbanSOLve decision-support prototype for early-stage neighborhood design. Building and Environment, 137, 58–72. doi:10.1016/j.buildenv.2018.03.033
- Ochoa, C. E., & Capeluto, I. G. (2009). Advice tool for early design stages of intelligent facades based on energy and visual comfort approach. Energy and Buildings, 41(5), 480–488. doi:10.1016/J.ENBUILD.2008.11.015
- OPEN HOUSE. 2013. Benchmarking and mainstreaming building sustainability in the EU based on transparency and openness (open source and availability) from model to implementation. Retrieved from https://cordis.europa.eu/project/rcn/93875/factsheet/en.
- Poirazis, H. (2004). Double skin façades for office buildings. Holland: Lund Institute of Technology.
- Roux, J. J. (1984). Proposition de Modèles Simplifiés Pour l’étude Du Comportement Thermique Des Bâtiments. Institut National des Sciences Appliquées de Lyon (Thesis).
- Université catholique de Louvain. 2014. Energie+, Architecture et Climat. Retrieved from http://www.energieplus-lesite.be.
- Velázquez, E. (2015). Processus de Conception Énergétique de Bâtiments Durables. Arts et Métiers ParisTech (Thesis). https://pastel.archives-ouvertes.fr/tel-01314137/document
- Wang, W., Zmeureanu, R., & Rivard, H. (2005). Applying multi-objective genetic algorithms in green building design optimization. Building and Environment, 40(11), 1512–1525. doi:10.1016/J.BUILDENV.2004.11.017