
Abstract
Blindness happens from the visual impairments of a person either naturally or accidentally. Usually, blind people used to move along with a white cane. Visually impaired people completely depend on it where they move with the cane in front of them to check obstacle during their mobilization. However, one of the most common problems found these people usually fall or drop off in the front hole or drain. Moreover, blindness makes people veering during their movement thus they could not detect the narrow hole or drain beside them which results in they simply turn to the hole and fall down. In this case, the white cane is unable to detect the side hole. In this paper, we are designed and fabricated a novel concept of a walking stick for blind people which able to detect hole to avoid falling in the hole. A laser sensor is attached with the blind stick and continuously detects the hole which we calibrated through a set of experimentations. Other two sensors are attached with the cane are also used to detect the front obstacle. Finally, the experiments are conducted to verify the function of the blind stick prototype. The proposed walking stick prototype is able to classify the height of obstacles and detect the front hole will be very helpful to the blind user.
PUBLIC INTEREST STATEMENT
The common scenario of blind people is that they can not detect front hole properly using the traditional white cane and the certain drop-off happened by falling in the hole. There is another worse feature was found is left or right veering which also causes fall-off. The only way is to avoid them from this situation by developing a sensory system which is at least warn them about the front hole. In this research, we have developed and tested an assistive wearable sensory system for the blind people which is capable to detect the front hole and able to warn the blind people about the hole. By doing this feature, the system will help the blind people by avoiding falling in the hole.
1. Introduction
The white cane started in Europe in 1921 when James Biggs, a photographer who had lost his vision, started to paint his white cane to make himself visible to others (Lions Club International, Citation2010). At the point when retired soldiers re-entered to America from World War II with vision impairment, they wanted to take care of themselves. Because of that, the white cane was modified into an extended stick (Strong, Citation2009). Currently, in the world’s scale, there is 82% of visually impaired that is at age 50 or above. In addition, about 90% there is visually disabled because of the lack of human services and treatment (World Health Organization, Citation2013). Therefore, researchers have studied this problem and started to develop a technology that can help the visually impaired. Rey, Hertzog, Kagami, and Nedel, (Citation2015) have designed a wearable device for the blind by using an ultrasonic sensor and vibration motor (Rey et al., Citation2015). Instead of using the walking stick they have used a cap as a wearable device. Because, they want to allow the user to walk without restraining their mobility.
Aymaz and Çavdar, (Citation2016) have designed a system that implemented on the headset for visually impaired (Aymaz & Çavdar, Citation2016). They have used an ultrasonic sensor, Bluetooth module (ISD2590), solar panel and speaker. The result is the headset could identify the location of an obstacle because of the feedback provided. There is no available hole detection blind device found from current literature. A framework was proposed to give question recognition and continuous help to the user in light of a GPS, an ultrasonic sensor, and a vibration engine (Ramadhan, Citation2018). The researchers meant to build up an electronic flying out guide to help clients keeping away from hindrances while strolling. The framework is appended to the white stick, and at whatever point it identifies a question adjacent, it triggers a vibration caution. Besides, the framework permits following the client area utilizing GSM and GPS. Voice acknowledged, and GPS featured application was introduced for safe route of blind users (Bansode, Jadhav, & Kashyap, Citation2015). The client conveys a voice guideline, and the framework recovers course direction through sound signs while always observing the area utilizing a GPS recipient. What’s more, protest identification permits to keep away from deterrents, additionally by conveying sound messages. José et al. (Nakajima & Haruyam, Citation2012; José, Farrajota, Rodrigues, & Du Buf, Citation2011) built up a wearable framework with a board containing an assortment of an area and tracking advancements, for example, pedometer, a GPS, RFID labels, an electronic compass, and RF sensors. The framework melds the data from the sensors to enhance the estimation of the client area and introduction. The innovative prototype built in this research that offers the capabilities to move blind people move autonomously and recognize multiple objects in public indoor environments (Mekhalfi et al., Citation2016). As the systems embedded many sensors to make the system more intelligent, therefore, it requires more energy to run. However, very lightweight, low cost, and low energy required blind can system was built to help blind people (Nada, Fakhr, & Seddik, Citation2015; Wachaja et al., Citation2017). A system was built aims to make interaction between blind and device to help blind through IoT (Castillo-Cara et al., Citation2016; Lefeuvre et al., Citation2016; Ramadhan, Citation2018). Hence, people on the other side can trace their location. This communication device usually very important for this group of people.
Therefore, this research aims to build a novel prototype of the blind walking stick which will be able to detect the hole to avoid the front hole.
2. Design of the walking stick
Figure shows the design of a walking stick prototype. The stick length is 86.5 cm long. Two ultrasonic sensors will be placed in lower and upper part of a walking stick. The lower part of the ultrasonic sensor is placed 17 cm higher starting below the stick and configure it as low obstacles sensor. The low obstacle sensor will only detect low obstacles. Meanwhile, the upper part of the ultrasonic sensor is placed 44.3 cm higher from the low obstacles sensor and configure it as high obstacles sensor. The laser ranging sensor will be placed below the low obstacle’s sensor. This is because to avoid signal interference from other sensors. Besides that, the laser ranging sensor is placed 15.2 cm starting below the stick and configured to detect the front hole. The laser ranging sensor is placed 15.2 cm higher because the higher the placement of the laser ranging sensor, the further the distance to detect a front hole. Other than that, the laser ranging is tilt down for a 30° based on the experimental results for detecting the front hole. Two vibration motors will be placed on the handle of the blind stick and cover it up with a cloth. The vibration motor is configured to alert the blind user when detecting an obstacle.
Figure 1. Solid Design with all the hardware components of walking stick
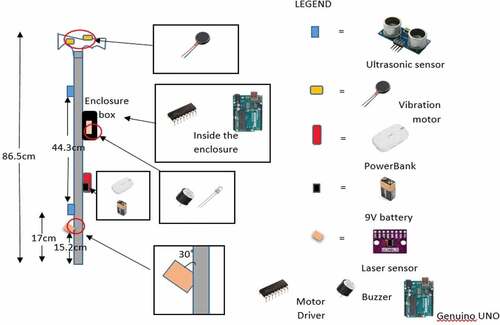
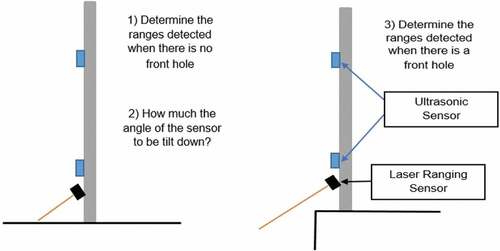
Figure shows the configuration of the laser ranging sensor to detect the front hole. There are three things to do to find the algorithm as shown in Figure .
Figure 2. Laser ranging sensor configuration
3. Walking stick system
3.1. Fabrication of the walking stick
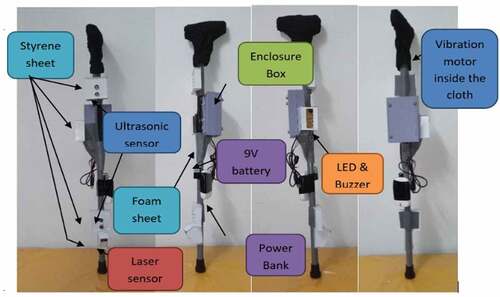
Figure shows a complete fabricated walking stick prototype. The main material used for the blind stick is a PVC pipe because it can be used to store any used wire inside the PVC pipe. Besides that, it is easy to obtain and can be cut in any sizes. Then, for the handle, it is taken from used walking stick and it is cover with a cloth. This is because the cloth is used to cover the vibration motor and italso can give a comfort to the blind user when using it. Next, an enclosure box is used to store the microcontroller and motor driver. This enclosure box is made from plastic, so it is a great insulator to protect the circuit inside. In addition, it has a suitable size to store the microcontroller and motor driver. Next, a styrene sheet is used to create the protection for the sensors, LED and buzzer. This styrene sheet is used because it is made from plastic, so it is also a great insulator and it is low cost material. Finally, a foam sheet is used to cover the excess wire on the walking stick to make it looks neat.
Figure 3. Walking stick prototype
3.2. The block diagram of system
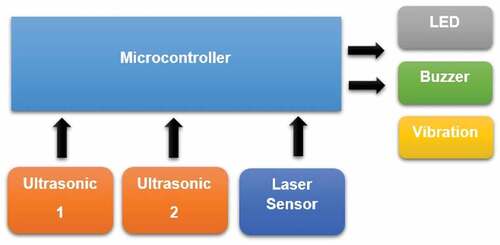
Figure shows the block diagram of the general system. The main core of the system is the microcontroller while the ultrasonic 1, ultrasonic 2, and laser sensor is the input of the system. Then, the output of the system is the LED, buzzer, and vibration. In this project, the system has two ultrasonic sensors and laser sensor which work at the same time to identify an obstacle to guide the user a clear path. This sensor will detect the obstacle and calculate the distance between the obstacle and the user. Besides that, this project will be using the two ultrasonic sensors to differentiate the height of the obstacle. Ultrasonic 1 will be used to detect high obstacle while the ultrasonic 2 will detect low obstacle. Other than that, laser will be used to detect the front hole. After the input is detected, it will be sent to the microcontroller. The microcontroller gets the inputs and processed them. If the input is within the programmed distance range, the microcontroller will send out the instruction to the output. The output is buzzer, vibration and LED will be active as alert to the user.
Figure 4. Block diagram of blind stick system
3.3. Software working algorithm of the system
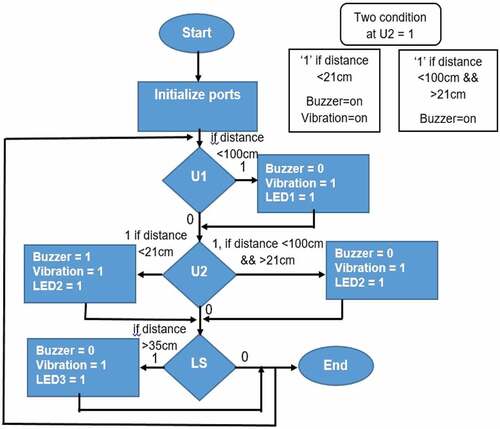
Figure shows the flowchart of the working software, basically how the system integrates and executes. Firstly, it will start the system by initializing the port of input and output. The input is Ultrasonic 1 (U1), Ultrasonic 2 (U2), and Laser sensor (LS) while for the output are the LED1, LED2, LED3, buzzer, and vibration. After initializing the system will detect which ultrasonic sensors and laser sensor has detected an obstacle. If U1 detect an obstacle with a distance of 100 cm, the buzzer will off, LED1 and vibration will turn on. If U1 only detects an obstacle, it means the obstacles are categorized as high obstacle in terms of height. Besides that, if U2 detects an obstacle with a distance of 100 cm, the buzzer will off, LED2 and vibration will turn on. If U2 only detects an obstacle, it means the obstacles are categorized as low obstacle in terms of height but if the detected obstacles getting closer to 20 cm, the LED2, buzzer, and vibration will turn on. The buzzer is only applied to U2 because the user is given a chance to avoid the low obstacles by moving away or step over the obstacle. So, if the user wants to step over, the user needs to move closer to the low obstacles until the buzzer alerts the user to step over. Moreover, if both U1 and U2 detected an obstacle, it means the obstacles are categorized as high obstacle. Then, if LS detects a distance of 350 mm then a front hole is detected. The buzzer will off, LED3 and vibration will turn on.
Figure 5. Flowchart of the blind stick system
4. Experiments
A set of experiments were conducted to validate the proposed walking stick. The experiment focused on finding the algorithm that is to detect the different height of obstacle and to detect the front hole. Besides that, the result of this experiment will be used to design and fabricate the prototype and verify the function of those two algorithms.
In this experiment, the main focus is ultrasonic sensor and laser ranging sensor because the ultrasonic sensor is used to detect a different height of obstacle while a laser ranging sensor is used to detect an incoming hole. In this experiment, it is divided into two sections that are an ultrasonic sensor and a laser ranging sensor. Ultrasonic sensor will be tested in a few experiments to identify the algorithm to differentiate the height of obstacles while a laser ranging sensor will also be tested to identify the algorithm to detect the front hole.
4.1. Experimental setup for front obstacle detection
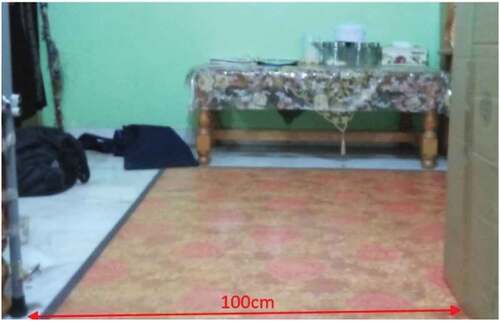
The ultrasonic sensors are configured on the blind stick to test obstacle detection at 100 cm away as shown in Figure . It shows the difference between measured and experiment. Besides that, it is to test the ultrasonic sensor capability and accuracy.
Figure 6. Distance between Obstacle and Ultrasonic sensors 100 cm
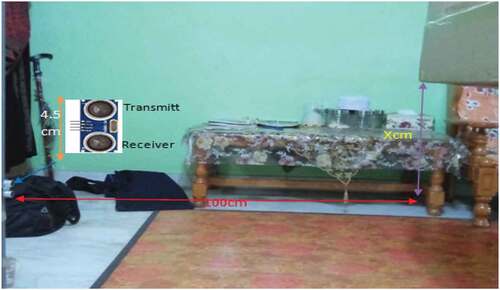
In this experiment, it is required to find the approximate coverage of the ultrasonic sensor. Firstly, it is tested with no obstacles to obtaining a stable result. Then, the ultrasonic sensors are tested on the transmitter side and receiver side as shown in Figure with an obstacle. The result will be recorded when the result is less than the stable result (no obstacle). After that, it will be measured to find out the length of the X cm and Y cm and then it will be sum up and added to the length of ultrasonic sensor (4.5 cm) to obtain the full coverage result at 100 cm away from obstacle detected. Finally, this result can be used to identify the suitable placement between each sensor.
Figure 7. Ultrasonic sensors Transmitter—Receiver
4.2. Experimentation on front obstacle: detection of low and high obstacle
In this experiment, there two ultrasonic sensors will be placed that is on the lower and upper part of the blind stick. The ultrasonic sensor that is placed on the lower part is called as Ultrasonic Low whereas the ultrasonic sensor placed on the upper part is called Ultrasonic High. So, the result obtained from finding the approximate coverage of ultrasonic sensor, the algorithm on the blind stick is configured to make sure the position of the sensor can detect the low obstacle below knee height about 40 cm while for high obstacle detection to detect higher height than that. This is to make sure when the low obstacle detection detected the low obstacle, the user can avoid the obstacle after the buzzer gives the alert to the blind user when the obstacle is near 20 cm. This experiment will be explained more in the next test.
In this experiment, it is tested with five different heights of obstacles and tested within 100 cm away from the blind stick. The result will be recorded to verify the configuration to detect low and high obstacles.
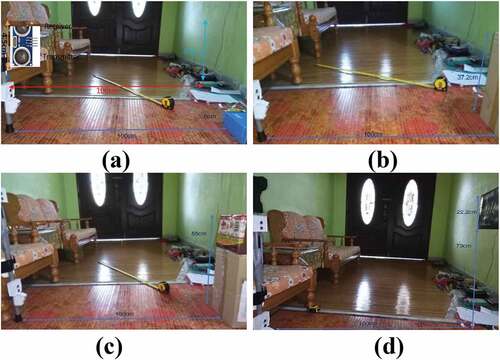
In this trial, it is tested when the blind user gets too near to the low obstacle about 20 cm away. It will give an alert using a buzzer to tell the blind user to avoid the obstacle by stepping over. The obstacles with different height are used to perform the experiments as shown in Figure .
Figure 8. Experiment with different obstacles: (a) Lower height obstacle (b) Low height obstacle (c) Medium height obstacle (d) Higher height obstacle
4.3. Experimentation on hole detection
There are two conditions we considered in this experiment, either there is no front hole or there is a front hole. Besides that, the laser ranging sensor we used to detect the front hole is placed below the Ultrasonic Low sensor and tilt down in a suitable degree. The suitable degree identified through the test.
So, the laser ranging sensor has already been through a few tests, the result is the laser ranging sensor shows a different result between a day and a night. Below is the test to compare it with a night and a day. It will be tested in three locations at night and day in two conditions that is when there is no front hole and has a front hole. Moreover, the laser ranging sensor will be placed in a suitable degree to tilt down.
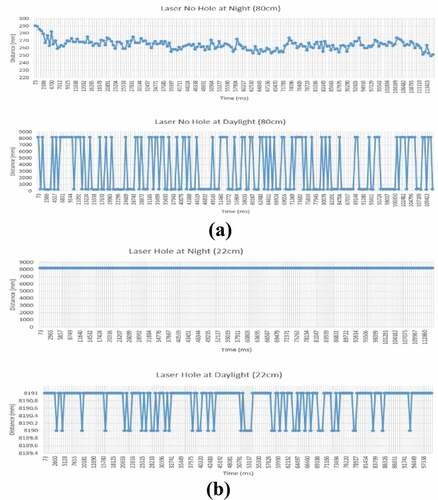
Figure 9. Hole detection experiment at location A: (a) Laser ranging sensor test at night with no front hole (b) Laser ranging sensor test at night with front hole (c) Laser ranging sensor test at daylight with no front hole (d) Laser ranging sensor test at daylight with front hole
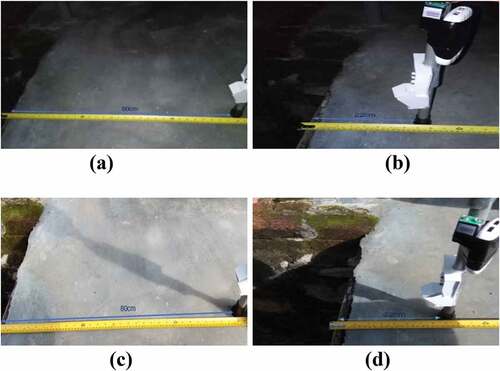
In this experiment, a laser ranging sensor is configured about 30 degrees tilt down along with the stick which was verified after few trials and placed 15.2 cm height below the blind stick as seen in the design in Figure . It is tested in a day and night and also in two conditions that are no front hole and has a front hole. For no front hole, it is tested at 80 cm away from the hole for both night and day to obtain a stable result. Next, for the front hole, it is tested at a distance where the result is increased more than the result from the no front hole. This is because to show it has detected a front hole. The result obtained from this experiment will be used to compare the night and day to identify the differences and to identify the algorithm to detect a front hole.
Figures and 1 show the experiment we performed for hole detection in location B and location C. It is tested using the same method used in location A.
Figure 10. Hole detection experiment at location B: (a) Laser ranging sensor test at night with no front hole (b) Laser ranging sensor test at night with front hole (c) Laser ranging sensor test at daylight with no front hole (d) Laser ranging sensor test at daylight with front hole
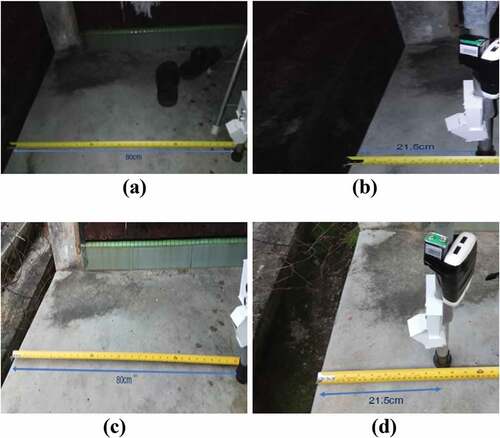
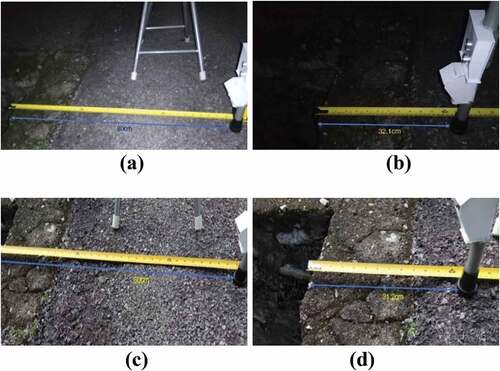
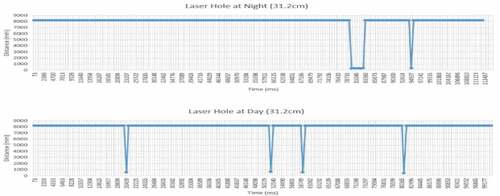
Figure 11. Hole detection experiment at location C: (a) Laser ranging sensor test at night with no front hole (b) Laser ranging sensor test at night with front hole (c) Laser ranging sensor test at daylight with no front hole (d) Laser ranging sensor test at daylight with front hole
5. Experimental results
5.1. Detection of front obstacle
The front obstacle detection experiment was conducted to get about 800 data. In Table , the result shows that the average distance of the obstacle detected is 98.3 cm while the real distance is 100 cm of the obstacle. The error found is −1.7% from the measured value by comparing with the real distance. Therefore, the error is considered in the controller to adjust the measured distance. Thus, the graph at Figure shows a consistent result where it only went to 98cm—100 cm.
Figure 12. Graph of Ultrasonic Sensor at 100 cm
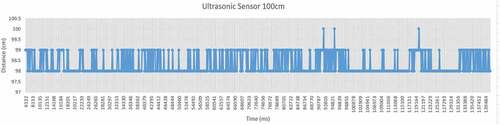
Table 1. Ultrasonic Sensor at 100 cm
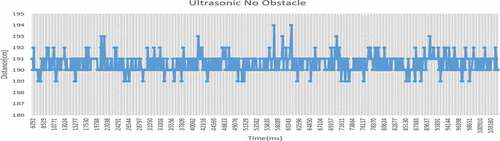
Figure shows the graph of no obstacles detected by the system. In Table , the result shows that the average distance when there is no obstacle detected is 190.55 cm. This result will be used to identify the detection of both sides of the ultrasonic sensors that is receiver side and transmitter side to determine the full coverage of the sensor.
Table 2. Ultrasonic Sensor Coverage I
Figures and 1 show the data collected from receiver and transmitter side. In Table , the result shows that the average distance when there is an obstacle detected at the receiver side is 138.29 cm. This result is recorded because the value has changed then the value when there is no obstacle. It shows the obstacle on the receiver side is detected. In Table , the measurement obtained on the X cm height is about 19 cm.
Table 3. Ultrasonic Sensor Coverage II
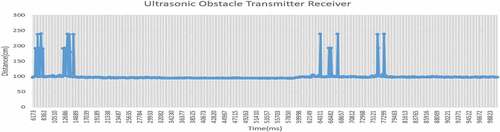
In Table , the result shows that the average distance when there is an obstacle detected at the transmitter side is 100.66 cm. This result is recorded because the value has changed then the value when there is no obstacle. This shows the obstacle on the transmitter side is detected.
Figure 13. Graph of Ultrasonic Sensor with no obstacle
In Table , the measurement obtained on the Y cm height is about 18 cm. Overall, after the X cm and Y cm is obtained, all the values including the height of the ultrasonic sensor will be sum up to obtain the full coverage for one ultrasonic sensor. So, in Table , the result shows the full coverage for the ultrasonic sensor is approximately about 41.5 cm.
Figure 14. Graph of Ultrasonic Sensor at receiver side
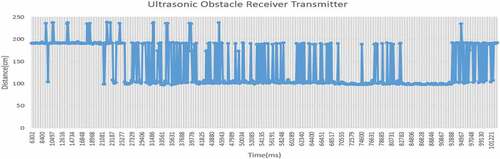
Figure 15. Graph of Ultrasonic Sensor at transmitter side
5.2. Testing the detection of low and high obstacle
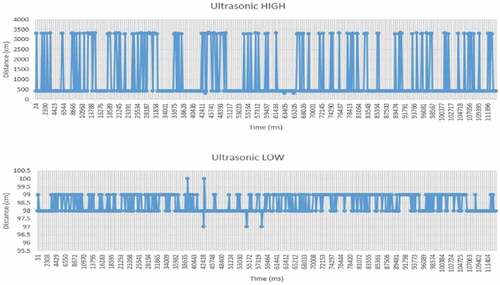
The obstacle height for this experiment is about 8 cm. In Table , the result shows only the Ultrasonic Low sensor detects the obstacle with an average of 100.285 cm while the Ultrasonic High sensor detects an average of 596.632 cm. Besides that, the error also shows there is less error for the Ultrasonic Low sensor about −0.29% while the Ultrasonic High has a higher error about 496.32%. In this experiment, the obstacle is categorized as a low obstacle.
Table 4. Ultrasonic Sensor Low and High Obstacle
The obstacle height for this experiment is about 37.2 cm. Figure shows the experimental results on lower height obstacle. In Table , the result shows only the Ultrasonic Low sensor detects the obstacle with an average of 98.445 cm while the Ultrasonic High sensor detects an average of 1096.39 cm. Besides that, the error also shows there is less error for the Ultrasonic Low sensor that is about −1.56% while the Ultrasonic High has a higher error about 996.39%. In this experiment, the obstacle is categorized as a low obstacle.
Figure 16. Graph of Ultrasonic Sensor for lower height obstacle
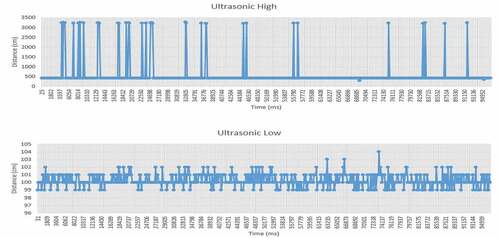
Figure shows the results of low height obstacle for this experiment which is about 55 cm as considered low height obstacle. In Table , the result shows only the Ultrasonic Low sensor detects the obstacle with an average of 98.032 cm while the Ultrasonic High sensor detects an average of 105.88 cm. Besides that, the error also shows there is less error for the Ultrasonic Low sensor that is about −1.97% while the Ultrasonic High has a higher error about 5.88%. In this experiment, the obstacle should be categorized as the low obstacle, but it is already has been determined that if the height of the obstacles is more than 40 cm, it is considered as a high obstacle.
Figure 17. Graph of Ultrasonic Sensor for low height obstacle
For this experiment, the Ultrasonic High sensor detection is only 5.88% error for measuring medium height obstacle as shown in Figure . This is because it has a limitation on the ultrasonic sensor. The ultrasonic sensor emits sonar wave in different angle up about to 30 degrees (Ghidary, Tani, Takamori, & Hattori, Citation1999). So different angles have different distances considered that the obstacles are 100 cm away from the user.
Figure 18. Graph of Ultrasonic Sensor for medium height obstacle at 100 cm
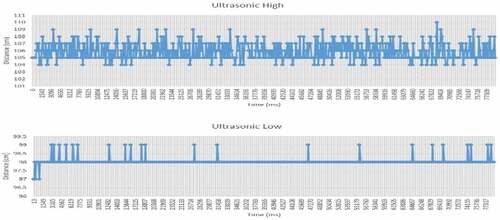
Figure shows the desired distance will not be the same as the measured distance. So, for this experiment, the desired distanced is 100 cm but the measured distance detected for the Ultrasonic High is an average about 105.88 cm. This is proving that different angles have different distances. For the next experiment, the medium height obstacle will be brought closer until both sensors detected the obstacle with an average about 100 cm.
Figure 19. Sonar wave of the ultrasonic sensor [24]
![Figure 19. Sonar wave of the ultrasonic sensor [24]](/cms/asset/7a639342-0f0d-4b85-a558-2ce774b73286/oaen_a_1692468_f0019_oc.jpg)
The experimental result is shown in Figure is for medium height obstacle. The obstacle height for this experiment is the same as before that is about 55 cm. In Table , the result shows both ultrasonic sensors detect the obstacle. The Ultrasonic Low sensor detects the obstacle with an average of 89.858 cm while the Ultrasonic High sensor detects an average of 98.388 cm. Besides that, the error also shows the Ultrasonic Low sensor is about −3.17% while the Ultrasonic High has a higher error about 6.02%.
Although the error is about the same as before, this is only to experiment the distance when both sensors detect the obstacle. So, for this experiment, the medium height obstacle is detected when the distance is 92.8 cm away from the blind stick and the obstacles are categorized as the high obstacle.
Figure 20. Graph of Ultrasonic Sensor for medium height obstacle at 92.8 cm
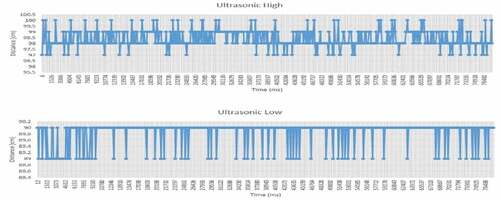
The obstacle height for this experiment is about 88 cm is considering high height. In Table , the result extracted from Figure shows both ultrasonic sensors detect the obstacle. The Ultrasonic Low sensor detects the obstacle with an average of 96.497 cm while the Ultrasonic High sensor detects an average of 99.785 cm. Besides that, the error also shows the Ultrasonic Low sensor is about −3.50% while the Ultrasonic High has a higher error about −0.22%. In this experiment, the obstacle is categorized as a high obstacle.
Figure 21. Graph of Ultrasonic Sensor for high height obstacle
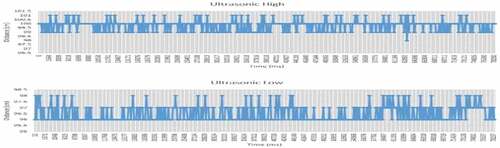
The obstacle height for this experiment is about 22.2 cm but it is placed 73 cm higher from the ground. This experiment is to identify the limit of Ultrasonic High sensor detection for high obstacles. In Table , the result shows the Ultrasonic High sensor detects the obstacle with an average of 173.838 cm while the Ultrasonic Low sensor detects an average of 178.41 cm. Besides that, the error also shows the Ultrasonic High sensor is about 73.84% while the Ultrasonic Low has an error about 78.41%. Even though the result for Ultrasonic High sensor has high average and error but in the graph in Figure for Ultrasonic High has already detected 100 cm. Figure shows the detection of a high obstacle. In this experiment, the obstacle is categorized as a high obstacle.
Figure 22. Graph of Ultrasonic Sensor for higher height obstacle
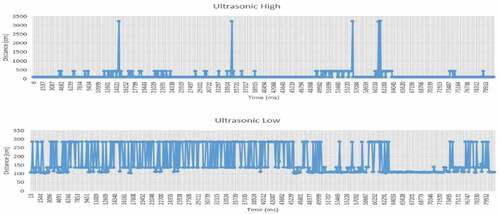
Figure 23. Maximize version of Figure for Ultrasonic High
5.3. Avoiding low obstacle
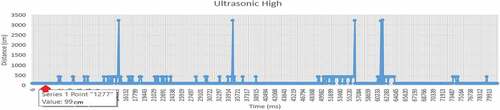
In Table , it is clearly shown the Ultrasonic Low detected the low obstacle while the Ultrasonic High doesn’t show in Figure . The Ultrasonic Low has an average about 20 cm while Ultrasonic High is 737.013 cm. Besides that, the error also shows the Ultrasonic Low is 0% while Ultrasonic High is 3583.07%.
Table 5. Ultrasonic Sensor for avoiding the low obstacles
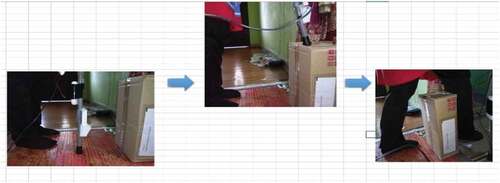
So, when near 20 cm from the low obstacle the buzzer will alert the blind user. So, the blind user needs to follow the procedure in Figure . Firstly, the blind user needs to tap the obstacle to identify its width. Then, if it can step over, then the blind user can proceed to step over the obstacle.
Figure 24. Graph of Ultrasonic Sensor obstacle detected at 20 cm
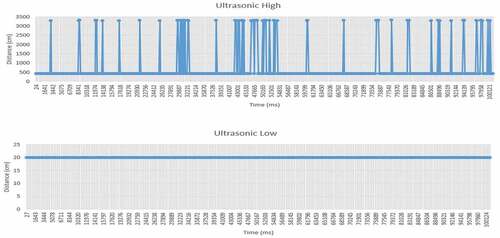
Figure 25. Avoiding obstacles
5.4. Hole detection test at night and daylight
In Table , the result shows for Figure that when there is no front hole for a night, the average distance detected by laser ranging sensor is 248.31 mm while for daylight is 3464.19 mm. This shows there is a different result when tested in a night and daylight. So, for the front hole detection, the result when there is no front hole at night will be used as a reference. The result for front hole detection will be recorded when there is an increase than the result for no front hole detection.
Table 6. Laser ranging sensor test at night and daylight
The result when there is a front hole for the night, the average distance detected is 8191 mm while for the daylight is 8190.78 mm. Besides that, the distance when detected the front hole is about 22 cm.
Figure 26. Graph of Laser Ranging Sensor Test Location A, distance from the hole: (a) 80 cm (b) 22 cm
In Table , the result shows for Figure that when there is no front hole for the night, the average distance detected by laser ranging sensor is 264.2 mm while for daylight is 4398.17 mm. The result for front hole detection will be recorded when there is an increase than the result for no front hole detection.
The result when there is a front hole for the night, the average distance detected is 8072.08 mm while for the daylight is 8037.44 mm. Besides that, the distance when detected the front hole is about 21.5 cm. It is less than the distance detected in Location A when detected the front hole.
Figure 27. Graph of Laser Ranging Sensor Test Location B
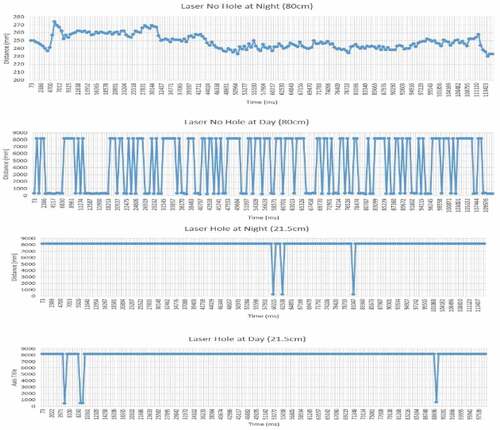
Figure shows the average distance detected is 7908.72 mm when there is a front hole for the night while for the daylight is 8037.62 mm. Besides that, the distance when detected the front hole is about 31.2 cm. It is more than the distance detected in Location A and B when detected the front hole.
Figure 28. Graph of Laser Ranging Sensor Test Location C
6. Discussions
6.1. Front obstacle detection
6.1.1. Testing the coverage of detection of the ultrasonic sensor
The result shows the coverage detection of the ultrasonic sensor is approximately about 41.5 cm. Using this result, it has determined that only two sensors can be used to identify whether it is a high or low obstacle because the length of the blind stick is only 86.5 cm. Besides that, this result can be used as references to identify sensors position on the blind stick. So, the configuration has been set that the Ultrasonic Low where it will be in the lower of the blind stick can detect only low obstacles about 40 cm height while the Ultrasonic High where it will be in the upper of the blind stick can detect high obstacles when the height is higher than 40 cm. In addition, if both sensors detect the obstacles it will consider as detecting high obstacles.
6.1.2. Testing the detection of low and high obstacle
The result shows the configuration of the ultrasonic sensor position for Ultrasonic Low and Ultrasonic High is working properly. It can determine the obstacle height whether it is low or high obstacles. Even though in the experiment there are limitations when detected the medium height obstacle that is about 55 cm height, it is already explained that the ultrasonic sensor emits sonar wave in different angles and has different distances in each angle. It is already being tested when the obstacle brought closer, both sensors detected the obstacle. Overall, the algorithm to differentiate the obstacle height is successful.
6.2. Hole detection
The result shows that there is a different result when testing it on a night and daylight. On a night test with the laser ranging sensor, it is more stable than on daylight. So, a night test result will be as a reference to the daylight especially when recorded a result of the distance (cm) detected a front hole. This limitation occurs because of the sensitivity to the sunlight because this laser ranging sensor also emits light. Finally, to find an algorithm to detect the front hole is unlikely because of the limitation. However, if discarded the daylight function, only using the night function the result obtained can be used to find the algorithm by observing the maximum and minimum value in Table . In Table , the minimum value for the detected front hole at daylight at location B & C is after 400 mm. Besides that, the maximum distance when there is no front hole at night is 323 mm at location C. So, with this, it can conclude that the ranges after 323mm – 400mm, it will detect the front hole. The suitable distance to be chosen is in between of that range. Therefore, the algorithm will be set such as if the distance detected by the laser ranging sensor is more than 350 mm, then the front hole is near.
6.3. Benchmark
Table shows the comparison between four different types of project that are the smart stick, blind guardian, assistive headset and this research, obstacle avoidance stick. As shown in Table , the smart stick has the longest operation time because they have a power capacity that able to supply more to other works. This is because four batteries of size AA can supply their project and they only used fewer components. Besides that, their project only cost about US$50. However, the smart stick has its weakness that the smart stick is unable to differentiate the height of obstacles, detect a front hole, and differentiate whether it is a day or night. The smart stick can detect obstacles with different heights but not differentiate it.
Table 7. Comparison between the review project and this project
The blind guardian has the least operation time because the power capacity used is low until it is enough to supply their project. This is because they only used a 9 V battery. Other than that, the blind guardian cost is only US$40. Besides that, the blind guardian is unable to differentiate the height of obstacles, detect a front hole, and differentiate whether it is a day or night. The blind guardian is only able to detect the front obstacles and gives less restraint in terms of mobility for the blind user. In this work, the power consumption of the developed system is 400 Watts if all the components are in active condition. As the battery capacity is 500mAh. Therefore, in extreme cases, if the system can only operate for 1 h 15 min continuing running with all obstacles.
In this work, obstacle avoidance stick has a decent operation time because the power capacity used is high to supply the component. This project has a lot of components used such as an ultrasonic sensor, laser sensor, motor driver, vibration motor, and LEDs.
7. Conclusions
We have conducted and shown a set of experiments to detect the different height of obstacle and the front hole. The sensor used is the ultrasonic sensor to detect the different height of obstacles and laser ranging sensor to detect the front hole. Besides that, the result from the experiment has verified the algorithm used. The experiments have shown that the prototype is able to differentiate the height of obstacles but there are some obstacles that cannot detect the obstacles as high when at 100 cm away. However, when the obstacles are close, the prototype is able to detect it as high obstacles. This problem happens because of the ultrasonic sensor sonar wave but this is a minor problem to the prototype. Meanwhile, for the laser ranging sensor, it is able to successfully detect hole at night and daytime.
Acknowledgements
Authors would like to thank Universiti Kuala Lumpur British Malaysian Institute (UniKL-BMI) to support this research.
Additional information
Funding
Notes on contributors
Md Masum Billah
Dr. Md Masum Billah received PhD in Engineering (Robotic & Control) from International Islamic University Malaysia (IIUM). He has long experiences in doing research and teaching on robotics and control while he was working as a Postdoctoral Fellow with IIUM and as a visiting Researcher at Emeritus College, University of Missouri-Kansas City (UMKC), USA. He was also involved with the industrial project at Technology Park Engineering Malaysia in developing Rehabilitation Robots. Currently, Dr. Masum is working as a Senior Lecturer at the Electrical Technology department in Universiti Kuala Lumpur (UniKL BMI) where he is teaching Automation & Robotics, and Control System courses. He is also one of the members of Robotic for Rehabilitation (R4R) research cluster at UniKL BMI where is the lead researcher in the area of design and development of assistive, wearable & rehabilitation robotics system and design of control system. This research is one of the outcomes of R4R cluster project in wearable robotics system.
References
- Aymaz, Ş., & Çavdar, T. (2016, June). Ultrasonic assistive headset for visually impaired people. In 39th International Conference on Telecommunications and Signal Processing (TSP) (pp. 388–22). IEEE. doi:10.1142/S2424835516500399
- Bansode, M., Jadhav, S., & Kashyap, A. (2015). Voice recognition and voice navigation for blind using GPS. International Journal of Innovative Research in Electrical, Electronics, Instrumentation and Control Engineering, 3(4), 91–94. doi:10.17148/IJIREEICE.2015.3420
- Castillo-Cara, M., Huaranga-Junco, E., Mondragón-Ruiz, G., Salazar, A., Barbosa, L. O., & Antúnez, E. A. (2016). Ray: Smart indoor/outdoor routes for the blind using Bluetooth 4.0 BLE. Procedia Computer Science, 83, 690–694. doi:10.1016/j.procs.2016.04.153
- Ghidary, S. S., Tani, T., Takamori, T., & Hattori, M. (1999). A new Home Robot Positioning System (HRPS) using IR switched multi ultrasonic sensors. In Systems, Man, and Cybernetics, 1999. IEEE SMC’99 Conference Proceedings. 1999 IEEE International Conference on, Japan (Vol. 4, pp. 737–741). IEEE.
- José, J., Farrajota, M., Rodrigues, J. M., & Du Buf, J. M. H. (2011). The SmartVision local navigation aid for blind and visually impaired persons. International Journal of Digital Content Technology and Its Applications, 5, 362–375. doi:10.4156/jdcta.vol5.issue5.40
- Lefeuvre, K., Totzauer, S., Bischof, A., Kurze, A., Storz, M., Ullmann, L., & Berger, A. (2016, October). Loaded dice: Exploring the design space of connected devices with blind and visually impaired people. In Proceedings of the 9th Nordic Conference on Human-Computer Interaction, New York (p. 31). ACM.
- Lions Club International. (2010, September). White Cane. Retrieved from http://www.lionsclubs.org/EN/common/pdfs/iad413.pdf
- Mekhalfi, M. L., Melgani, F., Zeggada, A., De Natale, F. G., Salem, M. A. M., & Khamis, A. (2016). Recovering the sight to blind people in indoor environments with smart technologies. Expert Systems with Applications, 46, 129–138. doi:10.1016/j.eswa.2015.09.054
- Nada, A. A., Fakhr, M. A., & Seddik, A. F. (2015, July). Assistive infrared sensor based smart stick for blind people. In 2015 Science and Information Conference (SAI), UK (pp. 1149–1154). IEEE.
- Nakajima, M., & Haruyama, S. (2012, August). Indoor navigation system for visually impaired people using visible light communication and compensated geomagnetic sensing. In 2012 1st IEEE International Conference on Communications in China (ICCC) (pp. 524-529). IEEE.
- Ramadhan, A. J. (2018). Wearable smart system for visually impaired people. Sensors, 18(3), 843. doi:10.3390/s18030843
- Rey, M., Hertzog, I., Kagami, N., & Nedel, L. (2015, May). Blind Guardian: A sonar-based solution for avoiding collisions with the real world. In Virtual and Augmented Reality (SVR), 2015 XVII Symposium, Brazil (pp. 237–244). IEEE.
- Sharma, S., Gupta, M., Kumar, A., Tripathi, M., & Gaur, M. S. (2017, January). Multiple distance sensors based smart stick for visually impaired people. In Computing and Communication Workshop and Conference (CCWC), USA. 2017 IEEE 7th Annual (pp. 1–5). IEEE.
- Strong, P. (2009, January 11). The history of the White Cane. Retrieved from http://www.acb.org/tennessee/white_cane_history.html
- Wachaja, A., Agarwal, P., Zink, M., Adame, M. R., Möller, K., & Burgard, W. (2017). Navigating blind people with walking impairments using a smart walker. Autonomous Robots, 41(3), 555–573. doi:10.1007/s10514-016-9595-8
- World Health Organization. (2013, October). Visual Impairment and Blindness. Retrieved from http://www.who.int/mediacentre/factsheets/fs282/en/