
Abstract
In an increasingly competitive environment, the quality of the services offered by organizations is a decisive factor to ensure their success. Most of the time, the service can be defined as a series of activities of an intangible nature, occurring through the interaction between the company and the client, and leading to the ownership of something not associated to a physical product. Therefore, the service quality is related to the management of their processes, and their improvement becomes difficult due to simultaneity between production and customer participation. The identification of the critical requirements for the customer during each interaction and translating them into performance specifications will provide greater control and the identification of potential failures that may occur during service. This study’s objective is to propose a conceptual model for quality diagnosis in service processes. Its methodology was defined in four specific stages: 1. Identify recent publications that address the topic under study; 2. Identify, among these publications, the main approaches suggested by the authors for the quality management of processes in services; 3. Propose a conceptual model for this research, contemplating the identified approaches; 4. Validate the proposed model through a case study at a higher education institution (HEI). Through the application of the four methodology phases, it was possible to identify the critical moments of the HEI service cycle, analyze its failures and identify the improvements to be implemented.
PUBLIC INTEREST STATEMENT
The quality management in services is directly associated with the customer’s satisfaction, demanding excellent management. However, the service involves a series of activities that occurs through the interaction between company and client, whose situation is difficult to measure. This paper presents a model suitable to evaluate this kind of process, focusing in a Higher Education Institution (HEI). After the evaluation in a specific institution, the model showed effective to identify what the student observes throughout the service cycle. The model supports the analysis and identifies the critical moments, including the modes, effects, and causes of the potential failures or problems. Considering these results, the HEI could improve its weak points and promote greater satisfaction of their present and future students.
1. Introduction
Service is a series of activities, in most cases intangible, that occurs through the interaction between the company and the client, whose failure can be considered an offence to the client (Grönroos & Ojasalo, Citation2004). The management focused on quality retains the current customers, attracts new ones, reduces costs and expands the company’s income, improving its corporate image (Varouchas et al., Citation2018; Liu & Xie, Citation2013; Ladhari, Citation2009).
In service provider companies, the customer is the core of the business, demanding. Therefore, the customer-oriented (Seo and Um, Citation2019; Chee & Noorliza, Citation2010; Hoang, Igel, & Laosirihongthong, Citation2010; Huang & Huang, Citation2012; Jayawardhena, Citation2010). Due to the fact that the client satisfaction and the service quality are two correlated factors, there is a need to identify and meet the customers’ needs and desires (Ihtiyar and Ahmad, Citation2012; Durdyev et al., Citation2014; Breja, Banwet, & Iyer, Citation2011; Hoang et al., Citation2010; Huang, Wang, & Xue, Citation2012; Jayawardhena, Citation2010; Liu & Xie, Citation2013; Tse & Tan, Citation2011). The customer’s satisfaction is measured by comparing their expectations with perception after the service concluded.
The observed quality must be constituted by the factors of more significant impact on customer’s satisfaction with services (Khodayari and Khodayari, Citation2011; Hu et al., Citation2009; Geum et al., Citation2011; Esfijani, Citation2018; Breja et al., Citation2011; Gorla, Somers, & Wong, Citation2010) and can be identified by the difference between the evaluation that the potential client makes from all the benefits and costs related to a product or service and the observed alternatives. When assessing the observed service quality, it is possible to identify important factors for the users’ decisions, called key attributes, essential elements that must be classified as determining factors of quality, and used by the client to assess the moment of contact experienced within the organization (Kashif and Cheewakrakokbit, Citation2018; Gera, Citation2011; Šebjan & Bastič, Citation2013).
The literature highlights three reasons why the service provider companies should focus on meeting the needs of their customers. Finkelman (Citation1993) and Johnson, Scholes, and Whittington (Citation2005) report that satisfied customers tend to be loyal. Second, customer satisfaction serves as advertising for the company in acquiring new customers. Finally, Mittal (Citation2001) report that a satisfied customer tends to use the service more often. Customer satisfaction is so important that many organizations establish this satisfaction as the most important in the company’s mission (Rodriguez et al., Citation2018; Fitzsimmons & Fitzsimmons, Citation2008).
In the provision of services, the systematic problem-solving must be employed to assess and eliminate the causes before they occur. For this, the implementation of solutions to decrease this variability and increase the reliability, taking into account the risks, can improve the customer’s satisfaction. It becomes essential to figure out what the customers need, expect and want, and what they observe from the service. The quality assessment between what the company provides and what the customer observes is what directs the form of action to be developed, in order to guarantee the customer’s satisfaction. Some methodologies, such as the SERVQUAL scale (Services Quality), for example, direct the company to identify what the customer expects (desired) and what the company provides (observed). Leonnard (Citation2018) applies the SERVQUAL to Measure Performance Service Quality scale in Private University to satisfactory results. Several authors suggest approaches and models to measure quality in service processes in educational institutions, especially Yousapronpaiboon (Citation2014), Kurt (Citation2018), Sevinc (Citation2018), Teeroovengadum et al. (Citation2019), Almohtaseb et al. (Citation2019), Ali et al. (Citation2018), Bouranta et al. (Citation2019) and Abu Rashed and Mohammad Ali (Citation2019). However, as it can be seen in the literature review, no approach is comprehensive for satisfactory measurement that addresses consumer satisfaction, quality perception, quality determinants, quality indicators and process failure analysis in a integrated manner.
This research proposes a model for the diagnosis of quality in service processes, more specifically, in educational service processes. This model contemplates some of the existing approaches, already acknowledged in the literature. It must objectively determine what is essential to the customer and, besides, analyze the discrepancies between the desired, the acceptable minimum and the observed quality, in order to identify critical processes and analyze potential failures that may occur.
In addition to this introduction, this article has the following structure: Section 2 presents the literature review (bibliometric and systematic) related to the topic; section 3 shows the proposed model, consisting of four phases. An application of the proposed model for a private high education institution, called her of “HEI” is shown in section 4 and, finally, section 5 presents the conclusions.
2. A brief review of literature
In the first stage of the research, a bibliographical survey was conducted together with the content analysis, in articles published in journals from different databases (Science Direct, Scopus, Emerald, Elsevier and Taylor & Francis). In the content analysis of the publications, the term “management in service processes” directed the research refinement, identifying 338 recent publications that addressed the term under study. Table shows the percentage of publications by periodicals and, from a total of 338, 43.5% were published in 2015, 45.9% were published in 2016 and 10.6%, in 2017.
Table 1. Survey of publications with the “Management in Services” topic and its approaches
Next, the main approaches that the authors suggest were identified, prioritizing quality management in service processes. Five approaches were identified: (i) quality and satisfaction; observed quality; (iii) main attributes of quality; (iv) quality measurement; and, finally, (v) failure analysis, presented in Table . This study found that a quality service is strong associated with its customers’ satisfaction. In order to satisfy the customers’ needs, the company must understand the entire service cycle, by mapping the moments of contact with the customers and the determinants used by them to evaluate the quality of services. It is essential to identify what the costumers observe at each moment of contact and translate these determinants factors into questions applied through a questionnaire with a rating scale. Statistical analysis is essential to understand which moments are critical, that means, that the client’s observation about its quality is below the desired level. The study of groupings by similarity or dissimilarities will cause the organization to identify and relate all the service cycle weaknesses. Finally, the analysis of how potential failures are occurring, the effects they can cause on clients as well as their causes, become fundamental for the continuous improvement of organizational processes.
Subsequently, a more specific combination of terms was sought in order to understand what was in the area of performance measurement in educational services, recently published (2018 and 2019). The keywords were “quality performance”, “measurement service” and “processes education” which provided a total of 625 articles in 2018 and 467 articles in 2019. After reading titles and abstracts, it was limited to only 7 articles by 2018 and 6 of 2019, totaling 13 articles with strong adherence to the theme addressed in the last two years (Table ).
Table 2. Survey of publications with the “quality performance measurement service processes education” topic and its approaches
Table shows the five approaches, already mentioned in Tables and , in the analyzed publications. In this table, we can see that the same publication can contemplate more than one approach and that 55% of them specify the “customer’s satisfaction” as a fundamental point for the quality management of the service processes; 38% specify the “observation that the client” has of the service provided to the company; 15% report the importance of the determinant identification that the customer uses to evaluate the service provided, that is, the “determinants of quality”; 6% highlight the importance of “measuring the service quality” through evaluation mechanisms, specific scales and statistical analysis and, finally, 3% emphasize the “identification and analysis of potential failures” that may occur during the service.
Table 3. Identification of the approaches in the analyzed publications
We can observe that none of the publications take these five dimensions into account simultaneously in their model. The article published in the Journal Quality Assurance in Education, although it includes “Approach V—Failure Analyze”, addresses the subject tangentially, considering that Osman and Saputra (Citation2019) and Elahi and Ilyas (Citation2019) investigate the relationship between service quality, program quality, institutional image and student satisfaction in the context of higher education. They examined the direct affiliation between service quality and student satisfaction and realized that there is a deficiency of indirect link between service quality and student satisfaction. However, it was not intended to analyze the faults detected in the system. Then, there arises the perspective and the need to propose a model for the quality diagnosis in service processes that contemplates simultaneously all the approaches mentioned.
3. Proposed model
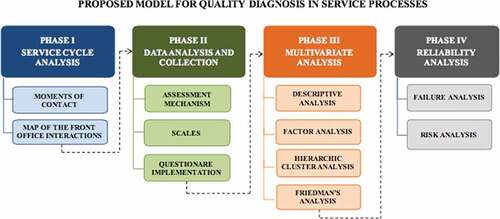
Through the identification of the approaches obtained through the publication analysis, the model presented here, for the quality diagnosis in service processes, proposes four phases with specific objectives and that contemplate the five approaches mentioned in Table .
Phase I is called as “Service Cycle Analysis”. At this phase, the “customer’s satisfaction” approach is prioritized. The intention is that the company identify the processes that involve its entire service cycle and map the interactions between the company and the customer, identifying all the elements of this interaction. In phase II, “Data Analysis and Collection”, the “quality observation” and “quality determinants” approaches are prioritized. The model proposes the elaboration and application of an evaluation mechanism to measure customer satisfaction. Therefore, for each moment of contact, the quality demanded by the customer is identified. The quality determinants that support the demanded quality are identified and translated into questions that, when formulated, can measure what is observed by the customer.
In Phase III, “Multivariate Analysis”, the “quality measurement” approach is prioritized. By applying the questionnaire, this study aims to measure and analyze all variables and information that can be extracted. For this purpose, it proposes to conduct the descriptive and multivariate analyses of the data. Finally, in Phase IV, called as “Reliability Analysis”, the priority is the “failure analysis” in the processes. The aim here is to identify all the critical moments and processes where the customer’s observation is below the acceptable minimum, analyzing the potential failures that may occur or already be occurring, hierarchizing action plans for making decisions through the degree of priority. Figure specifies the model phases with their respective steps, detailed in the subsequent sections.
The desirable requirements in the proposed model are the adequacy and integration of methodologies for the process analysis, that provide the basis to each moment of contact that the client establishes with the organization, measuring its observation, hierarchizing the most important ones, analyzing the variables through groups by similarities and identifying the modes, effects and causes of potential failures that may occur throughout the entire process.
Figure 1. Phases and steps of the proposed conceptual model
3.1. Phase I: analysis of the service cycle
This Phase I aims to identify service processes, by mapping their flow according to the customer’s view, including all his interactions with the company. For the analysis of each moment of contact, there arises a need for mapping the activities above the line of visibility, identifying all customer/company interactions. Steps and objectives are: i) STEP 1—Moments of contact (identify all the moments of contact that the customer has with the organization, from his point of view); ii) STEP2—Map of the front office interactions (identify the customer area operations; identify the front-line area operations; prepare a document of interactions containing additional information for the operations).
3.2. Phase II: data collection
The objective of this Phase II is the elaboration and application of a mechanism that assesses what is observed by the customer in each moment of contact of the service provided, through three specific steps. Step 1 consists of a questionnaire development, which will identify the quality observed during the entire service cycle of the organization. Step 2 deals with the development of scales of assessment, using different methodologies that will be applied simultaneously. Step 3 applies the questionnaire to a sample of customers in order to identify critical moments. Or, in a most formal words, the steps and objectives are: i) STEP1—Assessment mechanism (identify the quality demanded by the customer, for each moment of contact; correlate the demanded quality with the quality determinants; translate the determinants into questions); ii) STEP2—Scales (prepare an assessment scale for the questionnaire, in order to assess the perception, the expectation and the acceptable minimum; prepare a functional and dysfunctional question for each translated determinant, with the purpose of categorization and ranking); iii) STEP3—Questionnaire implementation (calculate the significant sample for the questionnaire implementation; implement the questionnaire).
3.3. Phase III: multivariate analysis
The objective of this phase is to identify the company’s critical points, analyzing the nature and degree of association between the variables, grouping them by similarities or dissimilarities. The Multivariate Analysis detects the presence of redundant questions in the questionnaire, which will be studied through exclusion criteria.
Step 1 aims to describe the variables using the absolute and relative frequencies. The position, central tendency and dispersion measures are used in the description of the indicator items, and one of these measures is the “confidence interval” (C.I.) bootstrap. Step 2 aims to develop cluster analysis through factor analysis. The Kaiser criterion is used to determine the number of factors in the Exploratory Factor Analysis. The Factor Analysis creates indicators that represent each construct (service) and the one-dimensionality of the constructs will be verified here. Step 3 aims at separating and classifying the observed objects into a group, identifying which variables will belong to the same group. Step 4 identifies if it is likely that the different samples of the observed quality and the minimum acceptable for each assessed determinant come from the same population. In a formally way, steps and objectives are: i) STEP1—Descriptive analysis (describe de items of the indicators; calculate confidence intervals in order to prepare inferences); ii) STEP2—Factor analysis (assess the quality of the constructs (services), through reliability and convergent validity analysis; verify reliability through Cronbach’s alpha indicators and composite reliability; assess the use of factor analysis through the Kaiser-Meyer-Olkin suitability—KMO; use hierarchic cluster analysis to identify patterns of similar responses); iii) STEP3—Hierarchic cluster analysis (group the individuals with similar response patterns concerning the indicators; define the number of a grouping of individuals concerning the indicators); iv) STEP4—Friedman’s analysis (determine if there is a statistically significant difference between the observed, minimum acceptable and desired measures).
3.4. Phase IV: reliability analysis
This phase involves two steps; Step 1 aims to identify the causes from failures. Step 2 aims to prioritize and rank the failure modes by calculating the risk priority index on service performance. The Steps and objectives of Phase IV are: i) STEP1—Failure analysis (list the failure modes; identify the failure causes; analyze the failure effects); ii) STEP2—Risk analysis (identify the degree of failure occurrences; identify the degree of failure detection, through its controls and forms; analyze the severity degree of each failure; calculate the priority number of risks for the decision making).
4. Assessment of the proposed model
In order to assess the proposed model, this study conducted its application in a private HEI, located in the city of Curitiba, State of Paraná, Brazil. This institution was chosen due to its suitability for service delivery and for allowing the research application to its students. The data collection was conducted from September 15 to 30, 2016, and the research universe involved the students of the undergraduate courses. Founded in 2002, this HEI has 2,300 students in the morning and evening classes, in five courses (Administration—Bachelor degree; Higher Technological Courses (CST); Production Engineering; Pedagogy—Graduation degree; Social Services—Bachelor degree), divided into 19 classes.
4.1. Phase I application: service cycle analysis
The HEI cycle was elaborated, and the interactions above the visibility line were mapped. For Step 1, this study verified that the HEI has 22 processes or essential “moments of contact” in its service cycle that influence the customer’s observation: the student’s website and portal; the telephone service; its location; parking; access; reception; service system; administration office; canteen; laboratories; bathrooms; library; coordination; board office; classrooms; monitoring; Mathematics leveling; Portuguese leveling; Computer Sciences leveling; university ministry; psycho-pedagogical sector; semipresential classes (DL—Distance Learning). In Step 2, it was identified all operations above the visibility line of each moment of contact. The study found that the first phase of the conceptual model provides the view that the student has of the service cycle, which he experiences and uses to measure quality and satisfaction.
4.2. Phase II application: data collection and analysis
Phase II aims to develop and apply a questionnaire for the HEI students. In Step 1, for each moment of contact, the study identified the quality demanded by the students, that is, the requirements that they use to assess the service and that influence their satisfaction. Secondly, the quality determinants proposed by Gianesi & Correa, Citation2009), which are the HEI service requirements and support these students’ demand, were related. Figure presents a chart that identifies the determinants for each moment of contact analyzed.
Figure 2. Chart with 22 moments of contact (services; constructs) versus 9 determinants: 1-Access; 2-Speed; 3-Ambience; 4-Competence; 5-Consistency; 6-Flexibility; 7-Reliability; 8-Tangibility; 9-Cost
Figure presents a chart 2 with the scales used. Based on this chart, the study developed the questionnaire (Appendix ), which contemplates 22 moments of contact, totaling 90 questions resulting from the determinant translations. For each determinant, one or more questions were formulated, in order to assess the level of the student’s satisfaction. The first three scales of evaluation shown in chart follow a nine-point Likert scale and can be evaluated with the average numbers.
The last Kano scale, with the functional and dysfunctional question, is shown below, to rank each translated determinant. This five-point scale aims to establish criteria for the functional and dysfunctional question of the questionnaire. The questions are: i) functional question: How do you feel in the service of this item? (I like in this way; I hope it will be this way; I stay neutral; I can accept it this way; I do not like it this way); ii) Dysfunctional question: How do you feel when this item is not provided? (I like in this way; I hope it will be this way; I stay neutral; I can accept it this way; I do not like it this way).
Figure 3. Chart with scales of the assessment mechanism (a nine-point Likert scale)
The questionnaire was applied to identify students’ satisfaction in each of the 22 moments of contact (services) and each of the nine translated determinants. The sample size was defined according to the statistical calculation for finite samples, considering a margin of error of 5%, p and q of 50% and a level of confidence of 95%. For the questionnaire application, the universe totaled 2,300 students. For this population, the minimum sample is equivalent to 330 students. The questionnaire has been made available on the HEI website for all the population students; in this case, with the option for the census attempt. The resulting sample consisted of 523 students who assessed 90 items related to the 22 indicators (services). From the 523 students, 151 presented a percentage of missing data greater than or equal to 10% and, consequently, these individuals were excluded from the analysis. For the remaining students, any missing information was replaced by the general average of each item. The final sample totaled 372 distributed responses, as described below:
Administration—Bachelor degree (62 students): 16.67%;
Higher Technological Courses (67 students): 18.02%;
Production Engineering (60 students): 16.13%;
Pedagogy Under Graduation degree (148 students): 39.78%;
Social Services—Bachelor degree (35 students): 9.41%.
4.3. Phase III application: multivariate analysis
The final sample, totaling 372 responses, was used to develop Phase III. In the description of the desired level and the minimum acceptable level for each of the items, this study only used the average as a position measurement. The values were calculated by the difference between the average of what the students observed (OB) and the average of the desired (DE), and the difference between the average of what the students observed (OB) and the average of the acceptable minimum (MA). These results are shown in Table for each of the constructs (column 1) and their corresponding items (column 2; Annex).
Table 4. Analysis of the assessment scales
When analyzing the difference between the average of the observed and the average of the desired (OB—DE), presented in column (8) of Table , we can find that, in all assessed items, the desired values were higher than the observed ones, resulting in negative values. The Kano’s rank was calculated by the higher assessment frequency of the functional and the dysfunctional question, thus providing the desired classification (column 10). It is essential to highlight that the C.I. values, strictly lower than five, pieces of evidence dissatisfaction with the assessed item, whereas the C.I. values strictly more significant than five indicates satisfaction and the C.I. values equal to five demonstrates neutrality. The averages of the desired values (column 6) and the minimum acceptable for each item of the construct (OB—MA) are also identified (column 9).
The exploratory factorial analysis established indicators to represent the HEI constructs (moments of contact; services). The results for the validity and quality of the constructs are presented in Table . Thus, we conclude that: i) there was a convergent validation in all constructs, since AVEs were higher than 0.50; ii) all the constructs presented values of Cronbach’s Alpha (C.A.) and Composite Reliability (C.R.) above 0.70, thus evidencing their reliability; iii) the KMO values were greater than or equal to 0.50 in all constructs, indicating that the Factor Analysis adjustment is adequate in all constructs; iv) according to the Kaiser criterion, all the constructs were one-dimensional.
Table 5. Reliability, convergent validity and dimensionality of constructs (1Extracted Variance—EV; 2Cronbach’s Alfa—CA; 3Composite Reliability—CR; 4Sample Suitable Measure from Kaiser-Meyer-Olkin—KMO; 5Dimensionality)
Table 6. Descriptive analysis of indicators
Table 7. Characterization of groups concerning questions
This way, as can be seen in Table , the “Location” indicator presented a significantly lower average than the other indicators, since its C.I. does not overlap any of the others. Therefore, the satisfaction with the “Location” indicator was lower than the satisfaction with the other indicators. The highest average levels of satisfaction occurred in the “Coordination”, “Bathrooms” and “Library” indicators, evidencing that the individuals’ satisfaction tended to be higher concerning these aspects.
In the hierarchical grouping analysis, by using the Ward method and considering the Euclidean distance to characterize the groups concerning the indicators, we can highlight that Group 1 is characterized by the questions with lower average and Group 2 is characterized by questions with a higher average. Groups 3 and 4 are characterized by questions with median averages and, besides, the average for Group 3 is higher than the one for Group 4. There was a significant difference between the averages of all groups since the confidence intervals did not overlap (Table ). The formation of the groups allows us to combine the constructs, with four groups, as shown in column 1 of Table : facilities; infrastructure; academic support and DL.
Finally, Friedman’s test was elaborated for each item, consider the following variables: desired, minimum acceptable and observed. Table shows the comparison of the averages of their scores. From Table , we can verify that there was a significant difference (p-value = 0.000) between the scores and, when the multiple comparisons were made, it was found that the desired variable was significantly higher than the minimum one (p-value = 0.000) and that observed one (p-value = 0.000), while that observed was significantly higher than the minimum (p-value = 0.001). This means that the services provided by the HEI, although above the acceptable minimum, are considerably below the desired level. The Radar Graph for the problem is shown in Figure .
Table 8. Friedman’s test for analysis of expectation, minimum acceptable and observed
From Table , we can verify that there was a significant difference (p value = 0.000) between the scores and, when the multiple comparisons were made, it was found that the desired variable was significantly higher than the minimum one (p value = 0.000) and that observed one (value p = 0.000), while that observed was significantly higher than the minimum (p value = 0.001). This means that the services provided by the HEI, although above the acceptable minimum, are considerably below the desired level. The Radar Graph for the problem is shown in Figure .
Figure 4. Radar graph for the problem
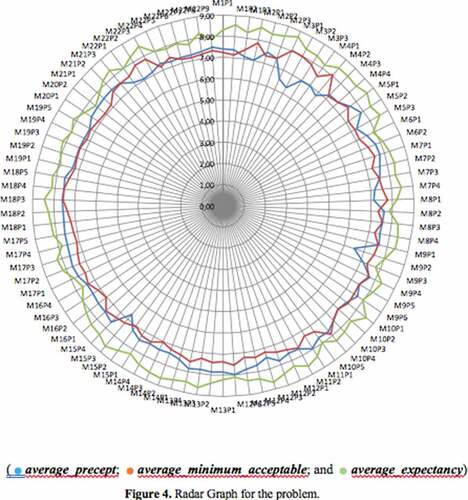
Through this graph, we can observe that there is a particular intersection between the average of the observed variable and the average of the acceptable minimum, although both are far from the average of the desired variable.
4.4. Phase IV application: reliability analysis
Phase IV aimed to analyze potential failures that are affecting the students’ satisfaction within the HEI. Although the “Observed” dissatisfaction scale was not identified with the analyzed indicators, some components of these indicators had a significantly lower average, in relation to the others. Such questions and where the student’s observed values have been below the acceptable minimums will be analyzed. In this model, which emphasizes the students’ observation (Observed), the severity degree has great importance in the calculation of risk priority. For this reason, a table for each item is elaborated, taking into account the observation average (OB), MA values and the Kano’s classification. The priority degree, in which the failure ranking is defined, can be obtained by multiplying the occurrence, detection and severity indices. The higher the index, the higher the priority for the decision making.
Based on Table and analyzing column 9—that showed negative values for (OB—MA), we have that the moment of contact of the presented site a significantly lower average than the others, in question M1P3 (regarding the “appeal follow-ups and requested documents”). The (OB—MA) value for this item was (- 0.33), indicating that what has been observed is below the acceptable minimum. In Kano’s assessment, the students considered this item mandatory. The moment of contact called “telephone service” presented a significantly lower average than the others in the M2P1 question (regarding the “service speed”). The (OB—MA) value was (- 0.83), and the students considered this item as one-dimensional. Moreover, the interpretation for the other items followed the same procedure.
The decision-making for the solution of the identified failures will be at the discretion of the HEI, as established in chart depicted in Figure , where the prioritization and ranking were elaborated through the risk priority number (RPN). The ranking for making a decision took into account the three specific indices. The detection degree has analyzed the possibility that the HEI will notice the failure before it happens. The occurrence took into account how often the failure happens. Finally, the severity degree took into account the criterion related to customer’s observation, the (OB—MA) degree, that indicates if the observed variable is below or above the acceptable minimum and the Kano’s scale that categorizes and ranks the importance of each item analyzed for the students.
The analysis of the 19 failures (Table ) through their modes, effects and causes, together with the quantitative identification of their occurrence, detection, severity and RPN grade, provides the HEI with subsidies for decision making.
Therefore, the application of the proposed conceptual model applied to the HEI demonstrated the systematics that the students use and with which they assess the processes at all moments of contact. All steps and objectives of each phase indicate the model adequacy so that the HEI can understand its service cycle and which attributes are observed by the students, as well as identify those that negatively interfere in their satisfaction.
Figure 5. Chart showing the failures ranking for decision making
5. Final considerations
The quality management in services is directly associated with the customer’s satisfaction, and this management becomes fundamental to improve enterprise performance. The proposed model has four phases that consider five significant approaches identified in recent literature. In Phase I, the company details the service cycle by listing every different moment of contact a customer has with the organization. As soon as every type of service is listed, a comprehensive evaluation for the services could be conducted
In Phase II, for every service listed, a set of three measures is collected. The desired or expected level of quality, the minimum acceptable level and the observed levels. For this purpose data are collected on a 10-point scale, with scores ranging from 0—no quality at all, thru 9—excellent quality
In Phase III of the proposal, the multivariate analysis simplifies the analysis by grouping all variables into a smaller number of factors, by the use of Exploratory Factor Analysis, and aggregating customers into groups with related behaviors through Cluster Analysis. Additionally each individual variable was tested in order to identify differences in the three collected measures—Friedman Test. The final identifies the existence of acceptable correlation levels between the variables.
Finally, in Phase IV, two different sets of data are obtained: First, a list of expected services levels, detailing the ones considered most critical for customers, and Second, a list of the services with quality below the minimum acceptable level. Those lists leads to a guide for management actions in order to implement preventive actions on the most important services, and correction actions on the services performing quality below acceptance level. Those two lists, altogether, could be considered a reliability evaluation, since they not only indicate with processes are critical, but also indicates which one is already considered to be failures, since the service provided does no minimally address customer expectations.
The concept of the proposed method was assessed through an HEI application and proved to be efficient and effective in order to identify what the student observes throughout the HEI service cycle, analyzing and identifying the critical moments, as well as the mode, effect and cause of the potential failures that generate the problems. O modelo proposto aplicado à HEI pode ser resumido conforme Figura 7.
The results of Phase IV (Figure ) presents the failures in order of priority, that is, the difference between the minimum desired values and those effectively found. As can be observed, four services are ranked 1st. Priority: “Telephone Answering—Employee does not answer the phone promptly”, “Access—Poorly lit streets”, “Access—Unsafe streets” and “Classroom—Difficulty accessing the internet”. For other services detected with lower quality than desired. Thus, HEI has the opportunity to improve its low-quality points based on the results obtained here in order to promote greater satisfaction to its students, as well as attract new students.
Figure 6. Summary of the proposed model applied to the analyzed HEI
As future works, the authors suggest the use of the model proposed in additional applications, as well as new studies regarding the model itself in an attempt to make it increasingly improved and it will be the object of next exploration.
Acknowledgements
The authors would like to thank the Coordination of Improvement of Higher Education Personal (CAPES), National Council for Scientific and Technological Development (CNPq) and Pontifical Catholic University of Parana (PUCPR) for the financial support of this research.
Additional information
Funding
Notes on contributors
Osiris Canciglieri Junior
Osiris Canciglieri Junior research has focused on the Integrated Product Development Process area, which includes some approaches and scientific tools that can be applied to support product design and manufacturing.
Ronaldo Trentin Zierhut
Ronaldo Trentin Zierhut is a lecture at Faculdade Padre João Bagozzi in Brazil, his experience includes Probabability and Statistics.
Rosana Adami Mattioda
Rosana Adami Mattioda is an Assistent Professor at Pontical Catholic University of Parana, her experience include Probability and Statistics.
Carla Cristina Amodio Estorilio
Carla Cristina Amodio Estorilio research has focused on the “industrial product development process”. However, in the last years, she has focused on the “service process” as well. After all, the success of final products depends on good services process.
Maria Teresinha Arns Steiner
Maria Teresinha Arns Steiner has been working in the Operational Research area, which includes Multivariate Analysis techniques.
Pedro José Steiner Neto has been lecturing and researching in quantitative methods and multivariate statistics. His studies and solutions, such as innovation and strategy frameworks, decision support systems.
Pedro José Steiner Neto
Maria Teresinha Arns Steiner has been working in the Operational Research area, which includes Multivariate Analysis techniques.
Pedro José Steiner Neto has been lecturing and researching in quantitative methods and multivariate statistics. His studies and solutions, such as innovation and strategy frameworks, decision support systems.
Related Research Data
References
- Abu Rashed, O, & Mohammad Ali, A. (2019). The mediating role of placement in service quality of education: from international students’ perspective. Iranian Journal Of Management Studies (Ijms), 12(4), 531-28.
- Ali, S., Ahmad, M., Zakaria, N., Arbab, A., & Badr, K. (2018). Assessing quality of academic programmes: Comparing different sets of standards. Quality Assurance in Education, 26(3), 318–332. doi:10.1108/QAE-09-2016-0051
- Almohtaseb, A., Almahameed, M., Shaheen, H., & Jarrar Al Khattab, M. (2019). A roadmap for developing, implementing and evaluating performance management systems in Jordan public universities. Journal of Applied Research in Higher Education, 11(2), 325–339. doi:10.1108/JARHE-04-2018-0061
- Bouranta, N., Psomas, E., Suárez-Barraza, M., & Jaca, C. (2019). The key factors of total quality management in the service sector: A cross-cultural study. Benchmarking: an International Journal, 26(3), 893–921. doi:10.1108/BIJ-09-2017-0240
- Breja, S. K., Banwet, D. K., & Iyer, K. C. (2011). Quality strategy for transformation: A case study. The TQM Journal, 23(1), 5–20. doi:10.1108/17542731111097452
- Chee, Y. W., & Noorliza, K. (2010). Explaining the competitive advantage of logistics service provider: A resource-based view approach. International Journal of Production Economics, 128(1), 51–67. doi:10.1016/j.ijpe.2009.08.026
- Durdyev, S., Ihtiyar, A., Imail, S., Ahmad, F. S. H., & Bakar, N. A. (2014). Productivity and service quality: Factors affecting in service industry. Procedia - Social and Behavioral Sciences, 109, 487–491. doi:10.1016/j.sbspro.2013.12.494
- Elahi, F., & Ilyas, M. (2019). Quality management principles and school quality. The TQM Journal, 31(4), 578–599. doi:10.1108/TQM-11-2018-0173
- Esfijani, A. (2018). Measuring quality in online education: A meta-synthesis. American Journal of Distance Education, 32(1), 57–73. doi:10.1080/08923647.2018.1417658
- Finkelman, D. (1993). Crossing the ‘Zone of Indifference’. Marketing Management, 2(3), 22–32.
- Fitzsimmons, J. A., & Fitzsimmons, M. J. (2008). Administração de Serviços (6ª Edição ed.). Porto Alegre: Artmed.
- Gera, R. (2011). Modelling e-service quality and its consequences in India. A SEM approach. Journal of Research in Interactive Marketing, 5(2/3), 203–225. doi:10.1108/17505931111187811
- Geum, Y., Cho, Y., & Park, Y. (2011). A Systematic approach for diagnosing service failure: Service-specific FMEA and grey relational analysis approach. Mathematical and Computer Modelling, 54, 3126–3142. doi:10.1016/j.mcm.2011.07.042
- Gianesi, I. G. N., & Correa, H. L. (2009). Administração estratégica de serviços. São Paulo: Atlas.
- Gorla, N., Somers, T. M., & Wong, B. (2010). Organizational impact of system quality, information quality, and service quality. Journal of Strategic Information Systems, 19, 207–228. doi:10.1016/j.jsis.2010.05.001
- Grönroos, C., & Ojasalo, K. (2004). Service productivity—towards a conceptualization of the transformation of inputs into economic results in services. Journal of Business Research, 57, 414–423. doi:10.1016/S0148-2963(02)00275-8
- Hoang, D. T., Igel, B., & Laosirihongthong, T. (2010). Total quality management (TQM) strategy and organisational characteristics: Evidence from a recent WTO member. Total Quality Management & Business Excellence, 21, 931–951. doi:10.1080/14783363.2010.487680
- Hu, -H.-H., Kandampully, J., & Juwaheer, T. D. (2009). Relationships and impacts of service quality, perceived value, customer satisfaction, and image: An empirical study. The Service Industry Journal, 29(2), 111–125. doi:10.1080/02642060802292932
- Huang, B., Wang, T., & Xue, X. (2012). Service-selecting approach based on domain-specified ‘Quality of Service’ model and its application in logistics. The Service Industries Journal, 32(9), 1571–1588. doi:10.1080/02642069.2010.551761
- Huang, C. H. J., & Huang, K. P. (2012). The logistics capabilities scale for logistics service providers. Journal of Information and Optimization Sciences, 33(1), 135–148. doi:10.1080/02522667.2012.10700139
- Ihtiyar, A., & Ahmad, F. S. (2012). Impact of intercultural competence on service quality and customer satisfaction in the grocery retail industry: A conceptual framework. International Journal of Science and Management, 1, 13–27.
- Jayawardhena, C. (2010). The impact of service encounter quality in service evaluation: Evidence from a business-to-business context. Journal of Business & Industrial Marketing, 25(5), 338–348. doi:10.1108/08858621011058106
- Johnson, G., Scholes, K., & Whittington, R. (2005). Exploring corporate strategy (7th ed.). New Jersey: Prentice hall.
- Kashif, M., & Cheewakrakokbit, P. (2018). Perceived service quality-loyalty path: a pakserv based investigation of international students enrolled in business schools in Thailand. Journal of Marketing for Higher Education, 28(1), 51–65. doi:10.1080/08841241.2017.1402113
- Khodayari, F., & Khodayari, B. (2011). Service quality in higher education. Interdisciplinary Journal of Research in Business, 1(9), 38–46.
- Kurt, S. (2018). Assessing the quality of architecture schools. Quality & Quantity: International Journal of Methodology, 52(1), 863–888. doi:10.1007/s11135-018-0695-8
- Ladhari, R. (2009). A review of twenty years of SERVQUAL research. International Journal of Quality and Services Sciences, 1(2), 172–198. doi:10.1108/17566690910971445
- Leonnard, L. (2018). The performance of SERVQUAL to measure service quality in private University. Journal on Efficiency and Responsibility in Education and Science, 11(1), 16–21. doi:10.7160/eriesj.2018.110103
- Liu, W. H., & Xie, D. (2013). Quality decision of the logistics service supply chain with service quality guarantee. International Journal of Production Research, 51(5), 1618–1634. doi:10.1080/00207543.2012.720390
- Mittal, V. (2001). Kamakura, W. Satisfaction, repurchase intent, and repurchase behavior: Investigating the moderating effects of customer characteristics. Journal of Marketing Research, 38(1), 131–142. doi:10.1509/jmkr.38.1.131.18832
- Osman, A., & Saputra, R. (2019). A pragmatic model of student satisfaction: A viewpoint of private higher education. Quality Assurance in Education, 27(2), 142–165. doi:10.1108/QAE-05-2017-0019
- Rodriguez, J., Valenzuela, M., & Ayuyao, N. (2018). TQM paradigm for higher education in the Philippines. Quality Assurance in Education, 26(1), 101–114. doi:10.1108/QAE-12-2015-0048
- Šebjan, U., & Bastič, M. (2013). Service components and their importance in health insurance changes. Naše Gospodarstvo, 59(3–4), 14–25.
- Seo, Y.-J., & Um, K.-H. (2019). The asymmetric effect of fairness and quality dimensions on satisfaction and dissatisfaction: An application of the Kano model to the interdisciplinary college program evaluation. Studies in Educational Evaluation, 61, 183–195. doi:10.1016/j.stueduc.2019.04.007
- Siddiqui, M. H., Gomtinagar, V. K., & Sharma, T. G. (2010). Life insurance services: An empirical investigation. International Business Research, 3(3), 171–186. doi:10.5539/ibr.v3n3p171
- Teeroovengadum, V., Nunkoo, R., Gronroos, C., Kamalanabhan, T., & Seebaluck, A. (2019). Higher education service quality, student satisfaction and loyalty. Quality Assurance in Education, 27(4), 427–445. doi:10.1108/QAE-01-2019-0003
- Tse, Y. K., & Tan, K. H. (2011). Managing product quality risk in a multi-tier global supply chain. International Journal of Production Research, 49(1), 139–158. doi:10.1080/00207543.2010.508942
- Varouchas, E., Sicilia, M.-A., & Sánchez-Alonso, S. (2018). Towards an integrated learning analytics framework for quality perceptions in higher education: A 3-tier content, process, engagement model for key performance indicators. Behaviour & Information Technology Journal, 37, pp10–11.
- Yousapronpaiboon, K. (2014). SERVQUAL: Measuring higher education service quality in Thailand. 5th. World Conference on Educational Sciences (WCES- 2013), Rome - Italy. Procedia Social and Behavioral Sciences, 116, 1088–1095.