
 ?Mathematical formulae have been encoded as MathML and are displayed in this HTML version using MathJax in order to improve their display. Uncheck the box to turn MathJax off. This feature requires Javascript. Click on a formula to zoom.
Abstract
The presence of carbon in an environment indicates the need for urgent attention on air quality control. Lagos mega city is presently experiencing developmental projects associated with carbon emission potentials, which are yet to be quantified; hence, this study identified and quantified the sources of carbon emission in the Lagos mega city and also determined the quantity of energy consumption capacity for domestic, transportation and industries. Using fuel consumption rate and activity duration, the emissions factors approach were used to determine the quantity of Carbon dioxide (CO2) emission from the household, vehicular operation and electric power generators in the zones. The total CO2 emission from the three major sectors was then used to establish the carbon footprint and annual global warming potential of the mega city. This study reported a CO2 (g) emission of 9.59 × 10¹³ tons CO2-e per annum for industrial area and 2.41 × 10¹⁶ tons CO2-e per annum for non-industrial area. The overall carbon dioxide emission for Lagos Mega City in 2015 was 2.42 × 10¹⁶ tons CO2-e per annum which is higher than the value of 1.6 × 10¹⁶ tons CO2-e per annum predicted for Lagos BRT CO2 emission, which stands at 66.1% increase from 2014 to 2015 as the reporting periods.
PUBLIC INTEREST STATEMENT
This study identifies the major sources of carbon emission in Lagos, Nigeria. Considering emissions from household consumption, industry, and transport, carbon emissions are quantified in order to determine the total annual global warming potential of the city. Mitigating measures are proposed that may reduce the effect of these emissions on climate change.
1. Introduction
The need to reduce carbon emission has now become everybody’s concern. This is because its adverse effects are being experienced worldwide (Khan & Tian, Citation2018). The continued growth of urban populations has led to an increase in their importance as a pollution source. Between 1975 and 2005, only Dhaka in Bangladesh, Lagos in Nigeria, Delhi in India, Karachi in Pakistan, Jakarta in Indonesia, Mumbai (Bombay) in India and Manila in the Philippines experienced urban population growth higher than 2.4% (UN, Citation2006). Lagos is Nigeria’s commercial capital. It is the second most populated and fastest growing urban centre after Cairo, being a focal point for regional, national and international trade and served by significant, and often overloaded, rail, ocean and air transport facilities (Aluko, Citation2010).
As with the majority of cities, road transport is thought to be the most significant source of anthropogenic emission. Transportation creates social and economic values but has a large and growing impact on fossil energy consumption and CO2 emissions. Population growth places additional pressure on transport systems and growing global prosperity results in more traffic. Half of humanity lives in cities, and by 2030, the proportion will rise to more than 70% according to the World Health Organization. Congestion, pressures on housing, transport, health services and demand for energy, water and food will all grow accordingly; impacting the quality of life of billions of people. Industry plays a vital role in the economic and social development of every country (Annual Report, 2014). But the unreliable electrical supply in Lagos has led to an increased reliance on small-scale diesel powdered generators, and these potentially present a significant source of emissions in Lagos.
Lagos being the nation’s industrial and commercial centre makes the city to be afflicted with heavy industrial pollution. Virtually, all of the industries’ power supplies come from heavy-duty diesel-powered generating sets. There are about 2600 km of roads in Lagos that are frequently congested, with over 1 million vehicles (petrol and diesel powered) plying the roads on a daily basis contributing greatly to air pollution in the city. The poor road network and obstructions coupled with the huge volume of traffic and the resultant traffic jam often lead to increased carbonaceous emission in the mega city.
2. Study area
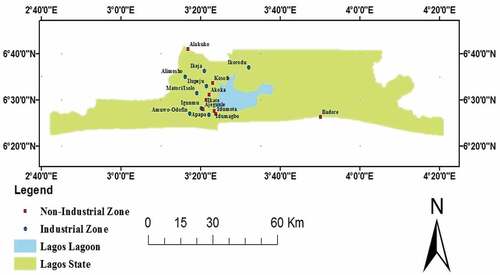
The coastal city of Lagos is situated within latitudes 6° 23ʹN and 6° 41ʹN and longitudes 2° 42ʹE and 4° 20ʹE (Figure ). Lagos experiences a tropical savanna climate according to the Köppen climate classification, as there is a significant precipitation difference between the wet season and the dry season. The wet season starts in April and ends in October, while the dry season starts in November and ends in March. The wettest month is June with precipitation total 315.5 mm (12.42 in), while the driest month is January with precipitation total 13.2 mm (0.52 in).
Located near the equator, Lagos has only a slight seasonal temperature variation, with high temperatures ranging 28.3–32.9 °C (82.9–91.2 °F). Lagos shares the seasons of the Southern Hemisphere, with summer highs in March, daily range 32.9–24.1 °C (91.2–75.4 °F), and warm winters in August, ranging 28.3–2 1.8 °C (82.9–71.2 °F) as the daily average.
The mega-city is one of the most rapidly urbanizing areas in the world, and Nigeria’s most populous city. Its growth has been phenomenal, both demographically and spatially. From a population of about 25,000 in 1866, Lagos reached 665,000 by 1963, covering 69.9 Km2. It became over 10 million in 1995 thus attaining by UN definition, the status of a mega-city. Its population is presently about 16.1 million according to United Nations (2005). Lagos state has the largest population density of the foremost-industrialized states in Nigeria (Lagos, Rivers, Kano and Kaduna). It is also the state with the greatest concentration of industries, with over 7000 medium- and large-scale industrial establishments. The major industrial estates in Lagos include Ikeja, Amuwo-Odofin, Apapa, Iganmu, Ilupeju, Matori/isolo, Ikorodu, Alimosho, and non-industrial areas are Kosofe, Akoka, Alakuko, Badore, Ajegunle, Ikate (Ogungbuyi & Osho, Citation2005).
Figure 1. Map of Lagos Mega City Showing Industrial and Non Industrial Zone
3. Materials and methods
3.1. Sampling locations
The estimation of emission sources cover land area, population density, vehicles movement in and out of the area under investigation, number of household and their means of cooking and the data on fuel consumption of the various industries. Data were collected for the number of people using domestic fuel in both industrial zone and non-industrial zone. Also data of fuel consumption of the various industries in the area was collected and analysed. The study of carbon footprint also involved analysis of carbon dioxide emission from the vehicles moving in and out of the industrial and non-industrial zones. This non-industrial emission includes private car, commercial bus/taxi, truck/lorries, tractors, salon station wagon and pick up vans. The carbon emission is divided into three major sources (household, vehicle and industrial energy). The total CO2 emission from the three major sources was used to establish the carbon footprint and annual global warming potential of Lagos mega city. The CO2 emission from diesel and petrol vehicle engines in the industrial zone and non-industrial zone was calculated. The cumulative CO2 emissions from three sources for both zones were summed to obtain the carbon footprint of the city.
3.2. Identification of CO2 emission sources
Three sources were considered for the carbon footprint in industrial and non-industrial zones of Lagos mega city and include household energy consumption; industrial production capacity; and transportation/mobility of vehicles.
3.2.1. Household emission source
People living in the residential areas of the identified zones contribute to CO2 emission apart from other sources through the means of cooking. From investigations, household in the industrial and non-industrial zones were observed to be using solid fuel (wood, charcoal,) and non-solid fuel (kerosene and gas) as domestic cooking fuel. Since CO2 emission from household has its relationship attached to population. (Ogungbuyi & Osho, Citation2005) reported in its survey that the percentage of population using each fuel as follows: wood 8%, charcoal 3%, kerosene 30% and gas 1%.
3.2.2. Transportation emission sources
Transportation is another major contribution to CO2 emission. To accurately estimate CO2 emission from the vehicular movement, fuel consumption and types of engines were considered. Six categories of vehicle were considered; private car, commercial bus/taxi, truck/lorries, tractors, salon station wagon and pick up van, these vehicles run on petrol and diesel as source of fuel with each having emission factor of 2.4tCO2-e/kl and 2.7tCO2-e/kl (Austrialian Government, Department of Climate Change [AGDCC], Citation2006)
3.2.3. Industrial emission sources
Data for the fuel consumption of various industries in the entire industrial zones was collected and collated. Identified industrial use one or more power generator sets, as source of energy to generate power to drive machines for production processes, the generators run on diesel. Therefore, the total fuel consumption per day for each zone as sum of the consumption capacity of each power generating set of industries in separate location within the zone were used to determine the CO2 emission.
3.3. Estimation of CO2 emission
Estimated CO2 emissions obtained from both industrial zones and non- industrial zones can be expressed using Equationequation (1)(1)
(1) (European Environment Agency [EEA], Citation1990, Citation2016; Fakinle, Odekanle, Olalekan, Odunlami, & Sonibare, Citation2018).
Where:
E = Emission
EF = Emission Factor
Q = quantity in (kl)
3.4. Working assumptions for CO2 emission estimates
The following observation and assumptions were made:
It was noted that depending on the rating of a car engine (1.3, 1.6, 1.8, 2.0, 2.2, 3.0), the fuel consumption increases progressively during non-constant speed movement. Private car owners are assumed to drive between their various homes and their respective offices and vice-versa within the local government. Therefore, it was assumed that they journey for an average time of one hour (1 h) per day. It was assumed that the commercial and salon station wagon vehicles are always moving around industrial zone between an average hour of 6:00 am and 8:00 pm with an expected 4 h of idleness or rest, hence, 10 h of active movement per day. It was also assumed that since the trucks and lorry only move goods in or out of the industrial zone therefore, each require 3 h per day. Since the movement is within the same local government, the average assumed speeds are: Private cars and salon station wagon at 80 km/h, Commercial and pick up van at 60 km/h, while Trucks and Lorries at 40 km/h.
3.5. Method of estimation
Data were collected for the land coverage area, population density, vehicles movement in and out of the area under investigation, number of household and their means of cooking. Also, the data on fuel consumption of the various industries in the areas were collected and analysed. Household energy consumption: Data were collected for the number of people using domestic fuel in both industrial zone and non-industrial zone. Also data of fuel consumption of the various industries in the area were collected and analysed. The study of carbon footprint also involved analysis of carbon dioxide emission from the vehicles moving in and out of the industrial and non-industrial zones. This non-industrial emission includes private car, commercial bus/taxi, truck/lorries, tractors, salon station wagon and pick up vans.
3.6. Estimation procedure for CO2 emission from household sources
Each residential household in all the industrial and non-industrial zones is using fuel like wood, charcoal, gas and kerosene for domestic cooking. The percentage of people using each of the fuels for cooking in each industrial zone was used to determine the amount of carbon emission in the zones. Considering the epileptic supply of electricity in Nigeria especially in Lagos mega city, the use of electricity for cooking at various homes is negligible compared to other sources. In most cases, it requires alternative means of generation usually with high capacity of generator sets. The population of people using each domestic fuel was determined as product of percentage of people using each fuel and population of the zones. Having obtained the annual fuel consumption per person, the value was used to calculate the annual quantity of domestic fuel consumed in each industrial zone.
3.7. Estimation procedure for CO2 emission from transportation sources
The study of carbon footprint is not complete without the analyses of the carbon dioxide emission from the vehicles moving in and out of various industries daily. This is categorized into: private cars, commercial bus/taxi, truck/lorries, tractors, salon station wagon and pick up van.
3.8. Estimation procedure for CO2 emission from industrial sources
Data for the fuel consumption of various industries in the entire industrial zones were collected and collated. Considering that each industry uses one or more power generator sets, as source of energy therefore, the total fuel consumption per day is the sum of the consumption capacity of each power generator set. Industrial activities generate CO2, which varies with the volume of diesel used. The emission factor for diesel is 2.7 tCO2-ekl while that of gasoline is 2.4 tCO2-ekl. (AGDCC, Citation2006). CO2 emission from industrial production was obtained from the product of daily diesel consumption and appropriate emission factor.
4. Results and discussion
The results of the data collected and analysed are presented and discussed in this section. The CO2 emission in these study areas (industrial and non-industrial zones) was as a result of industrial activities, vehicular movement and household energy. The results of the household energy consumption for industrial zone for solid fuel (wood and charcoal) and non-solid fuel (kerosene and gas) are shown in Table . It has been established that the CO2 emission of all the household energy were quantified by the population of the people living in the industrial area in Lagos mega city.
Table 1. Population of People Using Each Domestic Fuel
Table depicts the result of emission quantities across the industrial zone of Lagos. These results were obtained by multiplying the annual usage per person in kilogram by the number of people using each domestic fuel and that gives the quantity of CO2 emission that is generated by solid fuel and non-solid fuel.
Table 2. Annual Quantity of Domestic Fuel Consumed in Each Industrial Zone
Alimosho has the highest CO2 emission among the other industrial zone because it has largest population of people in Lagos mega city while Ilupeju industrial zone had the least CO2 emission as shown in Figure .
Figure 2. Chart of Domestic Fuel Consumption
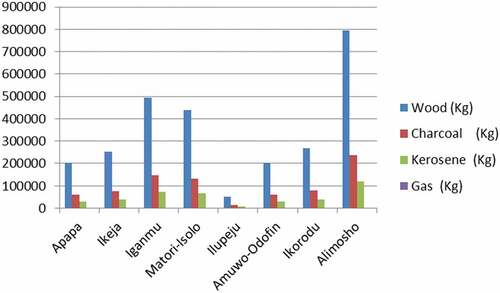
Table shows the quantity of total emission that the solid fuel and non-solid fuel contribute to all industrial zone.
Table 3. Quantity of Emission of all the Industrial Zones
The CO2 emissions from all industrial areas production capacity are shown in Table , which depict that the production capacity of Ikeja is much greater than any other industrial zone thus producing the highest emission as shown in Figure .
Figure 3. Plot of Industrial Production Capacity
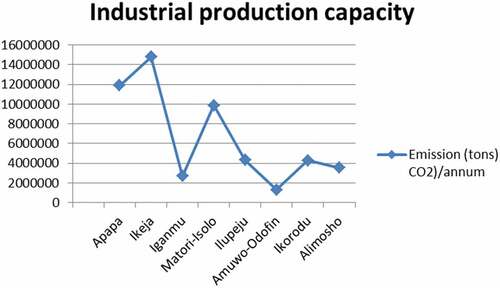
Table 4. CO2 Emissions According to Industrial Averages as at 2015
The annual global warming potential of Lagos mega city was calculated using the total CO2 emission from the three identified sources of CO2 emission. Carbon dioxide is the reference gas against which warming potential of other greenhouse gases are measured and therefore has a global warming potential (GWP) of 1.
5. Conclusion
This study has identified the major sources of carbon emission in Lagos mega city, Nigeria (viz; household energy consumption, industrial fuel consumption as well as transport and mobility of vehicles). It determined the quantity of carbon emission from all three identified sources and estimated the annual global warming potential of the city using carbon emissions. A number of mitigating measures were also proposed for carbon emission in the city. The study reported a CO2 (g) emission of tons CO2-e per annum for industrial area and
tons CO2-e per annum for non-industrial area. The overall carbon dioxide emission for Lagos Mega City being 2.42
tons CO2-e per annum. This result implies a 66.1% increase as predicted by (Hassan & Kouhy, Citation2013) and that of similar study conducted in 2010 (Tom & Blasing, Citation2010). It was observed that CO2 emission value, being a measure of environmental pollution, is significant, on the increase, and must be kept low.The Long-range EnergyAlternative Planning System (LEAP) software reported by (Iduh & Otene, Citation2016) was employed to model the energy demand and carbon dioxide emissions from the BRT-Lite by creating a current scenario and projections to the year 2030 (Hassan & Kouhy, Citation2013) as shown in Figure . Also the use of CNG as an alternative fuel for Lagos BRT-Lite will significantly reduce CO2 emissions in Nigeria’s oil and gas industry. Other utilization options for flared gas from this industry include: Liquefied Natural Gas (LNG), Liquefied Petroleum Gas (LPG), and power generation (Hassan & Kouhy, Citation2013). Hence, this study is important for monitoring and checking of adverse CO2 emissions from identified sources in a commercial location like Lagos. If this study is extended to other states of the federation, it will provide a holistic appraisal of CO2 emissions for National Policies formulation and evaluation. It is important to generate CO2 emissions value for all major industrial centres from time to time to keep a track of environmental pollution in the nation.
correction
This article was originally published with errors, which have now been corrected in the online version. Please see Correction (http://dx.doi.org/10.1080/23311916.2020.1787643)
Additional information
Funding
Notes on contributors
Abimbola Gbolahan Bola-Popoola
Abimbola Gbolahan Bola-Popoola obtained MSc. in Chemical Engineering from Obafemi Awolwo University, Ile Ife, Nigeria. Her area of specialization is air quality.
Bamidele Sunday Fakinle
Bamidele Sunday Fakinle obtained his PhD in Chemical Engineering from Obafemi Awolowo University, Ile-Ife, Nigeria. He is a Senior Lecturer at the Department of Chemical Engineering, Landmark University, Omu-Aran, Nigeria. Also He is a certified engineer and a consultant in air quality and life cycle analysis. He can be contacted at: [email protected], [email protected]
Olayemi Abosede Odunlami
Olayemi Abosede Odunlami obtained PhD in Chemical Engineering from Obafemi Awolowo University, Ile-Ife, Nigeria. She is a lecturer at Covenant University, Ota, Nigeria.
Jacob Ademola Sonibare
Jacob Ademola Sonibare is a professor of Chemical Engineering, Obafemi Awolowo University, Ile-Ife, Nigeria. He is a consultant in air quality and life cycle analysis. He can be contacted at: [email protected]
Ebenezer Leke Odekanle
Ebenezer Leke Odekanle is a lecturer at the Department of Chemical Engineering, Landmark Univesity, Omu-Aran Nigeria. He is a certified Engineer, His area of specialization is in air quality and life cycle analysis.
Related Research Data
References
- Aluko, A. (2010). The impact of urbanisation on housing development: The lagos experience, Nigeria. Ethiopian Journal of Environmental Studies and Management, 3(3), 64–9.
- Austrialian Government, Department of Climate Change [AGDCC]. (2006) National Greenhouse Gas Inventory. www.egovernment.tas.gov.au/_data/assets/pdf_file/0019/57133/inventory2006.pdf
- European Environment Agency [EEA]. (1990). Emission inventory guidebook. Retrieved from http://www.eea.europa.eu.
- European Environment Agency [EEA]. (2016). Emission inventory guidebook. Retrieved from http://www.eea.europa.eu
- Fakinle, B. S., Odekanle, E. L., Olalekan, A. P., Odunlami, O. A., & Sonibare, J. A. (2018). Impacts of Polycyclic Aromatic Hydrocarbons (PAHs) from vehicular activities on the ambient air quality of Lagos Mega City. Environmental Quality Management, 27(4), 73–78. doi:10.1002/tqem.21563
- Hassan, A., & Kouhy, R. (2013). Gas flaring in Nigeria: Analysis of changes in its consequent carbon emission and reporting. Accoun Forum, 37(2): 124–134.
- Iduh, J. J., & Otene, P. M. (2016). The potential reduction of Carbon Dioxide (CO2) emissions from gas flaring in Nigeria’s oil and gas industry through alternative productive use. Conference Report on Environments, 1–20. Retrieved from www.mdpi.com/journal/environments
- Khan, M. Y., & Tian, F. (2018). Understanding the potential sources and environmental impacts of dissolved and suspended organic carbon in the diversified Ramganga River, Ganges Basin, India. Proceedings of the International Association of Hydrological Sciences. 379: 61–66. doi:10.5194/piahs-379-61-2018
- Ogungbuyi, O. M., & Osho, Y. B. (2005). Study on Industrial Discharges to the Lagos Lagoon. Report Submitted by United Nations Industrial Development Organization (UNIDO), Country Service Framework Programme under the Ecological Sustainable Industrial Development Programme.
- Tom, B., & Blasing, T. J. (2010). Carbon dioxide information analysis centre. CIAC OAK National Laboratory, US Department of Energy.
- United Nations (2006) Population Newsletter. Department of Economic and Social Affairs/Population Division. www.unpopulation.org