
Abstract
In this work, a cloud manufacturing architecture aimed at offering on-demand services for part quality assessment is presented and demonstrated with reference to an aeronautical industry application. The developed architecture is based on a three-level structure and considers two non-contact metrological procedures to be integrated via cloud service: laser-based 3D metrology and ultrasonic non-destructive inspection. The combination of these two techniques allows to measure part features and detect possible defects associated with the outer part geometry as well as the inner material structure. The data coming from the two metrological procedures and pre-processed at fog level are sent to the cloud that performs their integration with the aim to allow for the 3D visualization and manipulation of the heterogeneous metrological data into a single-user interface for the holistic part quality evaluation. The validation of the cloud manufacturing architecture for part quality assessment is performed on a composite material component employed in the aeronautical industry. Through the cloud platform, the heterogeneous data from the two non-contact metrological techniques are integrated, and the newly developed user interface allows for the simultaneous visualization and analysis of the 3D metrology and ultrasonic information for detecting geometrical defects and internal flaws of the inspected component.
PUBLIC INTEREST STATEMENT
A cloud manufacturing architecture aimed at offering part quality assessment services is presented and demonstrated with reference to an aeronautical industry application. The developed architecture is based on a three‐level structure consisting of a device layer, a fog layer and a cloud layer. Two non‐contact metrological procedures are integrated via cloud: laser‐based 3D metrology and ultrasonic non‐destructive inspection. Their combination allows to measure part features and detect defects associated with the outer part geometry as well as the inner material structure. The validation of the cloud manufacturing architecture for part quality assessment is performed on a composite material component employed in the aeronautical industry. Through the cloud platform, the heterogeneous data from the two non‐contact metrological techniques are integrated, and a newly developed user interface allows for the simultaneous visualization and analysis of the 3D metrology and ultrasonic information for detecting geometrical defects and internal flaws of the inspected component.
1. Introduction
The transformation of global manufacturing industry, also known as the fourth industrial revolution (Industry 4.0), is strongly endorsed by the integration of Information and Communication Technologies (ICT) into the production environment. In this framework, Cloud Manufacturing (CMfg) is emerging as an advanced manufacturing paradigm integrating the latest key enabling technologies such as cloud computing, web technologies, service-oriented technologies, internet of things, cyber-physical systems, big data analytics and artificial intelligence (Li et al., Citation2010; Liu, Wang, Wang, Xu, & Zhang, Citation2018; F Tao, Zhang, Venkatesh, Luo, & Cheng, Citation2011; Xu, Citation2012; Zhang et al., Citation2014). The purpose is to enable on-demand access to intelligent manufacturing resources and manufacturing services via internet by extending the cloud computing concept to manufacturing (Xu, Citation2012; Zhang et al., Citation2014).
The implementation of Cloud Manufacturing allows to connect via Internet several manufacturing resources, including digital and physical ones, as well as manufacturing capabilities and data that can be accessed remotely and on-demand in a service-oriented architecture (Wang, Torngren, & Onori, Citation2015). Accordingly, manufacturing services can be offered by exploiting the connection allowed by the cloud technology to smart devices, computational resources and big volumes of data generated on the shop floor through the employment of sensor systems (Mourad, Nassehi, Schaefer, & Newman, Citation2020; Wu, Rosen, Wang, & Schaefer, Citation2015).
As a matter of fact, most cloud manufacturing applications are characterized by the employment of sensors to acquire data from the shop floor and smart techniques of data processing to provide services related to several manufacturing tasks, including monitoring and optimization of machining processes, adaptive process planning, preventive maintenance of machine tools, resource efficiency optimization, prognosis for manufacturing, etc. (Caggiano, Citation2018; Caggiano, Segreto, & Teti, Citation2016; Gao et al., Citation2015; Mourtzis, Vlachou, Milas, & Xanthopoulos, Citation2016; Mourtzis, Vlachou, Xanthopoulos, Givehchi, & Wang, Citation2016; Simeone, Caggiano, Boun, & Deng, Citation2019; Simeone, Caggiano, Deng, Zeng, & Boun, Citation2018; Tapoglou et al., Citation2015).
As a consequence of the growing need of smart manufacturing systems to acquire and employ large volumes of information to make decisions on several actions, huge amounts of heterogeneous data are increasingly generated from sensors and other devices and are subsequently analysed (Lu & Xu, Citation2019; Tao, Qi, Liu, & Kusiak, Citation2018). However, transmitting all these data to the cloud may call for extremely high network bandwidth (Fei, Yue, Xiaofu, & Qinglin, Citation2019). The growing increase of connected devices, the limitations related to the network bandwidth and the uncertain latency in cloud data transmission call for innovative cloud manufacturing architectures capable of reducing the cloud connectivity issues through new layers like fog computing (Atlam, Walters, & Wills, Citation2018; Mocanu, Geampalia, Chenaru, & Dobrescu, Citation2018; Mouradian et al., Citation2018).
Fog computing aims at offering data processing and storage capabilities closer to the end devices instead of directly transferring the raw data collected by sensors to the cloud. At the fog layer, small-scale cloud functionality is ensured by the so-called fog nodes, i.e. devices with computing, storage, and network connectivity (Mocanu et al., Citation2018; Mouradian et al., Citation2018). The objective is to improve efficiency and performance and reduce the amount of data transmitted to the cloud for processing, analysis and storage, hence reducing network traffic and latency (Atlam et al., Citation2018; Mishra, Roy, Dutta, Pal, & Chakravarty, Citation2018).
The implementation of cloud manufacturing architectures involving fog layers in manufacturing is at its early stage, although some architecture proposals were presented in the literature (Mishra et al., Citation2018; Mocanu et al., Citation2018) highlighting the associated benefits such as connectivity between physical devices and the cloud, fog nodes heterogeneity and distribution, low and predictable network latency, remote access to high volumes of factory data in a secure way, high-performance computing (Mocanu et al., Citation2018).
In this research work, a three-level cloud manufacturing architecture including an intermediate fog layer is developed with reference to a manufacturing application aimed at offering on-demand services for holistic quality assessment of manufactured parts.
The quality assessment of manufactured parts calls for the employment of different metrological procedures as several types of defects, both related to the outer part geometry as well as to the inner material structure, can be produced. This issue is particularly relevant when manufacturing processes are carried out on advanced materials such as composites, where cracks, delamination or voids may occur, but also in metal manufacturing, where inclusions, cracks and other internal defects may happen (Caggiano, Segreto, & Teti, Citation2018; Fleischer et al., Citation2018; Zaiß, Demmerle, Oergele, & Lanza, Citation2017).
The combination of diverse non-destructive metrological procedures allows to measure a variety of part features and detect possible defects associated to the outer part geometry as well as the inner material structure which cannot be detected by a single sensor, allowing to perform the holistic quality assurance of a manufactured part (Zaiß et al., Citation2017).
On the other hand, the integration of heterogeneous and independent data sources with diverse data representation as well as processing techniques is challenging and it requires advanced computational capabilities and an architecture able to cope with diverse data sources simultaneously, therefore it represents an ideal application for the implementation of a cloud manufacturing architecture involving a fog layer (Atlam et al., Citation2018; Schaefer, Citation2014).
The cloud manufacturing framework proposed in this work takes advantage of the cloud and fog capabilities to integrate complex heterogeneous data generated from two non-contact metrological procedures, i.e. 3D metrology via laser-based reverse engineering (RE) and non-destructive inspection via ultrasonic testing (UT).
A dedicated three-level architecture consisting of a device layer, a fog layer and a cloud layer is developed, making up a complex cyber-physical system where the fog layer acts as an intermediary between the physical devices and the cloud. The data coming from the physical metrology systems at the factory level are pre-processed at the fog level and transmitted to the cloud layer that implements their integration with the final purpose to allow for the 3D visualization and handling of the heterogeneous metrological data into a single-interactive user interface for the holistic evaluation of the manufactured part quality.
The validation of the proposed cloud manufacturing architecture is performed with reference to an aeronautical industry application regarding the holistic quality assessment of a composite material component. Different metrology techniques are employed to identify a range of defects, including geometrical errors as well as voids, delamination, cracks, etc., potentially present on the component. Through the cloud platform, the heterogeneous data from the two non-contact metrological techniques are integrated, and the newly developed user interface allows for the simultaneous visualization and analysis of the 3D metrology and ultrasonic information for the detection of geometrical defects and internal flaws of the component under inspection.
2. Cloud manufacturing architecture: three-level structure
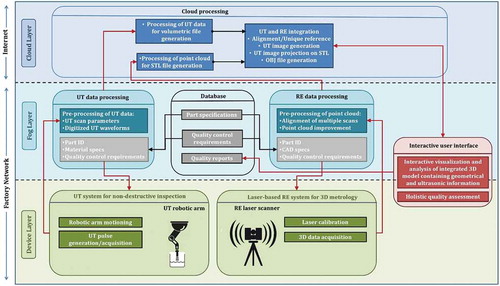
The cloud manufacturing architecture developed to offer on-demand services for holistic quality assurance of manufactured components is based on the three-level structure presented in Figure , consisting of a device layer, a fog layer and a cloud layer. These three levels make up a complex cyber-physical system where the multiple heterogeneous metrological data acquired through end devices at the physical manufacturing site are subsequently processed through two different steps which take place at the fog and at the cloud level, respectively (Rajkumar, Lee, Sha, & Stankovic, Citation2010; Wang et al., Citation2015).
The cloud-fog architecture takes advantage of the networking means to distribute and manage different resources including software, hardware and capabilities. Such possibility is of great benefit for the holistic quality assessment application, as the different non-contact metrological techniques involve high computational efforts due to the high-volume and heterogeneous data to be processed and the specific skills required for each metrological procedure (Schaefer, Citation2014).
By examining the three-level structure of Figure from the bottom to the top, the lowest level is the device layer, where the physical non-contact metrological systems are operated. In particular, two systems are considered, i.e. a UT system for non-destructive inspection and a Laser-based RE system for 3D metrology, so as to inspect a variety of part features and detect possible faults pertaining both to the outer part geometry and the inner material structure (Blitz & Simpson, Citation1995; Raja & Fernandes, Citation2009; Shull, Citation2016; Wang, Citation2010). These metrological systems represent the end devices that are operated within the manufacturing system in order to acquire the necessary data for quality assessment of the manufactured parts. In order to perform networking, data pre-processing and storage tasks close to these devices, the latter are connected to a fog layer within the developed cloud manufacturing framework. The fog layer runs inside the Factory Network level and is responsible for carrying out the pre-processing of the data that will be sent to the cloud layer outside the Factory Network via Internet. The cloud layer is the one where the holistic quality assessment services are provided on-demand by processing the heterogeneous metrological data coming from the fog layer and performing their integration. The integration results are therefore transmitted back to the Factory Network, where an interactive user interface is made available for the 3D visualization and manipulation of the metrological data and the holistic assessment of the manufactured part.
More details on the three-level structure of the developed cloud manufacturing framework are provided in the next sections.
Figure 1. Three-level structure of the cloud manufacturing architecture for part quality assessment
3. Device layer
The device layer of the proposed cloud manufacturing framework is the one where the physical metrological systems are operated to verify potential faults of different nature pertaining to a manufactured part. In order to explore both the external part geometry and the internal material structure, a Laser-based reverse engineering system for 3D metrology and an ultrasonic system for non-destructive inspection are included in the device layer. As a matter of fact, these two systems proved to be highly effective for a wide variety of industrial metrological applications.
On the one hand, reverse engineering procedures found valuable application in manufacturing for purposes such as quality assessment of complex 3D geometries, design and re-design of products, repair and re-manufacturing of flawed parts, due to their capability to obtain the geometrical data and reconstruct the 3D digital models of real parts and products (Raja & Fernandes, Citation2009; T. Segreto, Caggiano, & D’Addona, Citation2013; W. Wang, Citation2010). Among the wide variety of available reverse engineering methods, one of the most widespread and effective non-contact procedures is based on the employment of a laser scanner to accurately acquire the 3D geometry of a physical part or product and achieve a highly accurate digital model. The non-contact nature of this laser-based procedure allows to avoid the risk of compromising the integrity of the part or product under inspection, which is a major concern in these applications (Segreto et al., Citation2017).
On the other hand, in order to inspect the internal material structure, one of the most effective procedures is represented by ultrasonic non-destructive inspection, which employs high-frequency ultrasonic waves transmitted into the part or product under examination by a transducer and received through reflection or transmission, respectively. This non-destructive inspection procedure allows to detect and characterise internal material flaws by identifying their dimension, geometry and position within the inner part volume without compromising the integrity of the part or product under inspection (Blitz & Simpson, Citation1995; Shull, Citation2016).
Due to their high potential and effectiveness in detecting inner part flaws, ultrasonic non-destructive inspection procedures are broadly applied in manufacturing industry for purposes related to quality assessment and material examination (Segreto, Caggiano, & Teti, Citation2016; Segreto, Bottillo, & Teti, Citation2016). For example, they are widely employed on several categories of materials, including metal alloys, composites, etc., to detect flaws on the part surface, subsurface and internal structure, such as voids, inclusions, delamination, cracks, and so on (Langenberg, Marklein, & Mayer, Citation2012; Teti, Citation1990). Another metrological application of ultrasonic non-destructive inspection is part thickness evaluation, particularly important when the part surfaces are accessible only from one side, such as in the case of hollow parts, assembled products or multi-layer components.
3.1. Laser-based reverse engineering system for 3D metrology
The laser-based RE system for 3D metrology utilized at the device layer of the cloud manufacturing framework is a Konica Minolta VI 9i non-contact 3D digitizer that uses the laser-stripe method to emit a horizontal stripe light on the object under examination. The light reflected by the object surface is sensed by a charge-coupled device (CCD) and then converted into a distance information through triangulation. This process is repeated by scanning the stripe light vertically on the object surface obtaining point clouds (3D digital data) which define the object surface geometry. At the device layer, the 3D digitizer is connected to a pc with dedicated software for the 3D data acquisition and device calibration.
The laser-based RE system at the device layer is connected to the associated RE node in the fog layer to retrieve relevant data on the quality control requirements and the specifications of the part under investigation. These data are used for the selection of the appropriate RE acquisition parameters which include the following:
Type of lens to be utilized (i.e. tele, middle and wide) to establish the measurement size range on the basis of the component dimensions.
Scan depth distance, i.e. the distance between the laser beam source and the surface to be acquired.
Depending on the geometry and size of the manufactured part, multiple scans with different part positioning may be required to acquire the entire shape of the object. The output of the laser scanning procedure is a point cloud, i.e. set of x, y, z data points, which is transmitted to the associated RE node in the fog layer for data pre-processing.
3.2. Ultrasonic system for non-destructive inspection
The ultrasonic system for non-destructive inspection included in the device layer of the cloud manufacturing framework (Figure ) is a UT robotic system custom-built at the Fraunhofer Joint Laboratory of Excellence on Advanced Production Technology, Naples, Italy (Fh J_LEAPT, Citationn.d.; T. Segreto, Caggiano, & Teti, Citation2016; Tiziana Segreto, Bottillo, & Teti, Citation2016). The 6-axis robotic arm is provided with a piezoelectric UT probe excited by an oscillator/detector to generate the UT pulses for part scanning. The UT pulses reflected back during part scanning are transmitted to the oscillator/detector that transmits them to a digital oscilloscope employed to acquire, display and digitize the UT pulses. The UT non-destructive inspection procedure is a full volume ultrasonic scan carried out in water through the employment of a focused immersion UT probe allowing for the acquisition of full UT waveforms (Segreto, Bottillo, & Teti, Citation2016).
The UT system for non-destructive inspection at the device layer includes a controller for the robotic arm motioning and one for the UT pulse generation and acquisition.
Based on the part quality control requirements and material specifications, received from the UT node in the fog layer, the following parameters are set: UT probe frequency (to be selected based on the specific part material and thickness); part position and scan origin set-up (to be selected based on the part size and the area to be inspected); scan step size (to be selected based on the level of detail needed for the quality assessment); number of scan steps (to be selected based on the area to be inspected); UT settings connected to the velocity of the UT waves in the part material.
The output of the UT scan procedure consists of digitised UT waveforms, which are transmitted together with the UT scan parameters are sent to the associated UT node within the fog layer for data pre-processing.
4. Fog layer
The fog layer represents an intermediary between the device layer and the high-level cloud layer, with the aim to bring services such as processing, storage and networking nearer to the end devices. This layer performs a key role in data absorption and processing by employing the so-called fog nodes, i.e. devices provided with computing, storage and network connectivity (like industrial controllers, embedded servers, etc.). A major advantage of using the fog layer is that the fog nodes can be installed in diverse locations and they offer lower latency times in processing the data of end devices. Moreover, the fog layer allows to process selected data locally rather than directly send them to the cloud for analysis, thus lowering the operating cost related to the network bandwidth, and it is able to operate on the different platforms of the heterogeneous fog nodes (Atlam et al., Citation2018).
In the developed cloud manufacturing framework, the fog layer is responsible for performing the pre-processing of the data acquired using the two non-contact metrological systems (i.e. the end devices) and for storing the key data related to the quality assessment of the manufactured parts. To this aim, a database is included in the fog layer to provide the data storage service. Moreover, two different fog nodes, one for UT data processing and one for RE data processing, are employed as fog computing units, so that the data coming from the two metrological systems at the device layer are sent to the associated fog node for pre-processing (Mishra et al., Citation2018).
4.1. Data management in the fog layer
The fog layer performs data management tasks including storage and transmission of the data required for the quality assessment of the manufactured part. To this aim, a database is available in this layer to collect records such as part specifications (e.g. part ID, part geometry specifications (CAD), material specifications) and quality control requirements, as well as to save the final quality reports generated via the on-demand services. The relevant part specifications and quality control requirements are separately transmitted to the UT and RE fog nodes as they represent the essential information for setting up the UT and RE metrological procedures at the device layer. The UT and RE fog nodes also receive from the associated metrological systems the acquired data to be pre-processed before transmitting it to the cloud layer.
Moreover, the database receives the quality assessment reports of the manufactured parts produced through the interactive user interface, so that a collection of the reports relative to each inspected manufactured part is progressively created.
4.2. RE data pre-processing
The RE node within the fog layer is in charge of pre-processing the data coming from the associated Laser-based RE system for 3D metrology. These data consist of a large-volume point cloud describing the outer geometry of the inspected part through a set of acquired x, y, z data points. At the RE fog node, point cloud pre-processing is performed via alignment of the multiple scans and point cloud improvement so as to achieve a clean and filtered point cloud with reduced volume of data to be transmitted to the cloud layer for subsequent processing.
When the part to be inspected is characterized by a complex geometry or large size, multiple scans are carried out during the laser scanning phase, resulting in several partially overlapped point clouds: alignment of the multiple scans is then performed to produce a single non-redundant x,y,z data set describing the whole part under inspection. To perform the alignment procedure, an adequate overlap among the multiple scans is necessary to allow for the generation of a single global point cloud.
As regards the improvement of the acquired point cloud, several operations can be applied to clean and reduce the volume of digital data, including noise and overlap reduction, removal of superfluous points, and grid spacing.
Afterwards, the obtained pre-processed point cloud is transmitted by Hypertext Transfer Protocol Secure (HTTPS) data communication protocol to the cloud layer for advanced processing aimed at the construction of the STL file. HTTPS encrypted using Transport Layer Security (TLS) allows for secure communication through authentication, protection of the privacy and integrity of the exchanged data in transit.
4.3. UT data pre-processing
The UT node within the fog layer is in charge of pre-processing the data coming from the associated UT system for non-destructive inspection. Specifically, two types of data are transmitted to the UT node from the UT metrological system: the UT scan parameters and the digitised UT waveforms.
The UT scan parameters include all the relevant data concerning the executed UT scan that are useful to interpret the output scan results. These data include the frequency of the UT probe, the step size employed for scanning, the number of scan steps performed in X and Y directions.
The UT waveforms represent the actual output of the scanning procedure. The format of the scan output data is determined by the specific UT scanning system and calls for a conversion by the fog node into a format which can be interpreted by the processing module within the cloud layer. Data pre-processing within the UT fog node involves the arrangement of the UT waveforms in form of a 3D matrix, the rows and columns of which represent the coordinates (x and y) of the scan points while the third dimension comprises the full-digitized UT waveform for each scan point.
The data pre-processed by the fog node are then transmitted to the cloud layer through HTTPS data communication protocol.
5. Cloud layer
The cloud layer is the highest level of the cloud manufacturing structure, which collects the pre-processed data transmitted from the RE and UT fog nodes and performs their integration on demand according to the user needs. Integrating the heterogeneous data coming from the different metrological systems allows to achieve the holistic quality assessment of the manufactured part by including a variety of part features and detect possible defects associated with the outer part geometry as well as the inner material structure.
The holistic part quality assessment is offered as on-demand service in the cloud layer by using three processing modules (Figure ): one module is dedicated to RE data processing, i.e. from the point cloud to the STL file construction; the second module is in charge of processing the UT data for generating a UT volumetric file; the third module is the one where the actual integration of the UT and RE data is carried out with the aim to allow for the final 3D visualization and manipulation of the heterogeneous data into a single-interactive user interface and the holistic part quality assessment.
5.1. RE data processing in the cloud layer
The first module of the cloud layer is dedicated to the processing of the RE data coming from the RE node in the fog layer. Specifically, the pre-processed point cloud is further elaborated with the aim to generate the 3D digital model representing the outer part geometry to be employed for the final quality assessment.
Various file formats can be adopted for creating the 3D digital model from a point cloud: the STL file format is one of the most widely employed file formats describing the surface geometry of a 3D object without any colour, texture or other common attributes of CAD models. STL files represent an object as raw triangulated surfaces defined by the unit normal and vertices of the triangles using a 3D coordinate system.
With the aim to create an STL file of the inspected part, the pre-processed point cloud received from the RE fog node is further processed in the cloud layer. Specifically, a polygon mesh is created starting from the point cloud by drawing triangular surfaces that connect every three data points through a wrapping operation. Additional processing can be also applied to the polygon mesh to enhance the polygonal model through repair and optimization editing operations.
The repair operations applicable to the polygonal model involve smoothing (for vertices and triangles), poor areas reconstruction, holes and gaps filling through triangulation of the adjacent vertices. The optimization operations applicable to the polygonal model involve polygon reduction (to cut the number of triangles, so as to reduce the volume of information of the digital output file), triangles segmentation (employed on selected areas to enhance curvature description), triangles equiangularity enhancement (to uniformly sample the surface).
After the editing operations, the improved polygonal model is saved under STL file format to be utilized for the 3D object visualization and manipulation in the interactive user interface.
5.2. UT data processing in the cloud layer
The second module of the cloud layer is dedicated to processing of the UT data coming from the RE node in the fog layer. Specifically, the aim is to create the UT images to be employed for the recognition of potential defects related to the inner material structure of the part.
Based on the data coming from the UT fog node, the UT data processing module in the cloud layer is in charge of constructing a volumetric file combining the part specifications, the UT scan parameters and the digitised UT waveforms.
From this volumetric file, UT images of the part under inspection are produced starting from the digitized full UT waveforms using an 8-bit grey tone scale where the grey scale limits correspond to the minimum and maximum values of peak amplitude found in all the UT waveforms. By choosing a definite time window on the UT waveforms, the data related to that specific material portion are selected for image generation. Hence, the produced UT images can either describe the whole part thickness or a sub-portion of the part thickness, i.e. a certain depth range. Additionally, the UT data processing module allows to further split the time window into several time sub-windows with the aim to display together the UT images associated with several thickness portions at diverse depths inside the part thickness.
5.3. UT and RE integration in the cloud layer
The cloud layer is where the actual integration of the UT and RE metrological data is performed so as to allow for their simultaneous visualization and management on a 3D model.
The initial step to perform this integration is the definition of a common 3D coordinate system for aligning the UT and RE metrological data. Actually, the two non-contact metrological procedures produce individual representations of the part under inspection each consistent with its own coordinate reference system. Consequently, as a straight integration of the data is not allowed, it is necessary to appropriately align the coordinates of the object surface in the STL file and the coordinates of the UT scan points. Only after the alignment, it will be possible to select an area to be inspected on the 3D model (the STL file) and to obtain the associated UT images produced by the UT data processing module. The UT images can be therefore projected on the 3D model for displaying the inner material structure. The 3D model integrated in this way can be exported as an OBJ file which allows to represent the 3D object geometry (provided by the STL file) together with the projected UT image.
6. Interactive visualization and analysis of integrated 3D model
The interactive visualization and analysis of integrated 3D model containing geometrical and ultrasonic information as well as the holistic quality assessment of the manufactured part are realized using an interactive user interface at the factory level. This interface is characterized by the following elements:
Search field—this is the field where the user is enabled to specify the part ID in order to retrieve the associated integrated 3D model.
3D screen—this screen is employed for visualization/manipulation of the 3D integrated model of the selected part.
Data table—this table is utilized to display the information on the part specifications (e.g. part ID, part geometry specifications (CAD), material specifications) and quality control requirements.
Toolbar with graphical buttons—this toolbar allows to change the selection mode, i.e. the type of tool to hand-pick the area of interest on the 3D model.
3D window for RE quality assessment—this window is employed for assessing the part quality with reference to the RE metrological results. A dynamic tab allows to retrieve the nominal CAD file of the part to be evaluated in order to make a comparison with the acquired STL file of the actual part so as to measure any geometric deviation. Within the 3D window, the STL polygonal model is aligned to the nominal CAD model which is employed as a reference to measure the 3D geometric deviations (expressed as xyz resultant) between the two surfaces. A mean deviation coloured map is produced by calculating the signed mean deviation between the CAD model and the polygonal model for every point on the surface. Finally, this coloured map is recorded together with the associated data, i.e. max deviation, min deviation and standard deviation, with the aim to fill up the reserved field inside the final holistic quality assessment report.
3D window for UT quality assessment—this window is employed for assessing the part quality with reference to the UT metrological results. The area to be inspected can be hand-picked on the 3D model using a toolbar with graphical buttons. As the UT metrological results go in-depth within the part volume, the user is enabled to define through a numeric up/down control the specific depth range under analysis within the part thickness. This depth range can correspond to the full part thickness or to a precise thickness sub-portion. After selecting the depth range, the associated UT images produced at the cloud level are retrieved and projected on the 3D surface of the object.
This 3D model can be handled by the user (through operations such as rotation, zoom in, zoom out, etc.) so as to accurately examine the critical part areas. When a defect is identified, by picking the related area on the 3D model, the user is allowed to get the associated UT image and save it together with the defect features (including defect type, size, position and depth) in the reserved field within the final holistic quality assessment report.
As soon as the part quality assessment report is filled up with the RE and UT metrological results, it is transmitted to the database in the fog layer so that a collection of the reports relative to each inspected manufactured part is progressively created.
7. Case study
The previously presented cloud manufacturing framework is validated for the holistic quality assessment of a composite material component employed in the aeronautical industry.
Nowadays, one of the major advancements of the aircraft industry towards the reduction of the aircraft weight and utilization costs is realized with the widespread introduction of composite materials (Tiziana Segreto, Bottillo, Caggiano, & Martorelli, Citation2019). However, one of the most critical issues related to the aircraft composite structures is their exposition to impact loads (i.e. bird strike, hail or tool-drop) during their service life, which could lead to the unexpected failure of the aircraft. Moreover, a large number of defects (e.g. delamination, cracks, voids, fibres fractures, etc.) can occur during composite material parts manufacturing (Fleischer et al., Citation2018; Segreto et al., Citation2019). Therefore, over the last 50 years, non-destructive inspection (NDI) techniques have been proved to be an efficient tool for the detection of damages during part manufacturing as well as service life (Langenberg et al., Citation2012; Segreto et al., Citation2019; Teti, Citation1990). The results of the NDI methods are unfortunately analysed separately. The developed cloud manufacturing architecture permits to interactive visualize and manipulate the 3D model integrating the two non-destructive inspection results into a single-interactive user interface obtaining a holistic evaluation of the aeronautical part.
7.1. The aeronautical part under inspection
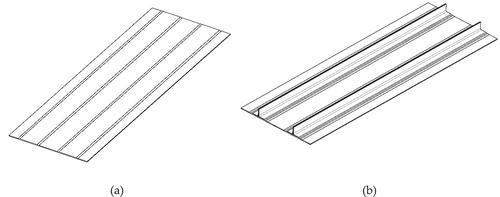
The composite material component employed in the aeronautical industry is a carbon fibre-reinforced polymer (CFRP) panel to be inspected by using the two non-contact metrological procedures to measure part features and detect possible defects associated to the outer part geometry as well as the inner material structure. The CFRP panel presents a front and back surface (Figure ) with the following characteristics:
Material: CFRP multidirectional laminate consisting of multiple unidirectional prepreg plies made of CYCOM 977–2 epoxy matrix and Toray T300 carbon fibres;
Front surface: it is the base panel, also known as skin, composed of 17 plies with symmetrical stacking sequence [+45/90/02/-452/+45/0]s. The laminate nominal size is 304.8 × 914.4 mm;
Back surface: it displays two stringers with 5.7 × 914.8-mm nominal size. These laminates are made of 11 plies symmetrically disposed with stacking sequence [+45/90/0/-45/0]s.
Figure 2. CAD model of the aeronautical CFRP component: (a) the front and (b) the back surface
7.2. Device layer: non-contact metrological systems
The two diverse non-contact metrological systems described in section 3 are employed at the device layer for the acquisition of the external geometry and the internal material structure of the CFRP aeronautical component. The next sections illustrate the applied non-contact inspection procedures.
7.2.1. Laser-based RE system
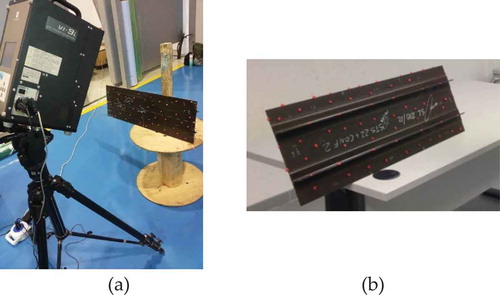
The quality control requirements retrieved from the RE node in the fog layer call for the acquisition of the entire geometry of the aeronautical CFRP component. Therefore, the scanning parameters were selected for acquiring the whole part geometry. First of all, the component was placed in two diverse positions on the front and back sides, therefore requiring two separate RE acquisition sessions (Figure ). For both the two point clouds acquisition, the 3D digitizer was placed at a scan distance equal to 600 mm and a telephoto lens was utilized due to its high precision and accuracy levels. Moreover, a number of reference markers (red dots in Figure ) were attached to the CFRP component in order to easily carry out the subsequent multiple scans alignment procedure. A total number of 46 scans were performed for fully acquiring the front and back surfaces. The obtained highly dense point clouds (summing up to a total of over 12 million points) were transmitted to the RE node in the fog layer for their pre-processing.
Figure 3. Laser-based RE acquisition of the: (a) front and (b) back side of the CFRP aeronautical part (Tiziana Segreto et al., Citation2019)
7.2.2. Non-destructive UT inspection system
Based on the CFRP component quality inspection requirements as well as the material specifications, retrieved from the UT node in the fog layer, a full volume (FV) UT scan procedure based on the pulse-echo technique was executed in water with the following settings:
Immersion UT probe with 5-MHz frequency and 4-mm diameter;
CFRP part positioned with origin at the low-left corner of the CFRP part front side (Figure ));
Scanning area of 305 mm x 915 mm;
Scan step equal to 1 mm;
UT waves velocity equal to 3000 m/s.
After the FV scan, the digitised UT waveforms and the scan parameters were transmitted to the associated UT node in the fog layer for data pre-processing.
7.3. Fog layer: pre-processing of the RE and UT data
The acquired RE point clouds and UT data were subjected to a pre-processing phase at the fog layer of the cloud manufacturing structure.
7.3.1. RE data pre-processing
During the laser-based acquisition of the outer part geometry, two point clouds, each consisting of several scans, were collected to acquire both the front and back surfaces of the CFRP panel. A proper registration of the two point clouds was necessary in order to obtain a single final point cloud. By using the applied markers, the alignment of the acquired point clouds was easily performed at RE node of the fog layer obtaining a single point cloud of the external geometry of the CFRP component. The resulting point cloud was then improved through a series of operations including deletion of unnecessary points, point cloud filtering, noise and overlap reduction, aimed at cleaning the point cloud and reducing the high volume of RE data to be transmitted to the cloud layer.
7.3.2. UT data pre-processing
The UT node in the fog layer received from the UT NDI robotic system data related to the UT scan parameters and the digitised UT waveforms, with file extension driven by the scan software utilized at the device layer and requiring conversion into a format readable by the subsequent processing module at the cloud layer. Data pre-processing at the UT node in the fog layer consisted of the organization of the UT waveforms as a 3D matrix, where the rows and columns correspond to the x and y coordinates of the scan points while the third dimension includes the full-digitized UT waveform for each scan point. These pre-processed data were saved under binary file format and sent via HTTPS data communication protocol to the cloud server.
7.4. Cloud layer
In view of the holistic quality assessment of the CFRP panel, the cloud layer collected the pre-processed data transmitted from the RE and UT fog nodes and performed their integration to identify features and defects related to the panel outer geometry and inner material structure. The processing modules at the cloud layer performed three main tasks:
Processing of point cloud for STL file generation
Processing of UT data for volumetric file generation
Integration of the UT and RE data
7.4.1. Processing of point cloud for STL file generation
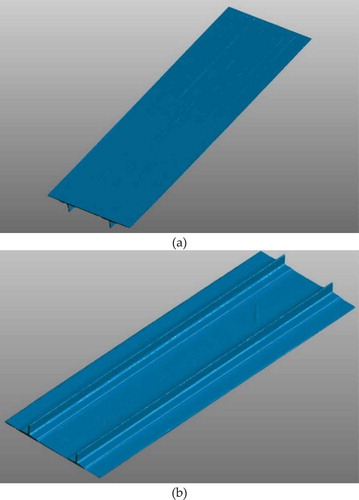
The first module of the cloud layer utilized the RE point cloud received from the fog layer for the creation of the 3D digital model (STL file) representing the outer geometry of the CFRP panel. The STL file approximates the point cloud by means of triangles defined by a perpendicular direction and three points representing the vertices of the triangle in the 3D coordinate system, thus obtaining the polygon mesh. Starting from the improved point cloud sent by the RE fog node, a polygon mesh with 2.545.281 triangles was obtained. This mesh was then subjected to a repairing and optimization phase including smoothing of the triangles, holes and gaps filling for the reconstruction of the incomplete triangles, and polygon triangle reduction.
In Figure , the two 3D views of the STL file obtained for the aeronautical CFRP panel are shown.
Figure 4. STL of the aeronautical CFRP component: 3D view of the (a) front and (b) back surface
7.4.2. Processing of UT data for volumetric file generation
The UT data processing at cloud level is performed to construct a volumetric file combining the part specifications, the UT scan parameters and the digitised UT waveforms with the final aim to generate UT images to be used for defect or damage detection of the CFRP inner material structure.
This volumetric file, save under binary format, contains the whole information regarding the part specifications, the UT scan parameters and the UT full-digitized waveform for each x and y scan point, and can be used to generate UT images according to the following procedure.
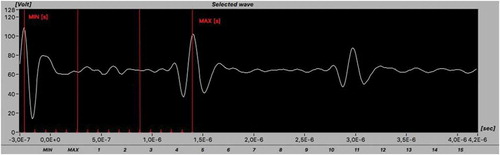
Given a scan point of x and y coordinates, the corresponding UT waveform is represented with a diagram where the x-axis corresponds to the time expressed in seconds whereas the y-axis corresponds to the UT signal in Volts (Figure ). The time axis represents the UT propagation in the thickness direction of the CFRP component. As mentioned in Section 5, the UT waveform is processed to obtain an 8-bit greyscale picture. The 8-bit grey tone scale is established by setting as 0 (black) and 255 (white) grey scale limits the minimum and maximum values of peak amplitude detected in the full volumetric file. By using a time gate subdivision (red lines in Figure ), the UT signal can be split into a desired number (from 1 to 16) of equal sub-gates, each describing the internal material structure of the corresponding thickness portion of the CFRP panel, that will be used for UT images generation.
Figure 5. Typical UT waveform of the aeronautical CFRP component
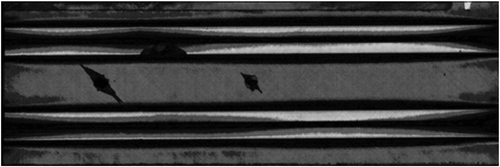
The UT image of the CFRP panel generated using the last time sub-gate of Figure is shown in Figure .
Figure 6. Generated UT image of the CFRP aeronautical component
7.4.3. Integration of the UT and RE data
This module is responsible for the effective integration of the UT and RE metrological data into a single-interactive user interface available at the factory level.
The identification of a unique 3D coordinate system was required as each metrological procedure provided a representation of the inspected object in its own coordinate reference system, preventing a direct integration of the data. Therefore, the origin of the STL file was translated and set on the low-left corner of the CFRP aeronautical component and the x and y axes were aligned to its two main borders following the same alignment of the UT scan procedure. Therefore, a correspondence between the coordinates of the STL file and the coordinates of the UT scan points was established.
Once the new and unique reference system has been established, the STL 3D model can be used as reference surface for both UT and RE inspection. In particular, a scan point on the STL 3D model can be selected from the user and the corresponding UT complete waveform is reclaimed from the UT data file. The UT waveform is plotted on an x-y graph for user display and then UT images of the inner material structure can be visualized by selecting the time gates as described in the previous section.
The generated UT image is then projected and wrapped on the STL 3D model by matching the x and y coordinates of the scan point with the relative pixel of the UT image (Figure ).
The final integrated 3D model can be saved as an OBJ file comprising the 3D object geometry (provided by the STL file) as well as the projected UT image.
7.5. Interactive user interface
At the factory level, the previously described module permits the interactive visualization and investigation of the 3D model integrating the results of the two metrological procedures. In particular, the main panel of the interactive user interface developed in LabVIEW environment is a graphic window where the information related to UT and RE inspection procedures are shown separately as well as together (Figure ). In particular, four main fields are included: Part ID, UT module, RE module and Integrated 3D model.
Figure 7. Interactive user interface at the factory level
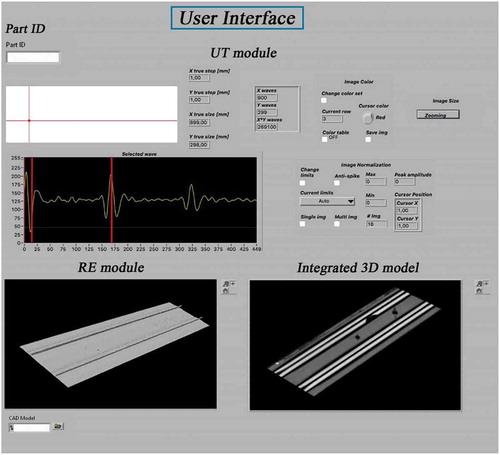
The Part ID field is where the user is able to select the part under inspection by writing its ID number. Once the ID number is inserted by the user, the generated STL file of the CFRP component is retrieved and shown in the 3D window of the RE module. In this window, it is also possible to use a dynamic tab for importing the part CAD file for geometrical comparison with the generated STL model by measuring the geometric deviations. Using this choice, a pop-up window appears and the CAD geometry is loaded. The CAD of the part is used as reference model and the polygonal model is aligned to it either by matching a minimum of three reference points on both models or by a “best fitting” algorithm that manipulates the position and orientation so as to minimize the error between the polygonal and the CAD model. By using a coloured contour map, it is possible to measure the three-dimensional deviations between the two models. The results of this option are summarised in the report field dedicated to the geometrical quality control of the part and are sent to the database.
Starting from the loaded STL model, a user can select any point on the surface (by using a red marker) and, considering its x and y coordinates, retrieve the corresponding full UT waveform for the UT quality assessment of the part. All the options available for UT inspection are shown in the UT module of Figure and explained below:
2D window representing the sample dimensions (white rectangle in Figure XXX) with two intersecting red lines for the selection of a specific a UT scan point (x and y coordinates);
UT scan information: the selected x and y coordinates, the number of steps in the x and y directions and the relative number of the detected waves are reported;
UT image analysis: it is possible to select, zoom and modify the UT image;
Change limits button: this button is used for setting the time gates subdivision in order to generate the corresponding UT images.
The selected UT image is then projected and wrapped on the STL model by matching the x and y coordinates of the scan point with the relative pixel of the UT image. Therefore, an integrated 3D model is created containing both the 3D geometrical representation (provided by the STL file) and the UT information and it is displayed in the module called “Integrated 3D model” of Figure .
In order to inspect the part in more detail, the user can manipulate the integrated 3D model and select the critical areas containing potential defects. When a defect is identified, by selecting the area on the 3D model, the user is allowed to get the associated UT image and save it together with the defect features (including defect type, size, position and depth) in the reserved field within the final holistic quality assessment report.
When the part quality assessment report is filled up with the RE and UT metrological results, it is transmitted to the database in the fog layer.
7.6. Results of the integrated UT and RE inspection of the CFRP component
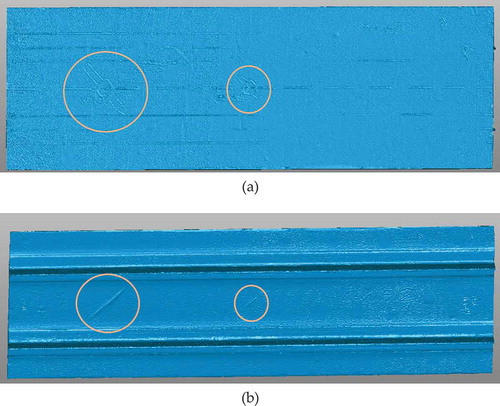
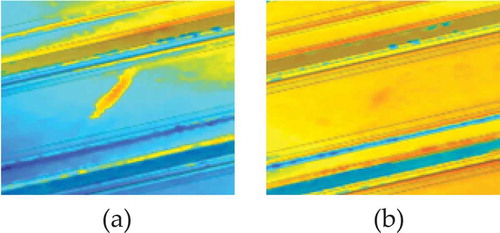
The geometrical quality control of the CFRP component carried out on the generated STL model is shown in Figure . The STL model obtained through the RE metrological procedure highlighted the presence of two distinct surface damages on the front and back side of the CFRP panel. These damages are visible and circled in Figure and are related to the impact tests to which the CFRP component was subjected for validating the RE and UT metrological procedures.
Figure 8. Impact damages on the (a) front and (b) back surface of the CFRP panel
The comparison between the generated STL model and the nominal CAD geometry allowed to measure the deviations between them, resulting in a standard deviation of 0.5879 mm, a maximum positive deviation of 2.1445 mm and a maximum negative deviation of −4.4209 mm. The 3D deviation coloured map produced by calculating the signed mean deviation between the CAD model and the polygonal model for every point on the surface is reported in Figure with reference to the areas highlighted in Figure including the two defects. These maps clearly show the presence of defects on the external part geometry and allow for a rapid detection of their shape and size.
Figure 9. Comparison between CAD model and constructed STL file around the defects
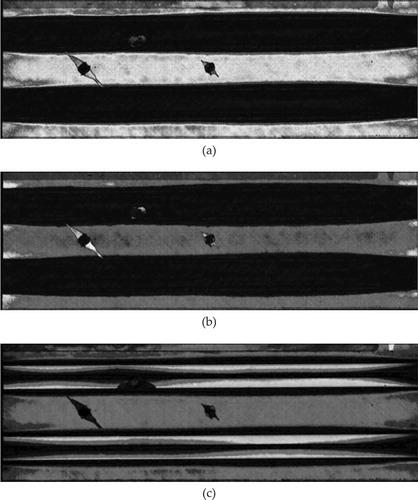
However, the implementation of the UT metrological procedure was required to verify the presence of defects also inside the material structure. The two impact damages were also detected at different depth ranges within the part thickness through the UT metrological procedure, as shown in Figure . By examining the obtained 2D UT image, it is possible to verify the presence of the same impact defects highlighted by the RE module also inside the part material, measure their extension at different depth ranges and estimate their position within the thickness direction, given the UT velocity in the CFRP composite material and the time-of-flight, i.e. the time the UT signal takes to traverse to and fro the complete panel thickness.
Figure 10. UT images of the inner material structure of the CFRP aeronautical panel at three different depth ranges within the part thickness (each corresponding to 1/3 of the part nominal thickness)
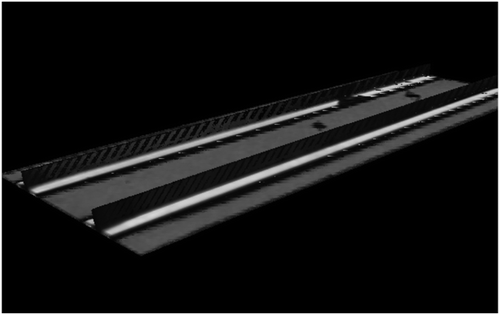
Moreover, by selecting the desired UT image corresponding to a specific depth range, it is possible to project it on the 3D STL model of the part, thus allowing to examine together the outer part geometry and the inner material structure in the Integrated 3D model window, as shown in Figure .
Figure 11. Integrated 3D model of the CFRP panel with UT image of the inner material structure projected on the STL model of the exterior geometry
8. Conclusions
A three-level cloud manufacturing architecture including a device layer, a fog layer and a cloud layer was developed to offer services aimed at the holistic quality assessment of manufactured parts. The proposed architecture takes advantage of the cloud and fog capabilities to integrate complex heterogeneous data generated from two non-contact metrological procedures, i.e. 3D metrology via laser-based reverse engineering (RE) and non-destructive inspection via ultrasonic testing (UT). The combination of these two metrological procedures allows to inspect a variety of part features and detect possible faults pertaining both to the outer part geometry and the inner material structure.
The three levels of the cloud manufacturing architecture make up a complex cyber-physical system where the multiple heterogeneous metrological data acquired through end devices at the physical manufacturing site are subsequently processed through two different steps which take place at the fog and at the cloud level, respectively. The fog layer runs inside the factory network level and is responsible for carrying out the pre-processing of the metrological data that will be sent to the cloud layer outside the factory network via Internet. The cloud layer is the one where the holistic quality assessment services are provided on-demand by processing the heterogeneous metrological data coming from the fog layer and performing their integration. The integration results are therefore transmitted back to the Factory Network, where an interactive user interface is made available for the 3D visualization and manipulation of the metrological data and the holistic assessment of the manufactured part.
The developed architecture was validated on a composite material component employed in the aeronautical industry to be inspected by using the two non-contact metrological procedures to measure part features and detect possible defects due to part manufacturing or service life. With reference to this application, all the modules of the cloud manufacturing architecture were illustrated and the benefits of the proposed cloud-based service were presented, including the possibility to inspect the component using two diverse non-contact inspection techniques at the same time, the detection of outer and inner defects and their localization within the component thickness, the measurement of geometric deviations of the RE digital model compared to the CAD model.
The proposed cloud architecture offers the advantage to outsource the computational intensive operations required to integrate the RE and UT metrological data to the cloud and allows users to interactively handle the 3D digital model of the inspected part, choose any area of interest and project on the 3D model the associated UT images describing the internal structure of the part.
Following this approach, future developments will include the enhancement of the cloud architecture scalability by integrating within the cloud service additional quality inspection procedures based on the collection of data from multiple diverse measurement systems (such as thermography, X-ray, eddy current) which can be physically distributed in different areas and share their heterogeneous data via the cloud.
Moreover, the proposed cloud manufacturing architecture is particularly suitable to apply machine learning techniques that may be difficult to apply at the factory level, for example by constructing a database of part defects that can be employed for training machine learning procedures based on artificial neural networks or deep learning for automated defect recognition and classification.
Acknowledgements
The research activities presented in this paper were carried out in the framework of the project CLOUD MODE “CLOUD Manufacturing for On-Demand manufacturing sErvices” (000011–ALTRI_DR_ 3450_2016 _ RICERCA_ATENEO-CAGGIANO) funded by the University of Naples Federico II within the “Programma per il finanziamento della ricerca di Ateneo” (2016–2019).
The Fraunhofer Joint Laboratory of Excellence on Advanced Production Technology (Fh-J_LEAPT UniNaples) at the Department of Chemical, Materials and Industrial Production Engineering, University of Naples Federico II, is gratefully acknowledged for its support to this research activity.
Additional information
Funding
Notes on contributors
Alessandra Caggiano
Alessandra Caggiano is Assistant Professor of Manufacturing Technology and Systems at the University of Naples Federico II and member of the Fraunhofer Joint Laboratory of Excellence on Advanced Production Technology (Fh-J_LEAPT UniNaples). Her research activities focus on advanced manufacturing technology and systems, smart sensor monitoring of manufacturing processes, machine learning, cloud manufacturing, cyber-physical systems and digital factory technologies. She is PI of the project “CLOUD Manufacturing for On-Demand manufacturing sErvices”. She has been involved as active researcher in several European Framework projects as well as national research projects. She participated in national and International Conferences and she published papers in peer reviewed high impact journals and conference proceedings in the scientific sector of Manufacturing Technology and Systems. She was Research Affiliate Member of the International Academy for Production Engineering (CIRP) and she is Member of the Italian Association of Manufacturing Technology (AITEM), Italy.
References
- Atlam, H., Walters, R., & Wills, G. (2018). Fog computing and the Internet of Things: A review. Big Data and Cognitive Computing, 2(2), 10. doi:10.3390/bdcc2020010
- Blitz, J., & Simpson, G. (1995). Ultrasonic methods of non-destructive testing (Vol. 30). Netherlands: Springer.
- Caggiano, A. (2018). Cloud-based manufacturing process monitoring for smart diagnosis services. International Journal of Computer Integrated Manufacturing, 31(7), 612–21. doi:10.1080/0951192X.2018.1425552
- Caggiano, A., Segreto, T., & Teti, R. (2016). Cloud manufacturing framework for smart monitoring of machining. Procedia CIRP, 55, 248–253. doi:10.1016/j.procir.2016.08.049
- Caggiano, A., Segreto, T., & Teti, R. (2018). Cloud manufacturing on-demand services for holistic quality assurance of manufactured components. Procedia CIRP, 67, 144–149. doi:10.1016/j.procir.2017.12.191
- Fei, T., Yue, T., Xiaofu, Z., & Qinglin, Q. (2019). A field programmable gate array implemented fibre channel switch for big data communication towards smart manufacturing. Robotics and Computer-Integrated Manufacturing, 57(September2018), 166–181. doi:10.1016/j.rcim.2018.12.005
- Fh J_LEAPT, U. (n.d.). Fraunhofer joint laboratory of excellence on advanced production technology - Fh J_LEAPT UniNaples. Retrieved from http://www.jleapt-unina.fraunhofer.it/
- Fleischer, J., Teti, R., Lanza, G., Mativenga, P., Möhring, H. C., & Caggiano, A. (2018). Composite materials parts manufacturing. CIRP Annals, 67(2), 603–626. doi:10.1016/j.cirp.2018.05.005
- Gao, R., Wang, L., Teti, R., Dornfeld, D., Kumara, S., Mori, M., & Helu, M. (2015). Cloud-enabled prognosis for manufacturing. CIRP Annals—Manufacturing Technology, 64(2), 749–772. doi:10.1016/j.cirp.2015.05.011
- Langenberg, K. J., Marklein, R., & Mayer, K. (2012). Ultrasonic nondestructive testing of materials: Theoretical foundations. Ultrasonic nondestructive testing of materials: Theoretical foundations. CRC Press. doi:10.1201/b11724
- Li, B. H., Zhang, L., Wang, S. L., Tao, F., Cao, J. W., Jiang, X. D., … Chai, X. D. (2010). Cloud manufacturing: A new service-oriented networked manufacturing model. Computer Integrated Manufacturing Systems, CIMS, 16(1), 1–7.
- Liu, Y., Wang, L., Wang, X. V., Xu, X., & Zhang, L. (2018). Scheduling in cloud manufacturing : State-of-the- art and research challenges. International Journal of Production Research, 7543, 1–26. doi:10.1080/00207543.2018.1449978
- Lu, Y., & Xu, X. (2019). Cloud-based manufacturing equipment and big data analytics to enable on-demand manufacturing services. Robotics and Computer-Integrated Manufacturing, 57(June2018), 92–102. doi:10.1016/j.rcim.2018.11.006
- Mishra, D., Roy, R. B., Dutta, S., Pal, S. K., & Chakravarty, D. (2018). A review on sensor based monitoring and control of friction stir welding process and a roadmap to Industry 4.0. Journal of Manufacturing Processes, 36(September), 373–397. doi:10.1016/j.jmapro.2018.10.016
- Mocanu, S., Geampalia, G., Chenaru, O., & Dobrescu, R. (2018). Fog-based solution for real-time monitoring and data processing in manufacturing. 2018 22nd International conference on system theory, control and computing, ICSTCC 2018—Proceedings (pp. 504–509). doi:10.1109/ICSTCC.2018.8540783
- Mourad, M. H., Nassehi, A., Schaefer, D., & Newman, S. T. (2020). Robotics and computer-integrated manufacturing. Assessment of Interoperability in Cloud Manufacturing, 61(June2019), 101832. doi:10.1016/j.rcim.2019.101832
- Mouradian, C., Naboulsi, D., Yangui, S., Glitho, R. H., Morrow, M. J., & Polakos, P. A. (2018). A comprehensive survey on fog computing: State-of-the-art and research challenges. IEEE Communications Surveys and Tutorials, 20(1), 416–464. doi:10.1109/COMST.2017.2771153
- Mourtzis, D., Vlachou, E., Milas, N., & Xanthopoulos, N. (2016). A cloud-based approach for maintenance of machine tools and equipment based on shop-floor monitoring. Procedia CIRP, 41, 655–660. doi:10.1016/j.procir.2015.12.069
- Mourtzis, D., Vlachou, E., Xanthopoulos, N., Givehchi, M., & Wang, L. (2016). Cloud-based adaptive process planning considering availability and capabilities of machine tools. Journal of Manufacturing Systems, 39, 1–8. doi:10.1016/j.jmsy.2016.01.003
- Raja, V., & Fernandes, K. J. (2009). Reverse engineering an industrial perspective. In Springer (pp. 319–353). Springer International Publishing. doi:10.1007/978-3-319-13776-6_12
- Rajkumar, R., Lee, I., Sha, L., & Stankovic, J. (2010). Cyber-physical systems: The next computing revolution. In Proceedings—Design automation conference (pp. 731–736). doi:10.1145/1837274.1837461
- Schaefer, D. (2014). Cloud-based design and manufacturing (CBDM): A service-oriented product development paradigm for the 21st century (pp. 9783319073989). Springer International Publishing. doi:10.1007/978-3-319-07398-9
- Segreto, T., Bottillo, A., Caggiano, A., & Martorelli, M. (2019). Integration of reverse engineering and ultrasonic non-contact testing procedures for quality assessment of CFRP aeronautical components. Procedia CIRP, 79, 343–348. doi:10.1016/j.procir.2019.02.082
- Segreto, T., Bottillo, A., & Teti, R. (2016). Advanced ultrasonic non-destructive evaluation for metrological analysis and quality assessment of impact damaged non-crimp fabric composites. In Procedia CIRP (Vol. 41, pp. 1055–1060). Elsevier B.V. doi:10.1016/j.procir.2015.12.125
- Segreto, T., Bottillo, A., Teti, R., Galantucci, L. M., Lavecchia, F., & Galantucci, M. B. (2017). Non-contact reverse engineering modeling for additive manufacturing of down scaled cultural artefacts. In Procedia CIRP (Vol. 62, pp. 481–486). Elsevier B.V. doi:10.1016/j.procir.2017.03.042
- Segreto, T., Caggiano, A., & D’Addona, D. M. (2013). Assessment of laser-based reverse engineering systems for tangible cultural heritage conservation. International Journal of Computer Integrated Manufacturing, 26, 9. doi:10.1080/0951192X.2013.799781
- Segreto, T., Caggiano, A., & Teti, R. 2016. Quality assurance of brazed copper plates through advanced ultrasonic NDE. In Procedia CIRP (Vol. 55). doi: 10.1016/j.procir.2016.08.048
- Shull, P. J. (2016). Nondestructive evaluation: Theory, techniques, and applications. Nondestructive evaluation: Theory, techniques, and applications. United States: CRC Press.
- Simeone, A., Caggiano, A., Boun, L., & Deng, B. (2019). Intelligent cloud manufacturing platform for efficient resource sharing in smart manufacturing networks. Procedia CIRP, 79(July), 233–238. doi:10.1016/j.procir.2019.02.056
- Simeone, A., Caggiano, A., Deng, B., Zeng, Y., & Boun, L. (2018). Resource efficiency optimization engine in smart production networks via intelligent cloud manufacturing platforms. Procedia CIRP, 78, 19–24. doi:10.1016/j.procir.2018.10.003
- Tao, F., Qi, Q., Liu, A., & Kusiak, A. (2018). Data-driven smart manufacturing. Journal of Manufacturing Systems, 48, 157–169. doi:10.1016/j.jmsy.2018.01.006
- Tao, F., Zhang, L., Venkatesh, V. C., Luo, Y., & Cheng, Y. (2011). Cloud manufacturing: A computing and service- oriented manufacturing model. Proceedings of the Institution of Mechanical Engineers, Part B: Journal of Engineering Manufacture, 225(10), 1969–1976. doi:10.1177/0954405411405575
- Tapoglou, N., Mehnen, J., Vlachou, A., Doukas, M., Milas, N., & Mourtzis, D. (2015). Cloud-based platform for optimal machining parameter selection based on function blocks and real-time monitoring. Journal of Manufacturing Science and Engineering, 137(4), 040909. doi:10.1115/1.4029806
- Teti, R. (1990). Ultrasonic identification and measurement of defects in composite material laminates. CIRP Annals - Manufacturing Technology, 39(1), 527–530. doi:10.1016/S0007-8506(07)61112-3
- Wang, L., Torngren, M., & Onori, M. (2015). Current status and advancement of cyber-physical systems in manufacturing. Journal of Manufacturing Systems, 37, 517–527. doi:10.1016/j.jmsy.2015.04.008
- Wang, W. (2010). Reverse engineering: Technology of reinvention. Biometric technology today (Vol. 15). doi:10.1016/S0969-4765(07)70057-7
- Wu, D., Rosen, D. W., Wang, L., & Schaefer, D. (2015). Cloud-based design and manufacturing: A new paradigm in digital manufacturing and design innovation. CAD Computer Aided Design, 59, 1–14. doi:10.1016/j.cad.2014.07.006
- Xu, X. (2012). From cloud computing to cloud manufacturing. Robotics and Computer-Integrated Manufacturing, 28(1), 75–86. doi:10.1016/j.rcim.2011.07.002
- Zaiß, M., Demmerle, J., Oergele, J. N., & Lanza, G. (2017). New concepts for quality assurance of lightweight material. In Procedia CIRP (Vol. 66, pp. 259–264). Elsevier B.V. doi:10.1016/j.procir.2017.03.224
- Zhang, L., Luo, Y., Tao, F., Li, B. H., Ren, L., Zhang, X., … Liu, Y. (2014). Cloud manufacturing: A new manufacturing paradigm. Enterprise Information Systems, 8(2), 167–187. doi:10.1080/17517575.2012.683812