
 ?Mathematical formulae have been encoded as MathML and are displayed in this HTML version using MathJax in order to improve their display. Uncheck the box to turn MathJax off. This feature requires Javascript. Click on a formula to zoom.
Abstract
Wastewater treatment is a process, which is being done on the wastewater to change its quality for drinking or other suitable purposes. Wastewater treatment takes place in wastewater treatment plants, which should be designed under different circumstances. The criteria are being considered in this design for wastewater treatment plant (WWTP) Al-Hay. Moreover, the characteristics of physical, chemical and biological wastewater also are described. Based on the population of Al-Hay city, the project is undertaken to design a wastewater treatment plant. The girt chamber, equalization basin, oil and grease removal, aeration tank and secondary settling tank have been designed, and then the values for mean cell residence time, volume of aeration tank, hydraulic retention time, F/M ratio, return sludge flow rate, sludge production and oxygen requirement have been calculated. Modelling using GPS X also has been done on this data. It is exhibited a typical diagram of WWTP staring with influent flow, aeration tank and settling (clarifier) tank. The simulation time is also illustrated. With increasing the time, the parameters such as TSS and solids are typically enhanced. This is as indicator to improve the fit of the model and the actual data for the secondary effluent TSS. The research shows the treatment process design of Al-Hay wastewater treatment plant (WWTP). The paper also described the equations process design for WWTP. Sludge age (θc) has been calculated and associated to the observed yield (Yobs). There is correlation between sludge age and the mixed liquor suspended solid (MLSS). The value of the observed yield has been noticed, with values ranging from 0.2 to 0.6 kgVSS/kg(BOD5). The sludge retention time is equal to 27.7 day and the sludge produce is 3339.18 Kg/day. These results are related to biological tank for Al-hay WWTP is worked during with high efficiency.
Keywords:
PUBLIC INTEREST STATEMENT
The aim of our paper is to verify the treatment process design of Al-Hay wastewater treatment plant (WWTP), taking into account some characteristics occur in that city. Designing a WWTP depends on the characteristics of the wastewater so the designing process should be analysed carefully because even a small mistake can be fatal. Modelling using GPS X also has been done on this data. The paper can be beneficial for public area especially in Iraq. Design wastewater treatment plant can reduce the amount of waste that is usually released into the environment. By doing so, the reduction in the health risks associated with environment pollution thus improving environment’s health. Wastewater treatment is essential to remove the suspended solids as much as before the effluent is discharged back to the environment. Design WWTP is utilised to purify contaminated substances such as solid, liquid and semi-solids. The article has the potential impact in wider level in which designing a WWTP with immunizing the mistakes in the results.
Conflict of Interest
I certify that they have no affiliations with or involvement in any organization or entity with any financial interest, or non-financial interest (such as personal or professional relationships, affiliations, knowledge or beliefs) in the subject matter or materials discussed in this article.
1. Introduction
The purpose of wastewater treatment is to remove or reduce contaminants in water that impose threats to human and environment if discharged to surface and/or ground waters without proper treatment. While developed countries are continuing working on setting more efficient treatment processes in the WWTP or establishing new technologies to meet the increasing demand for water, the developing countries are still straggling to establish the required infrastructure for treatment. Although the damage from lack of such infrastructure is obvious, the public concern still limited due to lack of governmental programs that explain the environmental problems for public and the influence of crisis and political conflicts in these countries (Avijit, Md, & Mhia, Citation2018).
Current outreach programs in these countries are still limited and not operative. Increases in water pollution, concomitant with water scarcity may limit economic development and lead to the commonness of poverty, hunger and disease (Steve, Jin, & Arnold, Citation2016). Problem of improper wastewater treatment is acute in countries suffering crisis like Iraq. Decades of wars and sanctions in Iraq combined with limited environmental awareness in both public and governmental representatives, have highly contributed to the destruction of Iraq’s national water system. According to the United Nations report, six million people have no access to clean water and more than 500,000 Iraqi children access their water from a river or creek and that over 200,000 access their water from open wells. In the first six months of 2010, there were over 360,000 diarrhoea cases as a result of polluted drinking water and a lack of hygiene awareness among local communities, particularly vulnerable groups such as women and children. The report showed that “Every day at least 250,000 tonnes of raw sewage is pumped into the Tigris River threatening unprotected water sources and the entire water distribution system”. Currently, the lack of permanent governmental programs for environment protection, lack of expenses, unavailability of professionals, engineers, and skilled operators, unprofessional design and treatment of most of existing plants, and lack of public awareness about the danger of direct discharge of wastewater to water courses had led to serious deficiencies in operations in the country’s wastewater treatment plants. Most of these plants were not designed based on a proper local data and were constructed by inexperienced companies. In addition to the improper design and implementation, the mechanical and electrical equipment at these plants have suffered from lack of spare parts and no preventative maintenance due to lack of expenses and trained operators. In many cases, untreated raw sewage is directly discharged into Rivers, endangering the health of residents and downstream populations.
Conventional wastewater treatment consists of a combination of physical and biological processes to remove solids, organic matter and nutrients from wastewater. General terms used to describe different degrees of treatment, in order of increasing treatment level, are preliminary, primary, secondary and tertiary or advanced wastewater treatment (Janssen, Meinema, & van der Roest, Citation2002). However, the key treatment process in the conventional sewage treatment is the secondary treatment process, which consists of biological treatment by utilizing mixed types of microorganisms in a controlled environment. Several aerobic and anaerobic biological processes are used for secondary treatment, including activated sludge process, total oxidation process, contact stabilization, aerated lagoons, waste stabilization ponds, trickling filters and anaerobic treatment. Activated sludge process is the most widely applied process comparable to other biological process for its facility design is well known as well as having characterized operation parameters (Culp, Citation1978).
This research is to explain the physical, chemical and biological properties of wastewater. Secondly, it is to design some parts of wastewater treatment plant in Al-Hay station. Therefore, the study of wastewater properties are important regarding to the biological and chemical wastewater treatment processes, which include (aerobic treatment such as (oxidation ponds and activated sludge) and anaerobic treatment. Also, the chemical wastewater treatment processes include chemical precipitation (coagulation and flocculation), ion exchange, neutralization and adsorption. Thus, studying the properties of wastewater has to be investigated because all important in terms of plant layout, plant design, plant sizing and plant location. In this study, it describes the process of preliminary design; secondary design is done based on extended aeration activated sludge system. This system is commonly used is Iraq because it is known technology with less expensive sludge treatment requirement and it can satisfy the standards criteria for effluent disposal to surface water. Finally, chlorination unit is a common method for pathogen reduction. Moreover, modelling and simulation of the process of design Al-Hay station is performed by GPS X program with some parameters.
2. The characteristics of wastewater
The first important information should have for the design of wastewater treatment system is the strength and characteristics of the wastewater to be treated. The strength of wastewater is normally expressed in terms of pollution load, which is determined from the concentrations of significant physical, chemical and biological contents of the wastewater (Davis and Cornwell, Citation2008).
The characteristics or the quality of wastewater is expressed in terms of its physical, chemical and biological characteristics on the basis of the parameters given in the table below.
Characteristics of wastewater depend on the quality of water used by the community, conservation practice and culture of population, type of industries present and treatment given by industries and their wastewater. Many of the above parameters are interrelated. For example, the concentration of dissolved gases and microbial activities in wastewater are affected by temperature.
One of the most important physical characteristics of wastewater is its content of solids, which consists of floating matter, sediment, suspended material and soluble matter. Other physical properties are temperature, colour and degree of turbidity. In addition, for chemical characteristics, it includes organic materials and inorganic substances.
Organic substances consist of a mixture of carbon, hydrogen, oxygen, and sometimes nitrogen, as well as other important elements such as sulphur, phosphorus and iron. Regarding to organic substances, many inorganic indicators of wastewater are important for the development and control of wastewater quality standards. Concentrations of inorganic compounds are increased due to the natural evaporation process, which disposes of some of the water, leaving the inorganic materials in the wastewater (Hubble, Roth and Clark [HRC] INC, Citation2019).
3. Wastewater treatment processes
Sewage is generated from multiple sources. It is a mixture of toilet water, washing water, ice, bathing, washing clothes, and all cleaning work at home, institutions, streets and rainwater. It consists of more than 95 percent water, only 5% of pollutants of different types, nature and quantity.
This diversity in the sources it generates leads to the multiplicity of types of contaminants it contains. Wastewater contains organic matter, trace microorganisms, salts, minerals, ammonia, pesticide residues, residues of pharmaceutical drugs and their metabolites, and highly toxic chemical pollutants for disruption of the endocrine system. Among all this diversity of pollutants, heavy metals and pathogens can be considered the most serious to public health and the environment. Nitrate and phosphorus are an important contaminant if the water after treatment is thrown into the surface and sea water media, leading to nutrient contamination, which in turn disrupts water quality and affects aquatic organisms by significantly reducing the dissolved oxygen content. They are acceptable substances, but nutrients if the goal is to use treated water in agricultural irrigation. The contamination of water is considered a crucial issue, thus the achievement of water purification is needed to reduce nutrient contamination.
In Karkush, Abdul Kareem, and Jasim (Citation2018) studys’, it is shown the lateral load-bearing capacity of a single pile and piles group calculations that it was installed in contaminated claying soil. Two-line slopes intersection method and a proposed model are utilized in pile foundation calculations. The results showed that the increasing of the number of loading cycles is presented by the decreasing of the ultimate lateral capacity. In addition, the concentration of contaminant in the soil increased with the decreasing of the ultimate lateral capacity (Karkush et al., Citation2018).
Kim, Jung, and Han (Citation2019) study showed that water purification can be achieved by using ABFT system (autotrophic biofloc technology). The power of ABFTsystem at the remaining stages (seedling to adult farming) was demonstrated for industrial-level implementation. An excellent water purification effect and about 97% reduction of water conservation were presented two by microalgae. The wastewater from the ABFT system can be reused by use for the growth of different plants (Kim et al., Citation2019).
In Feyzbakhsh, Telvari, and Lork (Citation2017)study, it is presented the delay in some project in Tehran City regarding to the three factors which are quality, cost and time. As some circumstances happed in the last decades such as climate change, enhancement of population, decrease of raining, as well as increasing in water harvesting from groundwater, thus the importance of water is intensified as the project of water and wastewater treatment. Based on this study, it is verified that some factors contributed in the delay of wastewater treatment projects such as uncertainty and buying project site and failure in paying to contractor and employers (Feyzbakhsh et al., Citation2017).
In Parsa, Khajouei, Masigol, Hasheminejad, and Moheb (Citation2018) study’, it is investigated that a new technique is used to reduce the electrical conductivity (EC) of composting leachate-polluted water using electrodialysis (ED) process. In this experimental study, the removal of COD is shown a reduction. The decreasing in COD removal is improved by the increasing of applied voltage, decreasing in feed concentration and reduction of EC. This study showed an acceptable ED method to reduce salt and organic content (Parsa et al., Citation2018).
Wastewater treatment is designed to improve water quality to meet the specific safety and safety requirements of the wastewater after treatment. Different treatment processes reduce the concentration of pollutants in water. It reduces the content of suspended solids, whose molecules can contaminate the rivers and impede the movement of water in the channels and pipes after deposition. It also reduces the content of biodegradable organic matter, measured by the Biological Oxygen Demand BOD (BOD) index (Ronan et al., Citation2019).
Treatment processes can also remove or neutralize many industrial pollutants and toxic chemicals. In principle, processes of industrial waste and toxic chemicals treatment should be carried out in the same industrial establishments, and should not be dumped in sewage sewers without treatment, and without complying with the regulations on the specifications of industrial effluents allowed in sewerage.
In the area of wastewater management and treatment, we talk about three main levels of treatment, each of which involves a range of processes and targets a specific type of contaminant present in the water. There are those who talk about two additional processes, one at the beginning and one at the end, and the number of treatments becomes five.
For the treatment processes, it starts with preliminary treatment units. This phase involves the removal of large solid objects through the use of nets to capture and remove them, as well as the deposition of sand and gravel by passing water when entering the station through a hole where heavy solids fall before proceeding to the next stage. This stage is of great importance in terms of protecting the plant’s equipment from faults, especially pipes and pumps (Rungnapha, Hardy, Huub, & Karel, Citation2015).
The initial and primary treatment process removes about 25% of organic matter load and theoretically removes all inorganic solids and for water containing industrial effluents. It may be necessary to balance flows and adjust pH value or add chemicals. It includes unit operations such as: screen, grit chamber and equalization basin.
Additionally, for the primary treatment, it is including primary sedimentation the purpose of this unit is to remove the settle able organic solids. Normally a primary sedimentation will remove 50–70 percent total suspended solids.
Primary sedimentation (or clarification) is achieved in large basins under relatively quiescent conditions. The settled solids are collected by mechanical scrapers into hopper, from which they are pumped to sludge—processing area oil, grease and other floating materials are skimmed from the surface. The effluent is discharged over weirs into a collection trough.
There are some types of clarifiers. Also, the common types of horizontal flow clarifiers are rectangular, square, or circular. On the other hand, the types of include surface are tube settler and parallel plate settler. In general, the design of most of the clarifiers falls into three categories: (1) Horizontal flow, (2) solids contact and (3) inclined surface.
The main objective of this phase of treatment is to obtain a homogeneous liquid that can be biologically processed at later stage, on the one hand, and one the other hand, obtainable and around to be treated separately. Sedimentation ponds are usually equipped with mechanical equipment that helps to collect the mud in the pelvic floor, and from there it is pumped to the treatment in subsequent stages. As well as to remove the floating material and dispose of the treated water stream. As well as, the mechanical equipment is to transfer homogeneous water to the next stages of treatment. As this initial stage, some chemicals are used to help the materials float on the surface of the water, as well as to help the solids settle on the bottom. The mulch is derived from primary treatment, the primary mulch. This process can reduce the BOD index, the level of contamination with biodegradable organic matter by more than 20–30 percent, and reduce the total TSS by more than 50–60%. Primary treatment is the first phase of treatment, followed by other processes. It is divided into: floating basins and deposition basins.
After that, secondary treatment is required. The purpose of secondary treatment is to remove the soluble organics that escape the primary treatment and to provide further removal of suspended solids. Secondary treatment may remove than 85% of the organics. Additionally, rand suspended solids, it does not remove significant amount of nitrogen, phosphor heavy metals, no degradable organics, bacteria and viruses. These pollutants may require further removal (advanced one) (Soomaree, Citation2015).
This treatment can remove more than 90% of the organic matter found in wastewater through bioremediation processes. It also removes dissolved organic matter, which evaporates from the initial treatment phase. The process of biological treatment is carried out by groups of microorganisms that consume organic matter as their food and turn it into the end products of metabolism, carbon dioxide, water and energy (Karia and Christian, Citation2006). This energy is necessary for germ growth and reproduction. Biological treatment is accompanied by an effective ventilation process that provides the aquarium with large quantities of air (oxygen) to facilitate the dissolution of the organic matter. After biological treatment, the water is pumped into secondary sedimentation basins, where the remaining solids and living microorganisms descend to the bottom. They are treated separately from the liquid that continue to be transferred to sterilization (Metcalf & Eddy, Citation2003).
This phase is divided into five stages: ventilation and mixing, sedimentation basins, activated sludge, filtration and disinfection.
Finally, advanced treatment might be used in some treatment. It is an additional treatment process, such as filtration, carbon adsorption, and chemical precipitation of phosphorus, to remove those constituents that are not adequately removed in the secondary treatment plant. These include nitrogen, phosphorus, and other soluble organic and inorganic compounds (Anjum, Al-Makishah, & Barakat, Citation2016).
4. Methodology
In the methodology part, for treatment processes, it consists of preliminary treatment units. Pre-treatment means are designed for removing large suspended solids or minimizing their size by fragmentation these solid materials may be of wood, doth, paper, plastic … .etc. For removing of heavy inorganic solids such as sand and gravel as well as metal and glass. These materials are called Grit (sand and any coarse material). Finally, it is designed to remove excess amounts of grease or oils. The pre-treatment consists of screens, grit chamber and equalization basin.
The general purpose of screens is to remove large objects such as rags, paper, plastics, metals, and the like. These units are used to store and remove large solid materials, hair, fibres, cloth, paper and coarse materials and prevent their entry with sewage to the subsequent treatment stages where they are placed at the beginning of the treatment plants at the entrance of the pumping station to protect the mechanical installations. Usually fine screens are preceded be a preliminary screening for the purpose of protection. Screens may also be classified into manually and mechanically cleaned.
For the grit chamber, it is necessary to remove the grits and other materials that are heavier than organic matter, in order to protect moving mechanical equipment and pumps from unnecessary wear and abrasion. There are different types of grit chambers, rectangular horizontal flow type, detritus tanks, aerated grit chamber, and equalization basins.
The Equalization (EQ) Basins are designed to provide consistent influent flow to downstream processes by retaining high flow fluctuations. Due to the additional retention time, aeration and mixing is required in equalization basins to prevent the raw wastewater from becoming septic and to maintain solids in suspension.
After that, biological Treatment (secondary treatment) is needed. Biological waste treatment involves bringing the active microbial growth in contact with wastewater so that they can consume the impurities as food. A great variety of microorganisms come into play that include bacteria, protozoa, rotifers, fungi, algae and so forth. These organisms in the presence of oxygen convert the biodegradable organics into carbon dioxide, water, more cell material, and other inert products. Biological treatment process can be achieved by two types of growth: suspended growth biological treatment and attached growth biological treatment.
In the methodology section, following steps are involved in the design of wastewater treatment in Al-Hay city as they are considered in the following steps. Firstly, the assessment of water quality is needed. It is important to select of treatment process, so selection is needed. Design of the treatment system is chosen. Some of water quality parameters are investigated too. This diagram expressed the methodology section for WWTP in Al-Hay city is shown in Figure . In addition, GPS X modelling has been an important part of carrying out the simulation and testing the design. The GPS X simulation has been done on biological treatment. For calibration of the model, it is needed to evaluate the operation of the plant; it needs to include all physical processes of the scale plant. The GPS X is motivated in a way only for secondary treatment to get results for some physical parameters such as TSS, BOD and COD because our design for Al-hay plant can be specified for a kind of wastewater treatment plant of extended aeration activated sludge system process.
Figure 1. Flow diagram for wastewater treatment process
4.1. Introduction
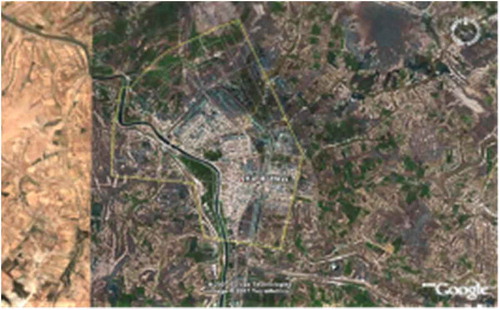
Al-Hay City lies in the south of Iraq some (39) kilometres to the south-east of Kut City being situated in the south of Iraq. The area is located between E (46° 00ʹ 13.5”—46° 04ʹ 01”) and N (32° 08ʹ 28”-32° 13ʹ 03”). The city area inside the municipality boundary is densely occupied especially the central part of the city as shown in the Figure .
Due to the master plan of the city the area within the municipality is about (8000), dounum. The city of Al-Hay has an estimated 2014 78,820 capita, and it is expected to grow to 169,984 capita by 2040.
Figure 2. Arial image for Al-Hay city by GoogleTM Earth
4.2. Climate
The climate of Iraq has been classified as continental. However, it is modified by the presence of the Arabian Gulf and especially the Mediterranean Sea, making it in the southern part of the country to resemble the Mediterranean type during the winter.
The summer months, from June to September, are completely dry with extremely high temperatures and very low relative humilities. In October and November, temperature drops and showers occur with increasing frequency. Lowest air temperatures are reached from December to February, with minimum temperatures occasionally below zero.
4.3. Study period and population forecast
The population figures for Al-Hay District are based on the 2014 population data obtained from the Central Organization of Statistics and Information Technology of the Ministry of Planning and Development. The planning timeframe used in this study is 22 years, through the year 2040. A growth rate of 3.0% per year has been adopted in accordance with the MMPW standard for water and wastewater facilities planning. Based on the above growth rate, an increase in Al-Hay population based on Table down below over the time period of planning. Consequently, the population of Al-Hay District is projected to increase over the next 22 years. The phase I means the populations in which started from 2018 to 22 years later which is should be at 2030. That means the WWTP starts working in 2018 to 2030 with this quality and parameters. The phase II means the design for WWTP will be started from 2030 to 2040, so the plant will be worked with these parameters and the estimated populations are calculated based on the year that starts with. Indeed, the project of the WWTP is designed to work for 22 years starting from the year with is 2018 to 2030 and the second part to the project to still be working is started from 2030 to 2040. Over the time period of planning in which started with 2014 the population is provided corresponding to phase I, which is 2018 going up to phase II which is 2040. Table showed the increasing in the population over the time period of planning in the design.
Table 1. Significant parameters for physical, chemical and biological characteristics
Table 2. Population projections for Al-Hay sub-district
4.4. Projected wastewater generation
The projected wastewater generation is determined based on the population and level of service. The per capita wastewater generation rate is presented in Table shown below for Al-Hay. In Table , it displays the projected wastewater generation in which starts with the population of 2018 ending to 2030 as phase I and from 2030 to phase II, which is ending up to 2040 as indicated earlier based on the projected design. The gross population is calculated based on the formula Pf = Pi × (1 +0.03) ^m
Table 3. Projected wastewater generation for Al-Hay
Where Pi: the initial population (present) capita.
t: the number of year for future period = 1,2,3 … … .22 years.
Pf: the future population estimated (capita).
For example: Pf = Pi (1 +0.03) m
Pf = 78,820 (1.03)4 = 88,713 … . … . population for 2018, and the population for 2040 is calculated as Pf = 146,630 (1.03)5 = 169,984. The cross daily flow is calculated from the equation which is {Gross daily flow = population × 0.2} (m3/day).
The average flow in sanitary system is sum of gross waste water generation plus infiltration. The infiltration is water-entering sewer from ground through defective connections, pipes, pipes joints and manhole wells.
Let infiltration = 0.1 X Gross daily flow
Qav. = Gross daily flow + infiltration
4.5. Peak factors
In the design analysis of wastewater mains, average flows do not represent the flows that the mains must handle. Wastewater mains should be designed to carry the projected peak flows that could reach as high as five times the average daily flows, depending on the population served by the wastewater mains. For purposes of this project, peak factors are based on the Babbitt—Herman formula and have been summarized. In Table , it shows the computation of wastewater discharge peak factors for both possibilities when the population is larger or smaller than 80,000.
Table 4. Computation of wastewater discharge peak factors
Factors of minimum flow are calculated based on the following formula (P = population x 10–3):
4.6. Population forecasting
The city of Al-Hay is undergoing rapid expansion in population as shown in Table . The population of 2018 and the estimated population is up to 22 year by the following equation:
Table 5. Show the design flow rate for Al-Hay waste water treatment plant
Gross daily = Population × 0.2 (m3/day) = 17,742.6 m3/day
Infiltration = 0.1 X Gross daily flow = 1774.26 m3/day
Qav = Gross daily flow + infiltration = 19,516.86/24 = 813.2 m3/hour
Qpeak = 2.486 × 813.2 = 2021.62 m3/hour
Pmin = 0.2 P1/6 = 0.2 × (88,713×10−3)1/6 = 0.422 m3/hour
4.7. Standards and design criteria
In this section will be describe the standards and criteria adopted in this study for the purpose of developing preliminary designs of the project facilities and establishing the bases for evaluating the various project alternatives.
In this wastewater treatment plant design, the characteristics of effluent of wastewater are adopted based on Iraqi National Standards for Discharge of Treated Municipal Wastewater to surface water courses. Based on these guidelines, the treatment processes must reduce BOD5 by more than 90%, ammonia by more than 80% and total nitrogen by more than 50% (nitrification/denitrification) (Marc et al., Citation2018). There are three specific treatment processes have been acknowledged as being feasible options for implementation, these are the Conventional Activated Sludge Process, Extended Aeration process and the Waste Stabilization process. Only the first two can meet the established effluent discharge criteria to River Tigris. The first process, mentioned to as the activated sludge/nitrification/denitrification process, is a conventional treatment process used successfully at sites in Iraq and throughout the world for treatment of domestic wastewaters. The second process, the Extended Aeration Activated Sludge system, although, now, commonly used in Iraq, is a well-known technology with less extensive sludge treatment requirements, which makes the capital and operational costs less than those required by the conventional activated sludge process. Waste Stabilization Ponds have the lowest capital and operational costs that can treat the domestic wastewater to the level that complies with the WHO and FAO guidelines for effluent reuse. Because this process is unable to meet the standards, so the extended aeration processes will be adopted for this purpose.
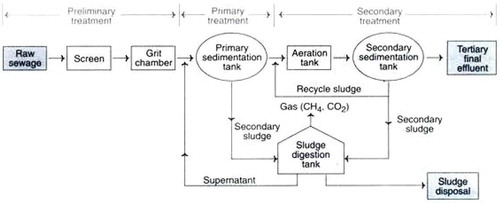
Extended Aeration can satisfy the selection criteria requirements for effluent disposal to surface water courses as it has the highest BOD, TSS and Nitrogen removal efficiency and meets the National Iraqi Standards for Wastewater Discharge to surface water courses, in addition to its ability to reduce phosphates considerably with minor upgrading. In the Figure , it displays a flow chart of conventional treatment plant.
Figure 3. A diagrammatic representation of a flow chart of conventional treatment plant. Reversed fromhttp://autozone.2.sisamben.de/process-flow-diagram-for-wastewater-treatment-plant.html
Additionally, the effluent standards for the category—Discharge to Streams, were selected from Iraqi National Standards, Table in (Appendix A) is referred to in Act 25 published in the year 1967 from Iraqi Authorities to regulate the Treated Domestic Wastewater be applied to this project. These standards are to be used to determine the performance requirements of the wastewater treatment plants proposed for the Al-Hay City.
Moreover, in Table in (Appendix A), the Iraqi National Standard for Treated Domestic Wastewater is represented. The most significant parameter limits (maximum concentrations) applicable to the wastewaters from the Study Area are 20 mg/1 for BOD5, 30 mg/1 for TSS, 10 mg/1 for ammonia (NH4-N)), 50 mg/1 for total nitrogen (N), and 100 MPN/100 ml for faecal coliforms and so on. In addition, the main characteristics of wastewater from the study area are those of domestic wastewater. Those prime parameters could be achieved by the conventional method of treatment proposed. Industrial discharges to public sewers have to be controlled by regulations for discharge of industrial wastewaters into the sanitary sewer system that require pretreatment before discharge (such as phosphorus). Chlorides, sulphates and many other inorganic dissolved solids are not considered to be problems. Thus, their concentrations in the effluent depend on the drinking water source.
5. Design calculations and GPS × modelling
5.1. Design calculation
5.1.1. Preliminary treatment units
Along with treatment system units, we have to design pumping stations, approach channels, the flow equalization basin, which is transporting and providing a uniform flow to succeeding treatment unit and screen units, grit chamber and oil grease removal which is treatment unit in true sense.
5.1.1.1 Design of inlet pumping station
At the inlet stage of the wastewater treatment plant, screw pumps are usually utilized for this purpose. The pumping station or pump house at the treatment plant is normally of RCC and consists of a wet well and a dry well. When the raw wastewater reaches the treatment plant, it is first collected in the wet well or wet sump, and it is then lifted by pumps installed in the dry pit and conveyed to the first unit of the treatment system. Pumps are normally installed in the dry wells, or alternatively, submersible pumps are installed within the wet well itself. There are several significant parameters are considered in the design of pump station, which includes:
HRT (Hydraulic retention Time) of waste water in the wet well usually does not exceed 20 min.
Screens: These are provided before the influent enters the wet well to screen out the material that may clog the pumps.
Stand by pump: At least one extra pump more than the number of pumps required as per design usually used for WWPT design.
Design of pumps of wastewater treatment plant depends on the following flow rates: (in which show the average discharge, peak discharge and minimum discharge for both phases I and II in the projected area). In Table , it shows the estimated flowrates for phase I and phase II.
For this design, three pumps are used with one pump extra. Thus, 3 pumps used + 1 stand by pump.
So, the discharge of each pump, we utilize the peak discharge for phase#2 (2040).
Qpump = Qpeak/3 = 77,560.299/3 = 25,853.433 m3/d (1077.226 m3/hour)
The screw diameter estimated about 1300 mm with overall length about 10 m.
To summarize, Al-Hay WWTP required 3 pumps + 1 stand by pump each of Q = 1077 m3/hour delivered as below:
Phase I (2030): 2- pumps +1- stand by pump.
Phase II (future): 1 pump.
5.1.1.2. Design of approach channel
An approach channel usually used in WWTP is simple rectangular open channel. Wastewater collected in the wet well of a pump station is pumped into the approach channel located at a predetermined level normally determined using the gradient of hydraulic flow diagram. The sewage from the approach channel flows by gravity to the succeeding units of treatment plant.
The main function of an approach channel is to dampen the turbulence of the incoming flow to the subsequence units and ensure somewhat a steady and uniform flow after pumping. The approach channel designed with following design criteria:
1. Velocity of flow, v ≥ 0.45 m/s (usually use 1.5 m/s)
2. Length of the channel 2.0–3.0 m
3. For a rectangular section, the depth to width ratio, D: B = 1:1.5 to 1:2
4. The number of units, N = 2 usually.
5. Slope is computed by Manning’s equation.
Providing 2 channels in one unit, so, the maximum flow in each channel is;
Qmax = Qmax @ (2040)/2 = 77,560.299/2 = 38,780.15 m3/d (0.449 m3/s)
Let the velocity of flow 0.80 m/s in the channel
So, the cross section area: A = Qmax ÷ V = 0.449 ÷ 0.75 = 0.5987 m2
Assuming the width to depth ratio, B: D = 1.5: 1
B = 1.5 D
A = 1.5 D × D = 1.5D2
D = (A ÷ 1.5)1/2 = (0.598 ÷ 1.5)1/2 = 0.6314, use D = 0.6 m
B = 1.5 × 0.6 = 0.9 m
Assuming freeboard = 0.30 m, so, the total depth of the tank is:
∴Total depth of channel; h = 0.60 + 0.30 = 0.90 m
Check the velocity of flow with Manning’s equation:
Channel wetted perimeter; P = 2D+B = 2 × 0.60 + 0.9 = 2.10 m
Channel Hydraulic mean radius; R = A/P = 0.54 +2.10 = 0.257 m
Let the slope of channel; S = 1/1000
n = 0.013 (Manning’s coefficient of roughness).
V = × R 2/3 S1/2
V = × R 2/3 S 1/2
V = 0.2572/3 × 0.00l1/2 = 0.98 m/s > 0.8 m/s as per design requirement. So, assumed velocity of 0.75 m/s and slope of 1 in 1000 are acceptable.
Now, Check the velocity of 1/3 flow depth (one third depth of flow):
1/3 D = 1/3×0.6 = 0.20 m A = D×B = 0.2×0.9 = 0.18 m2
P (Wetted perimeter) = 2/3 × D +B = 2/3×0.2 +0.9 = 1.03 m R (the hydraulic mean radius) = A/P = 0.175 m
V = 0.1752/3 ×0.00l1/2 = 0.76 m/s > 0.45 m/s. Hence, the slope of 1 in 1000 is acceptable.
5.1.1.3. Design of equalization basin
In actual practice, flow of domestic wastewater is never constant but exhibits diurnal and seasonal variations, both in volume and strength. Dampening of flow and loading normally improve the performance of reactors, more particularly the biological reactors. Therefore, when it is required to equalize the strength of wastewater and to provide a uniform flow; equalization tank is employed to the WWTP, usually after the screens and grit chambers. The capacity (volume) of an equalization tank is determined by preparing an inflow mass diagram, which is the plot of cumulative inflow volume of wastewater versus the time of the day. But, with missing of inflow data required to draw inflow mass diagram, the capacity of equalization tank will take 0.25 Qave, so:
Capacity of equalization tank = 0.25 × 37,396.48 = 9349.12 m3
Use 2-rectangular tank with B: L = 2:1
And Total Depth = Water depth+ Free board = 5 m
The surface area of each tank = (9349.12 ÷ 4.5)÷ 2 = 1038.8 m2
∴2B × B = 1038.9 B = 22.8 m
L = 2B = 2×22.8 = 45.6 ×46 m
If rectangular tanks are provided, therefore, provide 2 rectangular tanks with L = 46m and B = 23 m and total depth, D = 5.0 m.
5.1.1.4. Design of screen unit
Screens are the device with clear opening of uniform size to re used to remove floating material and coarse solids from wastewater. It may consist of parallel bars, wires or grating. Mainly solids like sticks, rags, boards and other large objects, which find their way into a wastewater is removed by screenings. The screens are frequently required to be cleaned, as the retained solids (screenings) will tend to increase the head loss across the screens by clogging the screens. In the table , it displays the size of clear opening based on the type of screen.
Normally, screens are classified by two methods:
According to the method of cleaning: screens are known as hand cleaned or mechanically cleaned.
According to the size of clear openings: they are known as coarse, medium or fine screens depending on the size of clear openings between the bars, as under:
Providing 2 channels in one unit, so, the maximum flow in each channel is;
Qmax = 77,560.299 ÷2 = 38,780.15 m3/d (0.449 m3/s)
Coarse screen:
The design of screen units is as follows:
Where: n = no. of opening
K = factor = 1.05
= bar spacing = 0.1 m
h = depth of water at Q peak
V = velocity through screen = 0.75 m/s
Use 7.0 bars
∴ Screen channel width = B = n. + (n—1) × bar width = 8 × 0.1 + (7 × 0.008) = 0.86 m
0.9 m
The head loss through the screen:
hL = 0.0729 × (v2-vh2)
Where;
vh = velocity before the screen =0.98 m/s
v = velocity through the screen =1.0 m/s
hL =0.0729 × (l2−0.982) =0.003 m < 0.15 m. Acceptable as head loss is less than the design criteria, 0.15 m.
Assume the screening production = 0.01 m3/1000 m3 wastewater. The criteria are (0.0015–0.015 m3/1000 m3wastewater) for screen size of 10 to 25 mm, respectively.
∴ The quantity of screening = 0.0015 × 38.780 =0.058 m3/d
So, clean can be down manually daily.
Design of perforated plate: provide the length of the plate equal to the width of the chamber which is 0.90 m. Assuming the width of the plate is equal to 0.50 m and the depth of the pocket equal to 0.25 m for collecting screenings. So, the capacity of the screening pocket is: 0.90 × 0.50 × 0.25 = 0.113 m3
The length of screen channel:
Horizontal projected length is 0.90 × cos 45° =0.65 m
Let the length of outlet zone be the length of the perforated plate +0.2 m = 1.0 m Let the length of inlet zone = 0.85 m.
The total length of screen channel—0.65 + 1.0 + 0.85 = 2.5m. Use 2 no. screen units (one unit with two channels) as well as by pass channel with No. of bars are 8.0.
Fine screen:
The design of screen units is as follows:
Where: n = no. of opening
K = factor = 1.05
= bar spacing = 0.025 m
h = depth of water at Q peak
V = velocity through screen = 1 m/s
Use 30 bars of size 6.0 × 50 mm
∴ Screen channel width = B = n. + (n—1) × bar width = 30 × 0.025 4+ (30 × 0.006) = 0.93 m say 0.90 m
The head loss through the screen:
hL = 0.0729 × (v2 - vh2)
Where;
Vh = velocity before the screen, which is 0.98 m/s.
v = velocity after the screen, which is 1.0 m/s.
hL = 0.0729 × (l2–0.982) = 0.003 m < 0.15 m acceptable.
The length of screen channel:
Horizontal projected length is:
(h +1.2) × cos 60° = 2.1 × cos 60° = 1.05 m {for belt screen with flat teeth}
Let the length of outlet zone = 1.0 m
Let the length of inlet zone = 0.45 m
The total length of screen channel = 1.05 + 1.0 + 0.45 = 2.5 m
Use 2 no. Mechanical screen units (one units with two channels) as well as by pass channel.
5.1.1.5. Design of grit, oil and grease removal
Grits are composed of sand, small gravel, cinders, broken glass or other heavy solid materials present in wastewater. There are some types of grits chambers; rectangular horizontal flow type and aerated grit chamber are most common and normally used in this field (Kulkarni, Citation2011). Using the aerated grit chamber will keep the organic solids that will settle down by gravity in suspension by rising air bubbles of aeration system. Removal of grease combined in the aerated grit chamber. Grits chamber are nothing but the sedimentation basins or settling basins, designed mainly to remove heavier or coarse inert and relatively dry suspended solids from the wastewater (Judd, Citation2015). The design depends on the following criteria, which are shown in Table .
6. Design criteria
The principal typical data of an aerated desanding tank for a good design, at peak flowrate, are (as per Wastewater Engineering, METCALF & EDDY, Fourth edition)(Janssen et al., Citation2002):
Use 2 aerated grit chamber, so, the maximum flow in each channel is;
Qmax = 77,560.299/2 = 38,780.15 m3/d =1615.84 m3/hr (26.930 m/min)
The dimension of each chamber is:
Let Depth D = 2 m and the width to the depth ratio W: D ratio of 2:1
∴Width B =2 × 2 = 4 m,
= Qpeak × t = 26.930 × 6 = 161.58 m3 = volume
∴Length L = +BD = 161.58 ÷2×4 = 20.1975 m
Check the maximum surface hydraulic load Cmax = Qmax ÷ (L×B) =1615.84÷ (20.198 × 4) = 20 m3/m2/h OK
Estimation of arriving sand quantity (m3 of dry sand) per 1000 m3 of sewage for each chamber:
Qs = 0.015 m3/103 m3 = 0.015 × 38.780 = 0.582 m3/d
Assume rate of air (m3/min) to supply for oil and grease flotation, of each tank, = 0.5 m3/m/min
∴ The requirement of air = 0.5 × length = 0.5 × 20 = 10 m3/min
6.1. Secondary treatment units
6.1.1. Design aeration tanks
The combined process oxidizes a high proportion of the influent organics relative to the NH3-N concentration. In combined carbon oxidation-nitrification processes the ratio of BOD (biological oxygen demand) to TKN is greater than 5, whereas in separate processes the BOD to TKN ratio in the second stage is greater than 1 and less than 3. Total Kjeldahl Nitrogen (TKN) is a parameter used to measure organic nitrogen and ammonia. The TKN content of influent municipal wastewater is characteristically between 35 and 60 mg/L. TKN is a regular parameter that indicated the total concentration of organic nitrogen and ammonia. The ratio of BOD5 to TKN can be used as an indicator for efficiency of removal nitrogen and providing useful information in the rate of biodegradability in WWTP design. The term MLSS means (Mixed liquor suspended solids) is the concentration of suspended solids, in an aeration tank during the activated sludge process, which occurs during the treatment of waste water. The F/M ratio is a measure of the amount of food, or BOD, that is given to the microorganisms in the aeration tank. Additionally, MLVSS is defined as mixed liquor volatile suspended solids. MVLSS is generally defined as the microbiological suspension in the aeration tank of an activated-sludge biological wastewater treatment plant or it is represented the concentration of biomass in the activated sludge. The MLVSS is calculated as shown in Table . The hydraulic retention time (HRT) in wastewater treatment plant is a measure at an average length of time holding the wastewater in a tank. In addition, the biomass yield is defined as the ratio of the amount of biomass produced to the amount of substrate consumed (g biomass/g substrate). Moreover, in most aeration treatment systems, it is necessary to calculate the detention time is necessary in order for the microorganisms in the aeration system to absorb, adsorb and remove the contaminants (bacteria food) in the wastewater. Other calculations like sludge age, sludge produce and sludge produce in term of TTS are explained in Table as a part of the calculations of the design of aeration tank.
Table 6. The estimated flowrates for phase I and phase II
Table 7. The size of clear opening based on the type of screen
Table 8. The design criteria for aerated grit chamber
Table 9. Design of Aeration Tank
To design an activated-sludge process for carbon oxidation-nitrification using the data in Table and determine the volume of the aeration tank, daily oxygen requirement, and the mass of organisms removed daily from the system as below:
Where;
∀ = volume of biological tank (m3)
MLVSS = mixed liquor suspended solid (mg/l)
HRT = hydraulic retention time (hr)
Yobs = observed yield; Qw =sludge wasting discharge (m3/d)
θc = sludge retention time (d)
γshudge = sludge density (kg/m3)
Qave =average discharge (m3/d)
F/M = food microorganism radio
PXVSS = the sludge produce (kg/d)
PXSS = sludge produce in term of TSS (kg/d)
Q = return sludge discharge (m3/d)
MLSSR = return mixed liquor suspended solid (mg/l)
Check for anoxic zone requirement:
Total N- load (Nitrogen load) = Qave × N conc. = 27,826.48 × 60 = 1669.6 kg/day
T-N effluent (Total nitrogen effluent) = T-N effluent = Qave × N.eff = 27,826.48 × 0.050 = 1391.3 kg/day
N-waste sludge = 5% sludge produce = 5% × Pxvss = 0.05×3339.18 = 167 kg/day
Denitrified NO3-N = N load- N effluent- N waste sludge
Denitrified NO3.N = 1669.6–1391.3- 167 = 111.3 kg/d it can be removed in setting tank. Thus, anoxic zone is not required.
6.1.2. Design secondary clarifier
The secondary settling tank (clarifier) is integral part of the activated sludge process. The main purpose of providing the secondary settling tank is to separate the large volume of suspended solid (MLSS) coming from the aeration tank and to obtained very clear stable effluent having low concentration of BOD and SS.
The secondary settling tank (SST) or clarifier is an integral part of the activated sludge process. As MLSS applied to tank is primarily biomass and flocculent in nature, normally type III or zone settling is assumed to take place in the tank, through discrete and flocculants settling also occur. The settled solids form the sludge blanket throughout the entire depth in the SST and may overflow the weir at peak flow rate if the size of the SST is inadequate. It is also essential that settling sludge is thickened in the tank to reduce its volume (Judd, Citation2015). So, while designing the SST, care should be taken for providing an extra depth for thickening or concentrating the settling sludge. In Table , it represents the design criteria for the settling tank, following criteria should be followed for extended aeration process (Janssen et al., Citation2002). In the table , it represents the design calculation of secondary settling tank.
Table 10. The criteria for the secondary settling tank
Table 11. The design calculation of secondary settling tank as follows
Table 12. The design criteria for the holding tank
Table 13. The design calculation of holding tank
Table 14. The design calculation for drying bed
Table 15. The design criteria for the chlorination tank
Table 16. The design calculation of chlorination tank as below
WLR = flow/π×d (m) = 27,826.48/π×33 = 269 m3/m.d. For phase#1
WLR = flow/π×d = 37,396.48/π×33 = 360 m3/m.d. For plase#2. Accepted.
To calculate the sludge hopper volume:
Mass of solid = Ms = SS × Qave × %removal = 320 × 37,396.48 × 0.90 × 10−3 = 10,770 kg/m3
Let moisture content = M = 97%
Then, mass of water, Mw given by, M = Mw/(Ms+Mw)*100 = 348,230 kg/d
∀sludge = ∀solid + ∀water = Ms/ρs+Mw/ρw = 10,770/1025 + 348,230/1000 = 358.74 m3.
The wasting sludge is adding to above volume because it is wasted from return, so 1122 + 359 = 1481 m3.
Thus, total ∀sludge = 1481m3.
6.1.3. Design sludge treatment units
Sludge produced in secondary settling tank is large in volume due to high water content (0.2–0.12%) and contain more complex matter. The objective of sludge treatment is to reduce the water content of sludge and stabilize the organic content of sludge (Papoutsakis et al., Citation2015).
The sludge removed in wastewater treatment plants are mainly in the form of screenings, grit, and sludge. In the case of conventional domestic wastewater treatment plants, sludge is generated mainly from primary and secondary sedimentation tanks and its treatment normally includes:
Stabilization of sludge by digestion or treatment by lime or heat or chlorine oxidation.
Dewatering of sludge by filtration or centrifugation or drying on bed or in lagoons.
Therefore, the objective of sludge treatment is to reduce the water content of sludge and stabilize the organic content of sludge. One of the methods for reducing water content is thickening or concentrating solids content, dewatering and drying. The sources of sludge vary according to the systems adopted for wastewater treatment the sources of sludge generation are:
Primary settling tank (primary sludge).
Mixed liquor line for from the aeration tank or influent to the secondary clarifier (biological sludge).
Activated sludge settling tank (secondary sludge or activated sludge).
Trickling filter settling tank (secondary sludge or humus).
Chemical precipitation tank (chemical sludge).
6.1.3.1. Design holding tanks
For the gravity holding tank for extended aeration process, Metcalf & Eddy (Janssen et al., Citation2002) had given the following criteria: as shown in table .
In table , it represents the design criteria for the holding tank.
In table , it shows the design calculation of holding tank.
6.1.3.2. Design drying beds
The dewatering of digested sludge is normally accomplished on sludge drying beds where adequate land is economically available. The digested sludge is disposed on a well-drained sand and gravel bed. Thickness of sludge layer is usually 15 to 20 cm.
The water content of sludge reduced up to 70% and while the sludge volume can be reduced up to 60% in drying bed. The following design criteria are described for sludge drying beds: In table , it displays the design calculation for drying bed.
Bed surface area required for digested primary sludge = 0.1–0.25 m2/capita. And for digested primary and activated mixed sludge = 0.15–0.28 m2/capita.
Sludge drying time = 2–4 weeks.
Size of the bed (a) 6–30 m length (b) 3–8 m width.
Specific sludge solids loading rate = 50–210 Kg/m2.yr.
6.1.4. Disinfection unit
Disinfection refers to the partial destruction of disease-causing organism. In table , it shows the design criteria for the chlorination tank. Also, in the table , it represents the design calculation of chlorination tank.
6.1.4.1. Design of chlorination tank
7. Modelling and simulation using GPS X
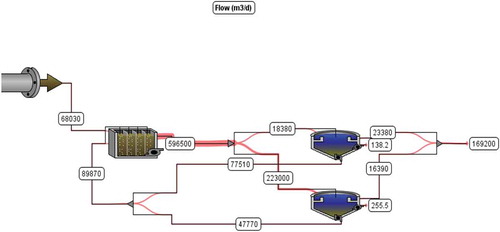
GPS X is a modular, multi-purpose modelling environment for the simulation of municipal wastewater treatment plant. This allows examining the complex interactions between various units processes in the plant interactively and dynamically. The figure below shows the modelling for Al-Hay WWTP based on the influent flow, which is 37397 m3/d. In the figures below, they show the process of WWTP design starting with the influent flow going to aeration tank, clarifer1 and clarifier 2 ending up to effluent flow.
The results were calculated from the detailed sampling, after that GPS-X models were developed and calibrated to the plant data. This calibration effort involved detailed review and analysis of the plant data and development of influent fractions for the model. An example of one of the screen views of a model for the Al-hay WRRF is shown below. This calibrated model is referred to engineering models and is intended by the engineering department as well as engineers for design.
For better purification performance and for providing essential operating rules to get better technically and scientifically operation base of the WWTP, thus the simulation with the GPS-X software is used and the results showed significant and satisfactory control performance of the wastewater treatment plant. The results indicate a good functioning of WWTP along the studied period where almost all measured parameters were below the standards. Moreover, the GPS-X is utilized for improving capacity, operating efficiency and effluent quality by the existing facility can be got.
Figure 4. Modelling of extended aeration process
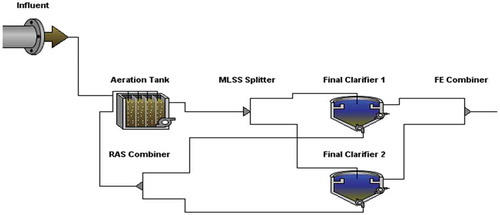
Figure 5. Modelling of Al-Hay WWTP
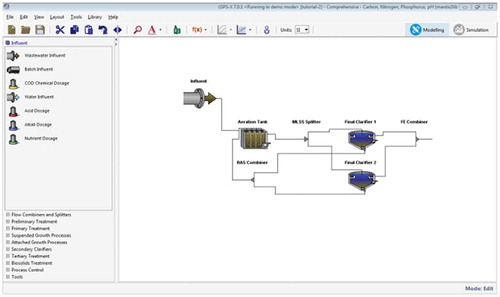
Based on the GPS X analysis, in Figures and , they represent the systematic diagram of the extended aeration process. This process is started with the influent going up to the aeration tank ending with the effluent part. The program can be used to find appropriate control methods to minimize effluent concentrations from an activated sludge process. Basically, our design criteria are started with preliminary treatment through secondary treatment ending up with the effluent of the conventional wastewater treatment plant.
Figure 6. The relationship between TSS and index in final clarifier 1 solids profile
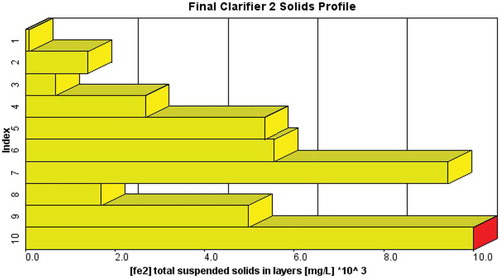
Figure 7. The relationship between TSS and index in final clarifier 2 solids profile
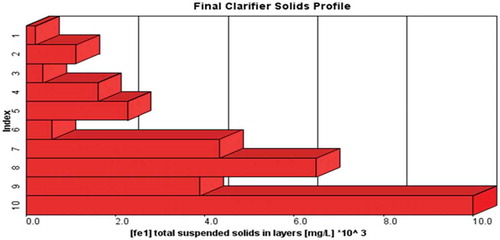
Figures and represent the relationship between the index and the total suspended solids. The results display an increasing in the amount of TSS with the increasing the index values. For example, it can predict a range of TSS concentrations given the typical range of growth rates, even though the true actual growth rate isn’t known. Those results have done for final clarifier 1 and clarifier 2 for secondary treatment process.
Figure 8. The relationship between total suspended solids and time (the time simulation is 5 days)
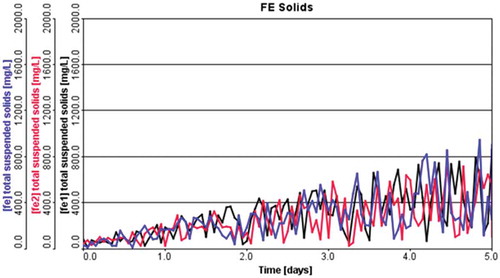
Figure 9. The relationship between the TSS and the time (the time simulation is 20 days)
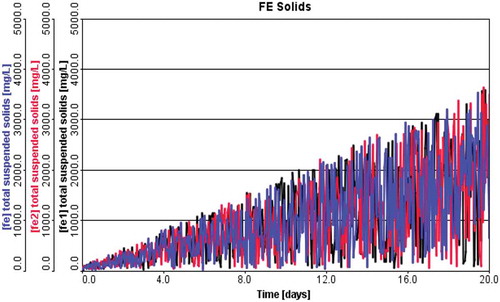
In Figures and , it displays the correlation between the total suspended solid and the time, but the time is various. Thus, the variation in the amount of TSS is considered with the variation of the time of the simulation. The time is specified in this analysis, but the effluent flow is considered with deliberation of the time of treatment process. The time is based on the data calculation is based on the population of Al-Hay starting from 2018 up to 2040. The project period is expected to 22 years. As an example, in Figures and , it expresses the relationship between the times of the process with the amount of solids. Thus, the modeling results indicated that the increasing the time of simulation increased the removal of TSS, so the overall efficiency of the treatment system is enhanced too.
Figure 10. The relationship between the TSS and influent flow
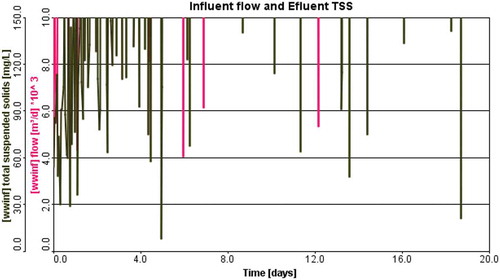
Figure 11. The relationship between the TSS and influent flow
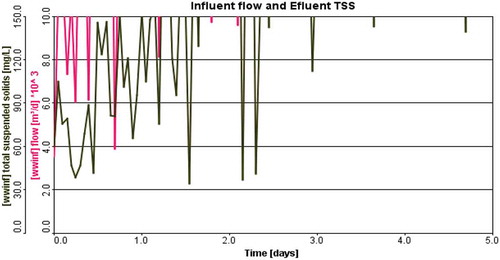
In the figures above, the correlations between TSS values and influent flow, which is clarified an increasing with the TSS values with flow values. But, the time of simulation is 20 days instead of 5 days.
Additionally, in Figures and 1, they show the relationship between the amounts of total suspended solid with the influent flow. An enhancement in the amount of TSS is represented based on our analyses with the flow values at the simulation day 5. Meanwhile, an increasing in the amounts of TSS with the flow values at the 20 days simulation. After that, in Figure , it represents the correlation between TSS and the time. It can predict that at time 5 the TSS showed reduction while at time 20, the amount of TSS showed enhancement in it amount. The improvement of TSS increased with increasing the time of simulation. However, at time 5, the TSS is significantly reduced.
Figure 12. The COD bar diagram
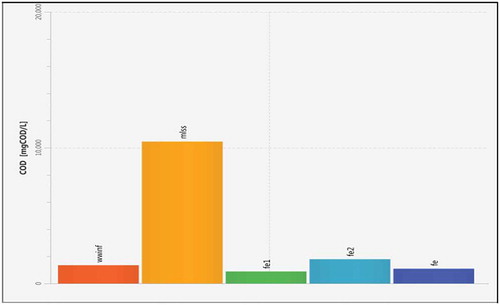
Figure 13. Diagram of WWTP design data
Finally, in Figure , methodical diagram of the whole design of Al-hay wastewater treatment plant is represented. In Figure , the relationship between COD values during the process of plant. The COD value indicates the amount of oxygen, which is needed for the oxidation of all organic substances in water in mg/l. At mixed liquor suspended solid, the COD values is too high comparing to others values in the plant. Mixed liquor is the mixture of raw or settled wastewater and activated sludge with in aeration tank in the activated sludge process. Thus, the mixed liquor suspended solid (MLSS) is the concentration of SS in the mixed liquor. The mixed liquor is discharged into settlings tanks and the treated supernatant is run off to undergo further necessary before final discharge. Part of the sludge is returned to the aeration tank system to re-seed the new sewage entering the tank. If the MLSS content is too high, it indicates that the process of the treatment system works efficiently. It means that the process becomes overloaded that can cause the dissolved oxygen content to drop with the effect. Meanwhile, it also means that the organic matters are fully degraded and the biological is dying off. Measuring the MLSS is important to adjust the flowrate of return sludge from the secondary clarifier into the secondary treatment reactor, and to ensure that influent organic matter will be treated with a correct and appropriate concentration of microorganisms. The COD value is approximately 12,000 mg/L in the MLSS indicating that the process of wastewater treatment plant works efficiently.
8. Conclusion and recommendation
Wastewater treatment is required as a part for eliminating contaminants to a sufficient degree to protect water. Thus, Al-hay WWTP is one of the plants in Iraq that are not completed in its operation. So, the design is needed and is taken into consideration some parameters in the influent that is required to be controlled to enhance the efficiency of the plant.
Wastewater has been released to the environment that is defined as a combination of the water plus wastes added to the water from a variety of uses, such as industrial, commercial, residences, and there are two sources which release the wastewater into the environment.
First, sewage/community wastewater is the kind which has been expelled from domestic premises such as institutions, residence etc. and commercial establishments which are organic because of the consistency of carbon composites alike vegetables, human waste, paper etc (CitationZhou & Smith). Second, is the wastewater that has been produced by industrial procedures, which is also organic in composition ([HRC] INC, Citation2019). These pollutions can be dangerous for human body and environment so wastewater should be treated in order to prevent these damages to take place, the process, which purifies the wastewater in order to discharge it back into a watercourse is known as wastewater treatment. Wastewater treatment uses chemical, physical, and biological processes to cleanse wastewater to protect the environment and public health.
Wastewater treatment happens in some infra structures, which are called wastewater treatment plant (Hammer, Citation1986). Generally, a wastewater treatment plant consists of Mechanical treatment, Biological treatment and Sludge treatment sections.
There are different kinds of pollutants and wastes in the wastewater such as, nutrients, inorganic salts, pathogens, and coarse solids etc., which are very dangerous for ecology and human. In order to remove these pollutants, different processes have been exposed. There are specific processes and unit operations in wastewater treatment, which are chemical, physical or biological. All these processes should be considered before deigning a proper wastewater treatment plant, which depends on the characteristics of the wastewater. In this text, a wastewater treatment plant will be designed related to the characteristics of the wastewater.
This project is undertaken to design a wastewater treatment plant with some particular data for Al-Hay city. The data calculation is based on the population of Al-Hay starting from 2018 up to 2040. The project period is expected to 22 years. The grit chamber, equalization basin, screens, oil and grease removal, aeration tank, secondary settling tank, drying beds, and chlorination tank have been designed. Then the values for volume of aeration tank, hydraulic retention time (HRT), f/m ratio, return sludge flow rate, sludge production and oxygen requirement have been calculated. Some criteria have been made during designing the WWTP. Particularly, the recommendation is to reduce these assumptions as many as possible to achieve the more accurate and reliable results. In addition, this designing process is suitable for this particular situation, and it cannot be followed for every situations. Designing a wastewater treatment plant depends on the characteristics of the wastewater so the designing process should be analysed carefully because even a small mistake can be fatal. Based on the analysis, the sludge produce is from 3339.18 to to 4487.58 kg/day. The high observed yield as it is detected with values ranging from 0.2 to 0.6 kgVSS/kg(BOD5). The sludge retention time is equal to 27.7 day. These results are related to biological tank for Al-hay WWTP is worked during with high efficiency. Thus, the variation of principal parameters concentration of effluent of wastewater is given by GPS X analysis.
After design calculation, the data are analysed too by GPS X program. The design is applied and GPS-X modelling has been applied to the simulation of the WWTP scale. GPS X modelling has been an important part of carrying out the simulation and testing the design. The GPS X simulation has been done on biological treatment. For calibration of the model, it is needed to evaluate the operation of the plant; it needs to include all physical processes of the scale plant. In the analysis, sympathy was accomplished and some critical parameters that affect the performance of the treatment plant were predicated.
Modelling for Al-Hay WWTP has been done with extended aeration process, that one is started with the influent flow, aeration tank and two secondary tank (clarifier tank) ending with the effluent flow. Simulation is exhibited at 5 days and then at 20 days. The charts elucidate the correlation between total suspended solids and influent flow, COD bar chart, and the other results showing an emblematic diagram for the Al-Hay WWTP system. More analyses are needed to investigate other units in the WWTP system.
There are some recommendations for better performance regarding to the design criterion, management and operational issues. The excess flowrate must be treated by introducing a new concept that can help to improve in the removal of organic and nutrient of the plant. Besides that, at the beginning of the treatment, a flow meter should be installed to control the process. For operational denitrification, sufficient anoxic volume, proper carbon and mixed liquor recirculation are needed. Finally, monitoring and maintenance activities should be conducted and the operator maintaining the treatment plant should have aware of the unit processes in case of the failure of these units.
Acknowledgements
I gratefully acknowledge Al-Hay Wastewater Treatment Plant for providing necessary information during the investigation of this research. I also thank Dr. Muhammad for his assistance during the GPS X modelling and for his helpful recommendations during the study.
Additional information
Funding
Notes on contributors
Nuralhuda Aladdin Jasim
Nuralhuda Aladdin Jasim This is a short summary in which the author (Nuralhuda Aladdin Jasim) uses GPS X modelling for design wastewater treatment in Al-Hay city. The criteria also are considered in this research during the design of wastewater treatment plant. Also, the aim of this paper is to verify the treatment process design of Al-Hay wastewater treatment plant (WWTP). The author’ activities are to work on nanotechnologies technique. The papers have been published based on nanoparticles in which investigating the properties of natural organic matter affect the impact of nanoparticles on plants, the dispersion of nanoparticles and their effect on plants and other researches paper regarding to nanoparticles area. The author also is interested in water treatment using different coagulants either natural or synthetic coagulants used in water treatment. She is very interested in GIS technique by doing spatial analysis of forest biomass in some state located in different areas.
References
- Anjum, M., Al-Makishah, N. H., & Barakat, M. A. (2016). Wastewater sludge stabilization using pre-treatment methods. ScienceDirect. doi:10.1016/j.psep.2016.05.022
- Avijit, M., Md, A., & Mhia, M. Z. (2018). Design and feasibility analysis of a low-cost water treatment plant for rural regions of Bangladesh. AIMS Agriculture and Food. 3(3), 181–33. doi:10.3934/agrfood.2018.3.181
- Culp, R. L., Clup, G. L., & Wesner, G. Mack. (1978). Handbook of advanced wastewater treatment (2nd ed.
- Davis, M. L., & Cornwell, D. A. (2008). Introduction to environmental engineering. McGraw-Hill Companies, New York.
- Deborah, P., Silvia, F., Mariantonia, Z., Giuseppe, G., & Lorenza, M. (2016). Evaluation of the energy efficiency of a large wastewater treatment plant in Italy. Applied Energy. 161, 404–411. doi:10.1016/j.apenergy.2015.10.027
- Eu, E. E. A. Sludge treatment and disposal: Management approaches and experiences. ISWA, Denmark.
- Feyzbakhsh, S., Telvari, A., & Lork, A. (2017). Investigating the causes of delay in construction of urban water supply and wastewater project in water and wastewater project in Tehran. 3(12), 1288–1300. doi:10.28991/cej-030958
- Hammer, M. J. (1986). Water and wastewater technology.
- Hubble, Roth and Clark (HRC) INC. (2019). Project plan for wastewater treatment plant upgrades (pp. 48302). Michigan: Bloomfield Hills.
- Janssen, P. M. J., Meinema, K., & van der Roest, H. F. (Eds.). (2002). Biological phosphorus removal: Manual for design and operation. London, IWA: STOWA.
- Judd, S. J. (2015). The status of industrial and municipal effluent treatment with membrane bioreactor technology. 305, 37–45. doi:10.1016/j.cej.2015.08.141
- Karia, G. L. & Christian, R.A. (2006). Wastewater treatment :concepts and design approach (1st ed.). New Delhi: Prentice-Hill of India.
- Karkush, M., Abdul Kareem, M., & Jasim, M. (2018). Ultimate lateral load capacity of piles in soils contaminated with industrial wastewater. Civil Engineering Journal. 4(3), 509–517. doi:10.28991/cej-0309111
- Kim, K., Jung, J., & Han, H. (2019). Utilization of microalgae in aquaculture system: Biological wastewater treatment. Emerging Science Journal. 3(4), 209–221. doi:10.28991/esj-2019-01183
- Kulkarni, U. (2011). Grit removal and treatment for sustainable grit recycling. Indian Environmental Association. Retrieved from: http://ev.ldcealumni.net/papers/ATE_HUBER.pdf
- Marc, B., Birgit, B., Marc, B., Ewa, B., Julian, F., Elisabeth, S., … Christa, M. (2018). Evaluation of a full-scale wastewater treatment plant upgraded with ozonation and biological post-treatments: Abatement of micropollutants, formation of transformation products and oxidation by-products. Water Research. 129, 486–498. doi:10.1016/j.watres.2017.10.036
- Metcalf & Eddy, Inc. (2003). Wastewater engineering treatment and reuse.Boston: McGraw-Hill.
- Papoutsakis, S., Miralles-Cuevas, S., Oller, I., Sanchez, J. L. G., Pulgarin, C., & Malato, S. (2015). Microcontaminant degradation in municipal wastewater treatment plant secondary effluent by EDDS assisted photo-Fenton at near-neutral pH: An experimental design approach. Catalysis Today. 252, 61–69. doi:10.1016/j.cattod.2015.02.005
- Parsa, N., Khajouei, G., Masigol, M., Hasheminejad, H., & Moheb, A. (2018). Application of electrodialysis process for reduction of electrical conductivityand COD of water contaminated by composting leachate. Civil Engineering Journal. 4(5), 1034–1045. doi:10.28991/cej-0309154
- Ronan, G., Julien, R., Romain, M., Emmanuelle, V., Catherine, M., Fabrice, N., … Vincent, R. (2019). Organic micropollutants in a large wastewater treatment plant: What are the benefits of an advanced treatment by activated carbon adsorption in comparison to conventional treatment? Chemosphere, 218, 1050–1060. doi:10.1016/j.chemosphere.2018.11.182
- Rungnapha, K., Hardy, T., Huub, R., & Karel, J. K. (2015). Energy and nutrient recovery for municipal wastewater treatment: How to design a feasible plant layout? Environmental Modelling & Software. 68, 156–165. doi:10.1016/j.envsoft.2015.02.011
- Soomaree, K. (2015). Detail design of wastewater treatment plant. doi:10.13140/RG.2.1.3503.4327.
- Steve, A. C., Jin, L., & Arnold, G. T. (2016). Transport and fate of microplastic particles in wastewater treatment plants. Water Research. 91, 174–182. doi:10.1016/j.watres.2016.01.002
- Zhou, H., & Smith, D. W. Advanced technologies in water and wastewater treatment
Appendix A
Table A1. Influent basic design data
Table A2. The effluent standards discharge to streams