
Abstract
The construction industry has been dealing with numerous issues in order to achieve the projects’ objectives. Hence, caused most projects to suffer low performance, particularly in terms of cost and time overrun and poor quality level. Regarding this matter, the last decade has shown a frequent failure of projects which clearly describes the need for a systematic investigation of the coordination process effects on the performance of the project. The study investigates the impression of coordination factors on projects performance by adopting structural equation modeling (SEM) technique via fit indices and standardised paths. In current research case data were obtained from a questionnaire distributed among owners/developers, contractors, and consultants. A theoretical structural equation model was developed to signify the effect of five main latent variables on project performance. The outcomes showed that projects with high performance have better coordination efficiency. Whereas, planning and scheduling factors (PSF) group is the highest significant group that had a great influence on performance, while records and documentation factors (RDF) group obtained the second important score. Overall, the outcome of this study is expected to contribute to the construction management efforts, particularly in addressing the root causes of poor performance and improving projects success.
PUBLIC INTEREST STATEMENT
In construction projects, coordination is considered as managing dependencies between stakeholders to orchestrate the project lifecycle. Indeed, in this study, a range of coordination factors was selected to fit different situations that interfaces project stakeholders. These coordination factors should provide the stakeholders with the capability to facilitate information, materials and money circulation to enhance projects. Construction projects involve several parties from dissimilar organizations, which might retard the procedure of decision-making and information exchange. This led to the disintegration of their activities and ambiguity in information, inadequate design, and variations. To solve this challenging, activities with uncertainty need coordination to reach a satisfactory performance Coordination factors clarify how project stakeholders interact and integrate their respective contributions to achieve project objectives. Poor coordination between construction projects stakeholders usually results in low performance. Therefore, structural equation modeling (SEM) technique was employed for measuring the effect of coordination factors on project performance
1. Introduction
The strong influence of the construction industry which significantly contributes to the improvement of the economy and socioeconomic growth has been greatly observed in countries all over the world (Finkel, Citation2015). Accordingly, the construction sector in Malaysia is considered as one of the principal economic sectors with an annual contribution of 4% to 6% to the Gross Domestic Product (GDP). Meanwhile, the Malaysian Construction Industry Development Board (CIDB) emphasises that the total investments in the construction industry that managed to be completed were around US$ 25 billion in 2013 with a development approach exceeding the US $ 32 billion in 2016 (Kamal et al., Citation2012). Other than that, the demand for construction industry workforce is expected to rise at a steady pace of 8% to 9%; however, it is equally crucial to note that the construction industry is marred by cost and time overrun as well as poor quality. Regarding this matter, data from government and industry demonstrate that up to 65% projects are currently suffering from schedule and budget constraints violation which subsequently leads to huge disputes (Alaghbari, Razali A. Kadir, & Salim, Citation2007, Rahman, Hameed Mem, & Abd. Karim, Citation2013). In other words, the failure of construction projects is commonly caused by the deficiency of technical abilities as well as several other factors which include insufficient coordination, integration, communication and control of project actions, equipment, and stakeholders (Jaffar, Tharim, & Shuib, Citation2011).
Regarding this matter, it should be noted that essential factors which affect time, cost, and quality status of construction projects have been extensively investigated within the construction projects research trend in the Malaysian environment (Rahman et al., Citation2013). However, it is difficult to understand the effects of coordination factors on performance issues due to the limited number of researches in this area. In addition, existing research failed to provide a detailed discussion which can help to prevent the poor performance of construction projects, especially in creating an area-specific determination of coordination factors without considering performance effect in a quantifiable approach. Hence, this certainly indicates that quantification of the relationships among coordination factors and construction projects performance is a critical topic for investigation (Chang & Shen, Citation2009). Regarding this matter, coordination in construction projects can be described as a process that manages uncertainty as well as orchestrates collection, storing and exchange of information, materials, and money. Generally, coordination is defined as a practice of handling dependencies between tasks and connecting together dissimilar portions of a project to achieve a collective group of objectives (Malone & Crowston, Citation1990). Therefore, the coordination process commonly involves a wide range of project tasks associated with the management of resources. On a more important note, the present study consists of two main objectives described as follows: (1) to investigate the effects of key coordination factors on project performance, and (2) to develop a Structural Equation Model (SEM) for the purpose of investigating the association of quantifiable influence assessment with recognised coordination factors and construction project performance.
The primary aim of the current research is to offer a deep understanding of the impact of five latent variables and their basic coordination factors on the final project performance. More importantly, the proposed model can be utilised to provide an enhanced understanding of the relationships between the coordination factors and projects performance indicators, followed by a number of recommendations for effective intervention in construction projects. Meanwhile, the present study is important to be conducted due to the frequent failure of construction projects in adhering to the schedule, cost, and quality constraints as well as the ambiguity of the coordination factors that tend to influence the performance of construction projects. Similarly, the current research provides a significant contribution to the methodological development by highlighting the use of SEM in the difficult field as well as detailing an outline for appreciative the multifaceted connections between the latent variables in the construction field. In the occasion of the successful construction industry, minor critical issues should be discussed by emphasising the main concerns against the apparent problems among the construction parties in enabling suitable business practices to accomplish better performance.
2. Literature review
Communication and coordination problems tend to occur in most construction projects due to the involvement of several parties from different organisations in the project lifecycle. Hence, this may interfere with the procedure of decision-making and information exchange (Hossain, Citation2009). According to Finkel (Citation2015), the fragmented environment of the construction projects has been causing continuous criticism on its performance. Regarding this matter, participants involved in a project are inclined to make their own decision without coordinating with other important members which will affect the process of decision-making. Apart from that, this may lead to the disintegration of activities, thus causing ambiguity and inadequate design as well as various changes throughout the construction phase. Therefore, activity with higher uncertainty requires greater coordination efforts to accomplish a satisfactory level of performance in order to solve the mentioned difficulties. In other words, the level of coordination required for any project is dependent on project constraints (Jha & Iyer, Citation2006, Mbugua et al., Citation1999; O’brien, Fischer, & Jucker, Citation1995).
The relationship between the coordination process and project performance has been attracting considerable attention for the past years with equivalent consideration received from industry practitioners (Chang & Shen, Citation2009). More importantly, a vast literature on coordination process exists in different disciplines. According to Crowston and Osborn (Citation1998), the theoretical framework of the coordination process is part of the coordination theory which is known as “a body of principles about how the activities of separate actors can work together harmoniously”. Regarding this matter, practitioners commonly regard coordination as a condition of dependency, connections, or how to work together smoothly. In other words, project participants and members are suggested to coordinate their work and activities using a number of factors which include meetings, plans, and contract documents. Nevertheless, these factors are frequently applied out of suitability or preference instead of efficiency (Iyer & Jha, Citation2003).
Furthermore, Saram and Ahmed (Citation2001) proposed the need to conduct an investigation that focuses on identifying the coordination factors. Meanwhile, the main factors are represented by the role of the main players in construction projects which considers coordination measures related to information and skills of parties that significantly contribute to project performance. More importantly, the highlighted coordination factors exhibit several relationships between implementation parties, the vision of operators and service mainstay of the project activities, reliance among agencies, info interchange, and dealing of conflicts. However, a thorough argument has been presented by Camerer and Knez (Citation1997) in their study on the effective performance of coordination factors. The factors dependence and sharing are the most important issues that are aimed to facilitate the work and sharing expertise for concern work methods which are reported by written correspondence (Hossain, Citation2009, Kagioglou, Cooper, & Aouad, Citation2001).
A study on the coordination process by Iyer and Jha (Citation2003) managed to discover a total of 59 factors for construction projects in the Indian construction industry. The findings of their study led to the development of primary factors based on the interview conducted among field experts. Apart from that, a questionnaire survey was distributed among construction professionals in which the top seven factors influencing project coordination were selected, whereas factors with less importance were eliminated. The results of their study revealed that project performance tends to be affected to a certain extent by a number of factors which include the preparation of project quality plan, contract and agreement implementation, estimation of the optimum resource requirements and follow up between parties.
Regarding this matter, the American Society of Civil Engineers (ASCE) has suggested a number of factors and procedures that can help to accomplish construction projects coordination described as follows: (1) well-defined project goals, (2) time frame, (3) cost distribution, (4) written agreement clarifications, (5) regular and progress reports, (6) joint evaluations of documents, (7) distribution and analysis of site reports and tests results, (8) joint visits to project sites, (9) variation order processes, and (10) meetings (Simatupang, Wright, & Sridharan, Citation2002). More importantly, all the factors managed to be obtained from long and intensive research that was conducted for the purpose of improving construction projects performance (Hai, Yusof, Ismail, & Wei, Citation2012). Meanwhile, construction projects in Hong Kong further classify staffing, technical, and management system into three main groups which are comprised of sixteen coordination factors. In this case, the most proficient factors include sufficient site office meeting, adequate technical and financial support from head office, good phasing of work, and a clear communication path (Chang & Shen, Citation2009; Hossain, Citation2009).
In summary, previous studies have managed to provide an enhanced understanding of coordination factors that are important in construction projects. Nevertheless, most of the factors are related to industries, thus creating a gap for the casual relationship between coordination factors and construction project performance. As can be observed in Table , a total of sixteen (16) utmost coordination factors manage to be identified and moulded into five main groups as obtained from the literature review.
Table 1. Indicators/measurement factors of constructs
In view of the above-nominated factors, most past research clearly demonstrated the importance of identifying critical factors that affect project performance as well as the main concerns that can be concluded from a different view of stakeholders regarding construction projects. Nevertheless, the quantification of the effect of coordination factors on project performance has not yet been explored by past research. Therefore, it is essential to determine the relationship between the quantitative impacts of effective coordination factors and their relations to project performance (Chan & Kumaraswamy, Citation1996).
3. Methodology
The present study applied a mixture of quantitative and qualitative data collection approaches for investigation purposes. The first phase was a literature review, followed by semi-structured interviews in the second phase (Creswell, Citation2013). In this case, a total of sixteen (16) selected factors that can be adapted for construction projects were adopted and approved as the most common in the mainstream of construction projects after being shown to five construction experts and senior project managers. Meanwhile, another important achievement from this stage refers to further classification of factors under five coordination groups as well as respective coordination factors in the hypothetical construct as presented in Table . The purpose of the two stages was mainly to collect and classify the most common coordination factors. Next, the third phase involved the questionnaire survey which seeks to gather data for the Structure Equation Modeling (SEM) analysis.
The questionnaire designed for the present study was to measure project performance, coordination factors extent of application as well as other questions that revolve around identifying and recognising the profile of both participants and their organization. In this case, a 5-point Likert scale was utilised to answer the questions about the coordination factors whereby 1 indicates “Very low” and 5 represents “Very high” as shown in Appendix A. Moreover, Likert scales have been widely agreed as a common method that is able to collect data regarding the view and beliefs of participants in questionnaire surveys. Theoretically, Likert scale outcome data are ordinal, in other words, the reply options have a meaningful order. However, it is important to understand that the numbers are not meaningful. Nevertheless, the questionnaire developed for the current research was discussed with the same five professionals prior to a full-scale distribution for the purpose of ensuring the suitability of the language, arrangement, and sequencing of questionnaire questions (Groves et al., Citation2009).
Structural Equation Modelling (SEM) is a tool that can access a sequence of interdependent associations between the dependent and independent variables in a measurable way. According to Fornell and Larcker (Citation1981), SEM is a comprehensive statistical technique that examines the hypotheses of the relationships between observed and latent variables. However, SEM has not been widely used in construction management investigation despite its extensive use in other disciplines. In addition, it should be noted that the SEM technique is far more valuable than multiple regressions, particularly in the condition of unwell measured variables. Hence, this clearly suggests that SEM is extremely efficient in terms of representing the direct and indirect influences of latent variables on the measured factors in the hypothetical paradigm. Kline (Citation2015) further emphasised the effectiveness of the SEM technique in a number of past researches, particularly in identifying the associations among significant correlative influences.
Typically, the covariance-centred SEM technique requires a large sample size due to its fundamental goal of a hypothesized model fitting analysis and validation. Nevertheless, a major difference exists in the definition of the word “‘large’ across several disciplines. However, the rule of thumb recommends the data scope for covariance-centred SEM to reach the amount of 10 times of the free parameters of the model. On the other hand, one of the consistency issues in the present study refers to the heterogeneity of the questionnaire sample which was selected through a cluster of respondents representing the main parties across the construction industry. In addition, the required sample size is rather dependent on model complexity, assessment technique, and distributional properties of measured variables. Creswell (Citation2013) deliberated that it is essential to define the lowest sample size that is required to reach the desired degree of statistical power with a suggested model prior to data gathering. However, Kline (Citation2015) proposed a ‘critical sample size’ of two-hundred responses despite a slight agreement on the suggested sample size for SEM analysis. Presumably, any sample larger than two hundred may be able to offer adequate statistical power for data analysis. Meanwhile, it is crucial to understand that the sample size required is influenced by the normality of the data and assessment technique applied in a study. Moreover, guaranteeing multivariate normality in the opinions and views-based questionnaire dataset is a critical assignment because the data could be biased due to the participants” inconsistency. Therefore, the sampling distribution (not necessarily the data itself) is considered to be normally distributed based on the following conditions:
Sample size (n) is larger than 30; or
Minimum 5 levels of the ordinal scale.
No extreme values—and it is basically impossible to have on a Likert scale since choices are limited.
The variance of the two samples being compared is roughly equal but this is not a problem if n > 30.
As suggested by Fornell and Larcker (Citation1981), the collected sample in the present study can be considered as adequate from the quantity which allows the normal distribution to be assumed as well. Regarding this matter, a number of preliminary discussions and e-mail connections were conducted with key respondents in order to seek the largest potential feedbacks for the purpose of clarifying the purpose of the current research. In spite of the several efforts to obtain a large number of feedbacks (target of more than 350) for the present study, approval of readiness to contribute was collected from 325 participants covering 85 organisations out of the total of 610 questionnaires distributed with a response rate of 53.27 %.
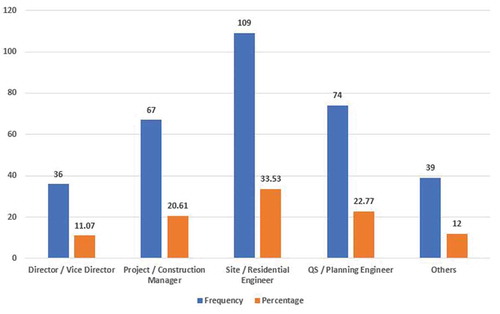
The data collection process which utilised a questionnaire survey was conducted among the practitioners of construction projects in a northern part of Peninsular Malaysia as well as the city of Kuala Lumpur. Most of the respondents involved in the survey have been responsible for managing several types of construction project over the past years. Moreover, the collected data for the variables were keyed into the SPSS software for the purpose of descriptive analysis. The position results of the respondents showed that most of the respondents are Site/Residential Engineers (33.53 %) considering that this position is the most common in construction projects. The next cartage is represented by QS/Planning Engineer (22.77 %), followed by Project/Construction Manager (20.61 %). Contrastingly, the least number of respondents is represented by Director/Vice Director (11.07 %) due to the difficulty of accessing this position. Apart from that, other cartage includes civil and structure engineers along with electrical and mechanical engineers, as shown in Figure .
Figure 1. Position of Respondents in Organisation
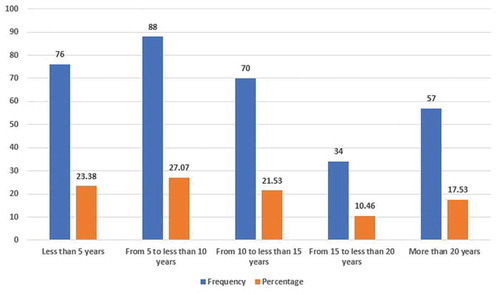
Another relevant variable for the present study refers to the professional experience of the respondents. The findings revealed that most of the respondents (27.07 %) have a working experience between 5 to less than 10 years of in construction work. At the same time, about 18 % of the respondents have more than 20 years of working experience as presented in Figure .
Figure 2. Respondents Years of Experience
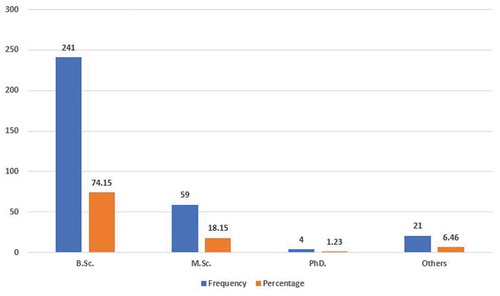
On another note, the large number of experts who answered the questionnaire were able to provide trusted and accurate results. Figure shows the educational background of respondents that were involved in the exercise.
Figure 3. Respondents Level of Education
In the case of the current research, the work environment conditions, and characteristics of organisations are very critical in the application of the coordination process that requires further investigations. The results of the organisation profile are illustrated in Table and it can be observed that most of the respondents (around 60 %) are working in the private sector. However, the Non-Governmental (NGO) segment is represented by less than 3%, followed by 38.2 % who work in governmental agencies. Meanwhile, the results concerning the organisation function show that the highest percentage of 39.07% represents the contractors, followed by the Owners/Developers (31.39 %), and the consultants (29.53%) from the total sample. Additionally, the aggregation revealed a relative balance of the distribution of organisation by function. The number of permanent staffs in the organisation illustrates that the largest part of the sample (about 60 %) has more than 40 employees. Therefore, this indicates that most of the sample is from the largest organisations in the construction industry; hence, they are expected to have good knowledge and practice about coordination.
Table 2. Questionnaire respondents’ organizations profile, frequency and percent
As evident from the above profiles, a total of 325 reliable feedbacks returned by carefully chosen participants with a related practised of the contextual and strong link of study objectives. Hence, all the feedbacks accordingly deliberated as appropriate for SEM investigation. More importantly, all the participants in the current research have been involved in big construction projects in Malaysia, with a combination of clients, architects or consultant as well as head contractor firms.
The present study applied the Structural Equation Modeling (SEM) with the aim of computing the path coefficients through the reduction of the variances among sample covariance as well as those estimated by the proposed model. Next, the model fit in SEM will conduct the maximum likelihood prediction methodology which is dependent on the multivariate normality that reproduces the correct measure of associations among the latent variables.
The causal arrangement of inter-variable associations within the theory has been initially identified with the aim of defining whether a hypothesised theoretical model is consistent with the data received to represent the theory. In particular, the consistency is assessed using model-data fit which specifies the reasonability of the extent of the proposed path diagram regarding the associations among the variables. Typically, a hypothesised model is verified with an equation scheme using SEM (Kline, Citation2015). More importantly, SEM is an influential statistical method that mixes the benefits of measurement model or confirmatory factor analysis (CFA) and structural model into a concurrent statistical analysis. Generally, SEM is mainly appreciated in subsequent data exploration and hypothesis testing, particularly when the outline of inter-association between the constructs are identified before and stranded in reputable theory. Furthermore, it has the ability to model associations between several forecasters and measured variables as well as statistically checks the hypotheses against observed data using CFA. In general, the technique is employed to investigate the causal relations among variables. As previously defined, the measurement model is interested in the technique used by different exogenous variables in quantifying latent variables.
The measurement models within SEM include evaluations of exogenous measurement errors variables as well as their proposed latent variable. Moreover, the structural model is interested in modeling the associations among latent variables. Specifically, this technique examines the extent to which changes in one variable are linked to the changes in one or more variables based on the association coefficient. SEM is frequently applied because it permits the measurement of many variables and their inter-associations concurrently. Apart from that, it is further adaptable compared to other multivariate methods because it allows for simultaneous, multiple dependent relationships among variables (Fornell & Larcker, Citation1981). Hence, SEM was selected to test the research model, while AMOS 20.0 was used to conduct the analyses. Therefore, the proposed model was applied on SEM to test the rationality of the observed variables of each latent variable. Next, the proposed model was modified to improve the goodness-of-fit. Figure depicts the flowchart of five steps involved in SEM analysis.
Figure 4. SEM analysis flowchart
3.1. Model specification
The first stage is known as a model building which focuses on identifying the relations of the latent variables as well as specifying their method of measurement. In most cases, model specification is considered as the most important and challenging stage because every stage is dependent on it. Hence, it is crucial to identify the most appropriate model and correctly select the measured variables that represent the latent ones to ensure that the model is well developed. Moreover, the model should be specified based on theoretical and practical knowledge of the issue (Lei & Lomax, Citation2005).
3.2. Model identification
One important rule is that the number of free parameters should not surpass; hence, the ideal number must be considerably less than the number of observations required to satisfy SEM determination conditions. Accordingly, the greatest method to reduce the number of parameters is to eliminate paths that are not assumed by the applied theory and knowledge. For instance, a total of five paths, namely PSF, RMCF, RDF, CIF, and QVF which lead the performance to its measured variables. On the other hand, one path from a latent variable to its measured variables must be fixed to solve the equations in SEM. Moreover, what is fixed, or the fixed value is not considered a constraint. In the case of the reliabilities of the measured variables being identified beforehand, it is better to make the constraint on the highest reliability variable. However, the constrained path is normally given a value of 1 for the sake of simplicity (Lei & Lomax, Citation2005).
3.2.1. Estimation
The purpose of this stage is to specify and fix model, followed by the constraint of some of the paths or variances to enable the estimate process of the parameters. Hence, the present study adopted the maximum likelihood method by default because it is not reliant on the scale of measurement (Kline, Citation2015).
3.2.2. Test of fit
This stage aims to confirm the ability of the model fit to collect data after running the model. In the case of SEM, the following three criteria should be taken into account: (1) check the signs of the coefficients, (2) identify if they are statistically significant, and (3) use χ2 analysis to check the model. Meanwhile, other indices can be grouped into a couple of central groups which are comparative fit and variance clarified. Nevertheless, with one exception, all of them were scaled between 0 and 1 with larger numbers representing a better fit that have a cut-off value of 0.90. Apart from that, the common comparative fit index is the Normed Fit Index (NFI) which checks if the model differs from the null hypothesis or none of the variables is related to each other. The greatest common measure that is dependent on the accounted quantity of variance in the model is known as the Goodness-of-Fit Index (GFI). Additionally, it should be understood that the model is of borderline significance and can possibly provide some improvements which are further discussed in the next stage (Fornell & Larcker, Citation1981).
3.2.3. Re-specification
This stage is adapted to enhance the model to become a better fit. More importantly, it takes into consideration the two tests that determine whether some variables or paths can be eliminated or if other paths or covariances must be added. In this case, the wrong specification due to misplaced variables is possibly the main cause of a bad fit in PA, SEM, and other multivariable techniques. Hence, the only method to prevent this is to have a basic knowledge of the theory and literature which can facilitate the process of capturing the important variables and paths. Therefore, free parameters must be based on the philosophy and knowledge in the attempt of adding or dropping a covariance term (Kline, Citation2015).
Kline (Citation2015) proposed that the early structural equation model which generally depends on hypothesis and previous empirical outcomes has a minimum potential to satisfy the standard indicators of model fit (like, t-statistics, and R-squares), particularly in the attempt of developing a final structural model. Hence, a realistic model must be chosen by relying on the suggested goodness of fit (GOF) indicators as well as a model that is able to fulfil both hypotheses. Therefore, GOF was chosen for SEM analysis in the current research.
The above discussion made it possible for the theoretical foundation to establish the study framework for the current research. Hence, it is hypothesized that (i) Planning and Scheduling, (ii) Resource Management and Contacts, (iii) Records and Documentation, (iv) Contract Implementation, and (v) Quality and Value Engineering affect the performance of construction projects. Accordingly, the present study set out the following hypotheses with the aim of investigating the effects of these five key latent variables on construction projects performance:
Hypothesis 1: Planning and Scheduling Factors (PSF) affects the overall Project Performance.
Hypothesis 2: Resource Management & Contacts Factors (RMCF) affects the overall Project Performance.
Hypothesis 3: Records and Documentation Factors (RDF) affects the overall Project Performance.
Hypothesis 4: Contract Implementation Factors (CIF) affects the overall Project Performance.
Hypothesis 5: Quality and Value Engineering Factors (QVF) affects the overall Project Performance.
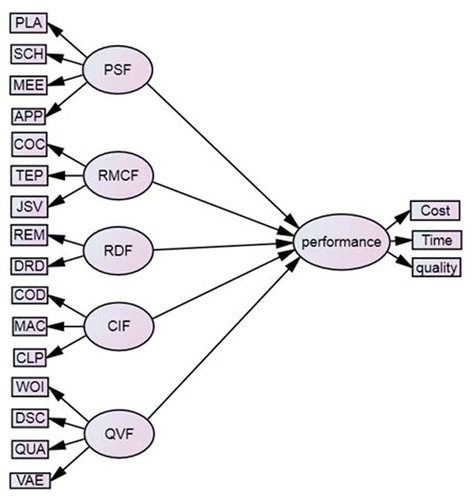
In this model, a total of sixteen (16) coordination factors were included as the observed variables. Meanwhile, five (5) latent factors were identified using special features of SEM as the indicators for the observed variables. The final SEM-coordination Factors-Path Model includes a total of 24 interactive coordination-path scenarios whereby each is derived from one of the coordination factors sources that are inherent in project performance. A proposed graph of the structural model is illustrated in Figure in which the arrows demonstrate the route of theorized effects in the proposed structural model.
Figure 5. Hypothetical model of the latent variables affecting project performance
4. Results and discussion
The purpose of analyzing the validity and reliability was to decide the accuracy of the collected data obtained from the questionnaire. Accordingly, three tests were conducted to assess the appropriateness of the model relative to the associations amongst the latent variables as well as the basic measured factors. Meanwhile, the reliability test of the measurement factors illustrates the power of the measurement of the latent variables via the subjective scale that is relative to the error in judgmental preferences. In the present study, the consistency of the measurement model was subsequently recognized after conducting Cronbach’s reliability analysis as suggested by (Creswell, Citation2013). The cut-off point of 0.7 was used to specify the adequate level of preliminary consistency. The factors measuring all five latent variables in the last SEM resulted in a high degree of reliability between 0.751 to 0.914 which exceeded the cut-off point as illustrated in Table .
Table 3. Individual items reliability and constructs validity
Next, analysis with an Average Variance Extracted (AVE) and communality from latent variables was implemented following the Cronbach’s alpha analysis. AVE determines the quantity of difference captured by a latent variable from its measurement items that are relative to the amount of variance due to measurement errors. Moreover, a rudimentary supposition is that the average covariance among indicators must be positive. The analysis results presented in Table confirmed that the AVE and the communality of all constructs are more than 0.50. Hence, it can be concluded that at least 50% of measurement variance is apprehended by the latent variable with the cut-off values of 0.7 for CR, while all the measured values are larger than 0.7. Therefore, the measurement model was considered satisfactory with the evidence of adequate reliability and convergent validity.
Table 4. Factors cross loading on the latent variables
On another note, a discriminant validity analysis was carried out in order to determine the extent to which a specified latent variable is dissimilar from another. In the current research, the cross-loadings analysis was adopted to check the discriminant validity of the measurement model. More importantly, this analysis of cross-loadings must produce an outcome that provides greater association amongst the measurement variables as well as the corresponding latent variables. Apart from that, the suitability of data for factor analysis was evaluated using the KMO test. The value of KMO test for the present study was calculated to be 0.848 which is greater than the cutoff point of 0.6 (Kline, Citation2015). Therefore, the data were suitable for factor analysis. Table illustrates that all measurement factors have greater associations on the relative latent variables in the model which leads to a distinct protest of the discriminant validity of the five latent variables in the model.
The cross-loading value shows a higher correlation level of constructs with their relative variable compared to the correlation of their relative variables with other constructs. Overall, it can be determined that the indicators measured in the present study have satisfied the conditions of discriminant validity. Therefore, the model satisfied the conditions of convergent validity.
The primary hypothesized model shown in Figure was analyzed using AMOS 20.0.0 software. The purpose of adopting AMOS is due to its ability to provide results for saturated and independent models. The saturated model consists of all possible relationships which are defined, whereas the independent model contains estimated minimum numbers of parameters. Hence, this indicates that the two models stand at extreme points, while any proposed model can be in between these two models. In the case of the current research, GOF indicators of the last model managed to satisfy the suggested cutoff points after three iterations as well as deletion and addition of some covariances. Apart from that, various measures of goodness of fit exist; however, all SEM specialists tend to assess the models by calculating more than one of these measures. Kline (Citation2015) recommended that the principles for best-fit measures are to be independent of sample size, accurate, and consistent in evaluating the dissimilarity models. Accordingly, the no-normed fit index (NNFI), comparative fit index (CFI), and the root mean squared approximation of error (RMSEA) were suggested.
Modification indexes that were advised by the analysis software can be used to modify one or more model specifications in order to enhance the fitness. Table which illustrates modification indexes for structural model clearly shows no significant reductions of Chi-Square derived from the addition of new structural relationships in the left column. However, some significant reductions on Chi-Square were expected as a result of adding some covariances among the indicators. Other than that, it was determined that the model can be stable if no additional error covariance added into the measurement model.
Table 5. Summary of error covariance added to structural model run
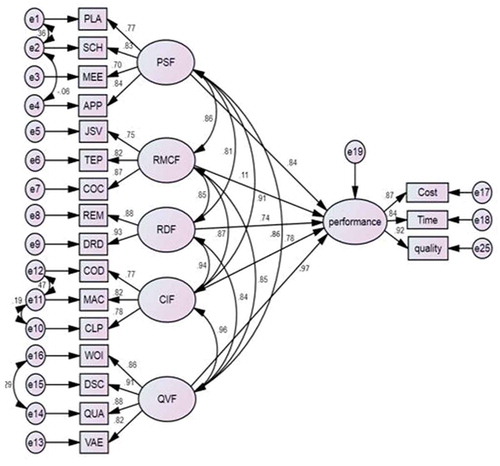
One of the effective features of the structural model refers to the assessment of the modification indices whereby in most cases, theoretically paths may be recommended to enhance the goodness of fit in the structural model. Figure presents the modified model that was developed into the final structural model. As can be observed, entirely significant path coefficients from the primary structural model remain significant, while the power of the influence improves. More importantly, the path coefficient between projects performance and RMCF latent variable improves as shown in Figure .
Figure 6. Final Structural Equation Model of the factors affecting projects performance
Therefore, the final fit indices values of the final structural model illustrate that the developed model managed to fill the collected data successfully because all the fill indices satisfy the criteria as presented in Table .
Table 6. Goodness of fit indices values of the final structural model
Furthermore, SEM is able to check paths between the variables apart from the “goodness-of-fit” measures. The standardisation of the coefficients based on standard deviations of the variables is a methodology that is normally applied to ensure the coefficients are comparable. In fact, the changes in the estimated effect for standard deviation in one variable can be compared to a standard deviation change in another variable. Meanwhile, the causal paths can be assessed in terms of statistical significance and power using the standardised path coefficient which varies between −1 and +1. Apart from that, it should be noted that the statistical results must be greater than ± 1.96 for α 0.05 in order to specify that the null hypothesis can be rejected. The refusal of the null hypothesis indicates that the structural coefficient is not zero. Subsequently, associations power between the variables can then be decided by checking the statistical significance of the standardised paths. According to Chin (1998), standardised paths must be at least 0.20 and preferably more than 0.30 in order to be considered significant for debate. The calculation of standardised paths of a hypothesised model is presented in Table .
Table 7. Standardised paths of a hypothesised model
The interpretation of the path coefficient value (of 0.896) is described as follows: Project Performance can be estimated to increase by 0.81 from its own standard deviations while holding other relevant regional connections constant provided that Planning and Scheduling Factors increases by one standard deviation from its mean. Meanwhile, the positive sign of the coefficient indicates a direct proportion among the variables. Additionally, a more significant variable can be considered as an indicator of coordination factors group for higher coefficient value. The analysis outcomes are recognised to be adequate on all statistical parameters recommended by the statisticians. Hence, the five paths in this hypothesised model were found to be statistically significant. However, the structural model of coordination factors developed can be retained as one of the probable representations of the collected data. Subsequently, five conclusions of direct and significant relationships managed to be drawn as follows: (1) planning and scheduling factors have a positive effect on coordination process, (2) resources management and contacts factors show positive impacts on coordination process, (3) record and documentation factors demonstrate positive impacts on the coordination process, (4) contract implementation factors have positive effects on coordination process, and (5) quality and value engineering factors are shown to be positive with the coordination process.
The final SEM outcomes further suggested all parties participation in plans (APP) as the key factor that provides a significant impact on planning and scheduling group in the Malaysian construction industry. Linking the outcomes to Iyer and Jha (Citation2003), parties participation in the planning stage was stated as one of the main factors in determining the project scope, contractors supervision, observation of growth, and cost and quality adjustment. Moreover, a high positive path coefficient for all parties participation in plans (APP) clearly proposed that the possibility of occurrence of this factor has a substantial effect on the overall impact of project performance. Meanwhile, the second important factor influencing construction project performance refers to the drawing documentation (DRD) which has a coefficient value of 0.87 under the group of records and documentation (RDF). Hence, this result is consistent with a previous study of Saram and Ahmed (Citation2001) which states that precise technical documents such as drawings play a serious part in achieving better performance. Conventionally, drawing documentation in terms of overlapping activities’ coordination and giving execution plan of responsibilities to all parties involved for efficient site management is highly significant in accomplishing improved performance of construction projects.
5. Conclusion
The present study clearly demonstrated the impact of the construction industry as well as the lack of appropriate project performance, particularly in terms of cost, time, and quality. However, a general effort to mitigate the problem of poor performance among the parties involved in construction projects is deemed necessary. More importantly, the significance of coordination process exposed in the current research should be deliberated and better integrated during the project lifecycle to ensure enhanced performance due to the advent of rapid progress in construction projects. Additionally, the present study applied several coordination factors; however, their effectiveness needs to be evaluated to ensure that they are correctly applied. Other than that, the present study also investigated the performance based on the joint influences of the coordination factors. The current study adopted the most common coordination factors in construction projects and other disciplines by further classifying them into five latent main factors. A questionnaire survey was arranged by including the main coordination factors in lieu of the five latent constructs from the literature as well as experts’ recommendations. In this case, a total of 610 questionnaires were distributed to the pre-selected participants; however, only 325 valid feedbacks were analyzed through descriptive statistics and Structural Equation Modelling (SEM). Accordingly, a two-step SEM model was developed to evaluate the five constructs from their constituent variables as well as to check the validity of the hypothesised association. Therefore, the analysis concluded that the hypothesis set for the present study are accepted with a high path coefficient, followed by the development of the last structural model based on the satisfactory principles on GOF indicators.
The results of SEM analysis derived to the conclusion that projects performance can be enhanced by determining the obvious parts and duties of the owner, contractor, and consultant. Nevertheless, there are some limitations despite the best effort placed in the present study and the significant contribution achieved by the present study. Hence, future works are recommended to enhance and refine the constructs. First, the sample data size was not large enough to generalize the SEM results obtained in the present study. Hence, more exploration must be conducted with a greater sample size in order to validate the model. Second, a comparable study for infrastructure projects in all their types might yield dissimilar results. Third, the SEM study is fully dependent on the questionnaire data which is known to be belief-based rather than factual project-based information. Accordingly, it is expected that these results will substantially contribute to the construction sector, particularly in assessing and enhancing project performance.
Additional information
Funding
Notes on contributors

Wesam Salah Alaloul
1Wesam Salah Alaloul is currently a Senior lecturer at Universiti Teknologi PETRONAS (UTP) Malaysia. His research interest is construction project management.
Mohd Shahir Liew
1 Bashar S Mohammed, PhD, is currently an Associate professor and Chair of the Department of Civil Engineering, UTP Malaysia. His research interest includes: rubberized concrete, rubberized interlocking bricks.
Noor Amila Wan Zawawi
2 Musa Adamu completed his PhD in Civil Engineering at UTP Malaysia, and he is currently a lecturer in the department of civil Engineering, Bayero University Kano
Bashar S Mohammed
1 Mohd Shahir Liew currently a Professor at the Department of Civil Engineering, UTP Malaysia. He is also the Deputy Vice Chancellor Research and Innovation at UTP Malaysia.
Musa Adamu
1 Noor Amila Wan Zawawi, PhD, is currently an Associate Professor at the Department of Civil and Environmental Engineering, UTP Malaysia. Her area of specialization includes Ocean Engineering, Construction management and sustainability Building materials and technology.
Muhammad Ali Musharat
1 Muhammad Ali Musharat is currently a PhD student at the Universiti Teknologi PETRONAS Malaysia.
References
- Alaghbari, W. E., Razali A. Kadir, M., & Salim, A. (2007). The significant factors causing delay of building construction projects in Malaysia. Engineering, Construction and Architectural Management, 14(2), 192–20. doi:10.1108/09699980710731308
- Camerer, C., & Knez, M. (1997). Coordination in organizations: A game-theoretic perspective. In Organizational decision making. Cambridge University Press. 158–188.
- Chan, D. W., & Kumaraswamy, M. M. (1996). An evaluation of construction time performance in the building industry. Building and Environment, 31(6), 569–578. doi:10.1016/0360-1323(96)00031-5
- Chang, A. S., & Shen, F.Y. (2009). Coordination needs and supply of construction projects. Engineering Management Journal, 21(4), 44–57. doi:10.1080/10429247.2009.11431844
- Creswell, J. W. (2013). Research design: Qualitative, quantitative, and mixed methods approaches. California, United States: Sage publications.
- Crowston, K. (1997). A coordination theory approach to organizational process design. Organization Science, 8(2), 157–175. doi:10.1287/orsc.8.2.157
- Crowston, K., & Osborn, C. S. (1998). A coordination theory approach to process description and redesign.
- Finkel, G. (2015). The economics of the construction industry. New York, United States: Routledge.
- Fornell, C, & Larcker, D. F. (1981). Evaluating structural equation models with unobservable variables and measurement error. Journal Of Marketing Research, 18, 39–50. doi: 10.1177/002224378101800104
- Groves, R. M., Robert, M., Fowler, Jr., Floyd, J., Couper., Mick, P., Lepkowski., James, M., Singer., Eleanor., Tourangeau.,& Roger. (2009). Survey methodology. New Jersey, United States: John Wiley & Sons.
- Hai, T. K., Yusof, A., Ismail, S., & Wei, L. (2012). A conceptual study of key barriers in construction project coordination. Journal of Organizational Management Studies, 1. doi:10.5171/2012.795679
- Hossain, L. (2009). Communications and coordination in construction projects. Construction Management and Economics, 27(1), 25–39. doi:10.1080/01446190802558923
- Iyer, K., & Jha, K. (2003). Analysis of critical coordination activities of Indian construction projects. Proceedings of 19th annual conference of association of researchers in the construction management (ARCOM). UK: University of Brighton. Citeseer.
- Jaffar, N., Tharim, A. H. A., & Shuib, M. N. (2011). Factors of conflict in construction industry: A literature review. Procedia Engineering, 20, 193–202. doi:10.1016/j.proeng.2011.11.156
- Jha, K., & Iyer, K. (2006). Critical determinants of project coordination. International Journal of Project Management, 24(4), 314–322. doi:10.1016/j.ijproman.2005.11.005
- Kagioglou, M., Cooper, R., & Aouad, G. (2001). Performance management in construction: A conceptual framework. Construction Management and Economics, 19(1), 85–95. doi:10.1080/01446190010003425
- Kamal, E. M., Ernawati Mustafa., Haron., Syarmila Hany., Ulang, Norhidayah Md.,& Baharum, Faizal. (2012). The critical review on the Malaysian construction industry. Journal of Economics and Sustainable Development, 3, 81–87.
- Kline, R. B. (2015). Principles and practice of structural equation modeling. New York, United States: Guilford publications.
- Lei, M., & Lomax, R. G. (2005). The effect of varying degrees of nonnormality in structural equation modeling. Structural Equation Modeling, 12(1), 1–27. doi:10.1207/s15328007sem1201_1
- Malone, T. W., & Crowston, K. (1990). What is coordination theory and how can it help design cooperative work systems? Proceedings of the 1990 ACM conference on Computer-supported cooperative work. Los Angeles California, United States: ACM.
- Mbugua, L., Campbell, L. J., Jackson, C. L., Ozelius, L., Slaugenhaupt, S. A., Stephenson, D. A., & Povey, S. (1999). A framework for determining critical success factors influencing construction business performance. Proceedings of the Association of Researchers in Construction Management 15th Annual Conference. doi:10.1046/j.1469-1809.1999.6320101.x
- O’brien, W. J., Fischer, M. A., & Jucker, J. V. (1995). An economic view of project coordination. Construction Management and Economics, 13(5), 393–400. doi:10.1080/01446199500000044
- Rahman, I. A., Hameed Mem, A., & Abd. Karim, A. T. (2013). Significant factors causing cost overruns in large construction projects in Malaysia. Journal of Applied Sciences, 13(2), 286. doi:10.3923/jas.2013.286.293
- Saram, D. D. D., & Ahmed, S. M. (2001). Construction coordination activities: What is important and what consumes time. Journal of Management in Engineering, 17(4), 202–213. doi:10.1061/(ASCE)0742-597X(2001)17:4(202)
- Simatupang, T. M., Wright, A. C., & Sridharan, R. (2002). The knowledge of coordination for supply chain integration. Business Process Management Journal, 8(3), 289–308. doi:10.1108/14637150210428989