
 ?Mathematical formulae have been encoded as MathML and are displayed in this HTML version using MathJax in order to improve their display. Uncheck the box to turn MathJax off. This feature requires Javascript. Click on a formula to zoom.
Abstract
The tragic consequences of vehicles running into infrastructures have raised the need for perimeter protection. One common perimeter barrier is a set of piles or posts in an in-line geometry as an efficient way to contain or redirect errant vehicles. To date, the design of such barriers relies mostly on performing full-scale crash tests. These crash tests are expensive, and it is often practical to run such tests. In this paper, a general yet simple analysis-design model called TAMU-POST was developed to predict the response of a group of in-line piles impacted by a vehicle. TAMU-POST is based on the finite difference solution to the governing differential equation for a beam supported by piles. The piles are represented by single degrees of freedom consisting of a dashpot, a lumped mass, a spring, and a slider. A large number of computer simulations using a non-linear finite element program LS-DYNA as well as the data obtained from two full-scale crash tests were used to calibrate the proposed model. The design quantities are the barrier deflection, the vehicle dynamic penetration defined as the maximum vehicle intrusion into the barrier, as well as other parameters including the bending moment in the piles and in the beams. A Monte Carlo Simulation analysis was conducted using TAMU-POST to evaluate the probability of failure of a group of in-line piles under a given vehicular impact when considering the inherent uncertainties associated with the input parameters and the model coefficients.
PUBLIC INTEREST STATEMENT
Infrastructures are constantly exposed to extreme loading conditions that would cause tremendous damage, injuries, and fatalities. Advancements in computational modeling and design technologies have provided tools to protect our infrastructure against hazards such as vehicle crashes, explosions, security threats, etc. Cost of real-scale testing for certifying infrastructure designs is drastically high. Predictive models and computational techniques are needed to understand the behavior of materials/components under extreme loads for a resilient and sustainable design. This research focuses on one of the most common extreme hazards on infrastructures, vehicle impacts, and design of various crashworthy geo-structural systems through real-scale, component tests, and advanced numerical simulations. First, the response of soil and soil–structure interaction under extreme loads is characterized through laboratory and in-situ tests, pendulum tests, bogie tests, and real-scale crash tests. Computational simulations are developed to replicate these highly nonlinear problems and then validated against the tests. Numerical results coupled with experiments were used to develop a simplified macro-element model to predict pile deflection when subjected to impacts.
1. Introduction
Proper design of anti-ram perimeter barriers becomes crucial when their failure most likely involves tremendous loss of lives and destruction. Groups of in-line piles have been used for such barriers yet little is known about their behavior under lateral impact. Numerous studies have been focused on lateral response of piles under cyclic loading, earthquake loading, and other types of vibration but much less have been done on impact loading. Early work on dynamic soil–pile interaction was first reported by Wolf (Citation1980). Then, a number of analytical approaches were suggested to evaluate soil–pile interaction under cyclic loading (Brown, Morrison, & Resse, Citation1988; El Naggar & Novak, Citation1996; Nogami, Konagai, & Otani, Citation1991; Wu & Fin, Citation1997). These studies made a number of simplifying assumptions. Other studies followed with more advanced input parameters and analytical models (Dobry & Gazetas, Citation1988; Wolf & Somaini, Citation1986).
Most of the impact loading studies have been conducted in the field of roadside safety to develop guardrail barrier systems. These barriers consist of widely spaced piles, referred to as posts in the transportation field, tied together with a rail aimed at safely redirecting errant vehicles. In this work, various design configurations have been studied including post embedment depth, post spacing, and post materials (either wood or steel) under different impact conditions. However, most of the work has consisted of crash testing at full scale without much attention paid to the soil behavior including the development of a simple analysis program as is proposed in this article. This work is described in references such as Abu-Odeh et al. (Citation2014), Abu-Odeh, McCaskey, Bligh, Menges, and Kuhn (Citation2015), Alberson, Menges, and Schoeneman (Citation2001), Bligh, Abu-Odeh, and Menges (Citation2011), Bligh and Menges (Citation1997), Faller et al. (Citation2004). These studies indicated that the guardrail performance in redirecting impacting vehicles largely depends mostly on the soil strength and the pile stiffness.
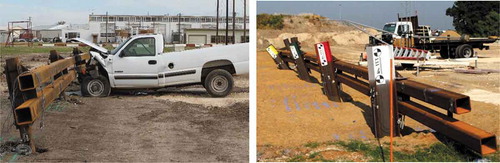
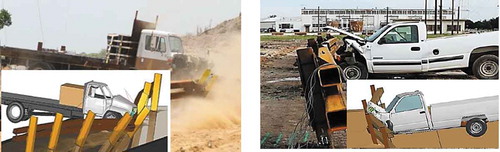
The work described in this article was motivated by the lack and thus the need for a simple analytical approach to design soil-embedded piles subjected to impact loading. The current approach is to perform a full-scale crash test with the right vehicle hitting the right barrier. However, the approach is costly. Numerical simulations are useful to augment the value of the full-scale crash tests but are computationally expensive and require to be validated against full-scale crash tests before they can be used with improved confidence. In previous studies by the authors, two full-scale crash tests, test nos. PU60 and M50 were performed on in-line pile groups (Asadollahi Pajouh, Briaud, Lim, & Mirdamadi, Citation2017). In test no. PU60, a 2300-kg pickup truck impacted head on an in-line group of four HSS6x6x1/2 piles embedded 2 m in stiff clay, spaced 5.2 m apart, tied together with two steel HSS8x8x1/2 beams, and impacted at 96.55 km/h. In test no. M50, a 6800-kg medium-duty truck impacted head on an in-line group of eight steel W14x90 piles embedded 3 min loose sand, spaced 5.2 m and tied together with two steel HSS8x8x1/2 beams, and impacted at 80 km/h. In both cases, the in-line group of piles successfully stopped the test vehicle (Figure ). A number of detailed LS-DYNA simulations were performed to replicate the crash tests (Hallquist, Citation2007). These experiments and the simulation results were then used to develop TAMU-POST. TAMU-POST is a simple code to predict the behavior of a group of in-line piles embedded in the soil, connected by a beam, and subjected to a vehicle impact.
Figure 1. Test No. PU60 (left), Test No. M50 (right) (Asadollahi Pajouh et al., Citation2017)
2. Model theory
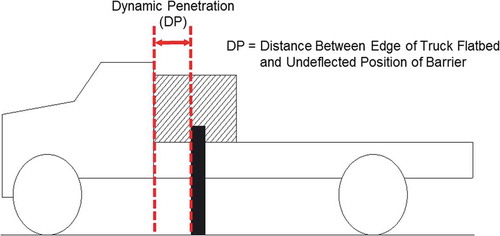
The development of the analytical model had three goals: to be as fundamentally correct as possible, to be simple enough to use without advanced computing, and to predict reasonably well the actual deflection of the barrier. Indeed, the primary parameter to be predicted was the dynamic penetration of the vehicle into the barrier. The dynamic penetration is defined in ASTM F2656-07, “Standard Test Method for Vehicle Crash Testing of Perimeter Barriers” (ASTM Standard F2656, Citation2007), as the distance between the leading edge of the flatbed of the vehicle at maximum displacement during the impact and the undeflected position of the barrier (Figure ). According to the standard ASTM F2656-07, the test designation P1 requires that the dynamic penetration is less than 1 m for the barriers protecting sensitive buildings.
Figure 2. Dynamic penetration
In early studies of piles subjected to static lateral loads, the beam-on-springs foundation approach was used and assumed that the pile was an Euler-Bernoulli beam on a series of springs (Broms, Citation1964a, Citation1964b; Matlock & Reese, Citation1960). The governing differential equation for the beam deflection was developed and the finite difference method was used to solve this equation. The beam-on-springs foundation approach was then modified and extended to the p–y curve method (Matlock, Citation1970; O’Neill, Reese, & Cox, Citation1990; Reese & Welch, Citation1975). For the dynamic behavior, a number of simplified models were used to represent the soil. One of the most common models was proposed by Smith (Citation1960), as shown in Figure ,b). This model consisted of a lumped mass, a spring, a dash pot, and a slider. In the current study, this lumped-parameter model (Smith, Citation1960) was adopted to simulate the soil–pile interaction (Figure )). In this Single Degree of Freedom (SDOF) model, the mass represents the mass of the beam tributary to one pile plus the mas of the engaged surrounding soil. The damper and the spring represent the damping coefficient and the static stiffness, respectively. The soil surrounding the pile fails when the soil deflection reaches the soil-failure deflection. The failure load (Pult) and the associated failure deflection (yf) are discussed later in the paper. When the soil fails, the spring stiffness becomes zero.
Figure 3. Inelastic Models Introduced by Smith (Citation1960): (a) original model, (b) modified model, and (c) selected single degree of freedom model
In order to derive the governing differential equation for the barrier including the piles and the beam connecting the piles together, the following simplification was chosen. The beam was modeled as an elastic beam supported at discrete intervals by soil-embedded piles; these soil-embedded piles were each represented by an SDOF element as shown in Figure ). The complete beam model was thus as shown in Figure . With this assumption, the Euler-Bernoulli beam theory equation relating the beam deflection (y) to the applied lateral load q(x, t) on the beam is expressed as EquationEquation (1)(1)
(1) :
Figure 4. Schematics of analytical model for group of piles: (a) plan view and (b) elevation view
where Eb is the elastic modulus of the beam, Ib is the second moment of area (moment of inertia) of the beam with respect to the axis perpendicular to the applied load, y, and x are the beam deflection and the distance along the beam, respectively, q(x, t) is the transverse load applied at a distance x and at a time t. The load itself was not constant and varied with time; therefore, the equation controlling the behavior of the SDOF mass-spring-dashpot model with an applied load varying with the time t was:
where M is the mass, K the stiffness of the system and C the dashpot constant. Assuming that the bending stiffness EbIb of the beam is constant, EquationEquations (1)(1)
(1) and (Equation2
(2)
(2) ) can be combined to give the governing differential equation for the system.
EquationEquation (3)(3)
(3) is solved for the deflection of the beam (y) using the central finite difference method together with the corresponding initial values and boundary conditions. The beam was discretized into a number of equal length elements h. For each node i at time j, the deflection of the beam y is computed explicitly using EquationEquation (4)
(4)
(4) .
In order to facilitate the numerical solution, the following parameters m, e, and c were introduced.
EquationEquation (4)(4)
(4) is written in matrix form as EquationEquation (6)
(6)
(6) .
Solving these equations for all the node deflections requires solving a simple diagonal matrix equation without the need to inverse the matrices. As such, the beam deflection y at node i at any time step was computed based on the known beam deflections of that node and the adjacent nodes from the previous time steps as follows:
2.1. Initial conditions
The node under impact displaces yi during the first time step Δt and the displacement is given by EquationEquation (8)(8)
(8) .
where Vv is the velocity of the approaching vehicle at the time of impact. This results in an extremely large acceleration at that node. To avoid convergence issues associated with this problem, a very small-time step of 10−5 sec was used in the explicit solution.
2.2. Boundary conditions
Boundary conditions express that the shear force proportional to and the bending moment proportional to
at both ends of the beam are zero. Therefore, the following conditions should be met:
3. TAMU-POST model formulation
The theory described above was applied to a beam supported by piles subjected to a vehicle impact. To optimize the combination of reasonable accuracy and required computational effort, the beam was discretized into 15 nodes and therefore 14 elements (Figure ). This combination was convenient for various in-line group configurations (three to eight piles) and allowed the user to choose the impacted node either at a pile location or at mid-span between two piles. For node at time
the beam deflection
was computed explicitly for a time increment equal to Δt, using the finite difference expression of the differential equation (EquationEquation (4)
(4)
(4) ). A summary of the model input parameters is listed in Table . Note that although the beam was assumed to behave elastically, the model parameters were identified using data obtained from fully nonlinear dynamic numerical analyses (using LS-DYNA simulations) and full-scale crash tests.
Table 1. TAMU-POST model variables
Figure 5. Application of central finite difference approach
4. Numerical simulations
Full-scale crash tests provide the best verification for a given system. Numerical simulations are less expensive, typically less time-consuming, while reasonably reliable once they are calibrated against full-scale crash tests. In this study, a series of numerical simulations were performed using LS-DYNA to augment a database used to calibrate the TAMU-POST model. Attention was paid to select the cases that would best cover various possibilities. For this purpose, an experimental design method based on the space filling technique and called Stratified Latin Hypercube Sampling (SLHS) (McKay, Beckman, & Conover, Citation1979) was used to select the best cases for the numerical work. The stratification and random sampling within the strata incorporated in SLHS guarantee a better convergence and ensure that the selected random samples best represent the real variability.
To determine the strata, the most influential input variables were identified based on experience and engineering judgment. They were the vehicle mass, the vehicle velocity, the soil strength, the pile embedment depth, and the pile spacing each having a range of values (Table ). With respect to soil strength, a statistical sampling was performed for both clay and sand soil types. With respect to the barrier configuration, two barriers of four in-line piles and eight in-line piles were considered as they had been previously crash tested. Tables and give a list of the soil strength categories and parameters for clay and sand, respectively. These tables lead to a total number of cases equal to 90 simulations. Note that for modeling the sand behavior in LS-DYNA, a small non-zero value for cohesion was used to avoid numerical instabilities.
Table 2. Selected design strata for numerical study
Table 3. Soil strength categories and parameters—clay
Table 4. Soil strength categories and parameters—sand
5. Model Parameters
5.1. Lateral Static Stiffness
The lateral soil-pile stiffness (K) in the TAMU-POST model (EquationEquation (3)(3)
(3) ) is the ratio of the load applied at the top of the pile (groundline) and the associated deflection. The behavior of piles subjected to static lateral loading has received a lot of attention since the work of Briaud and Ballouz (Citation1996), Broms (Citation1964a, Citation1964b), Matlock (Citation1970). The SALLOP method (Simple Approach for Lateral Load on Piles) developed by Briaud (Citation1997) was found to be a suitable method for this investigation (Briaud, Citation1997). This method is based on the close analogy between the cylindrical expansion of the pressuremeter and the lateral movement of the pile. The SALLOP method makes a distinction between a long-flexible pile and a short-rigid one. This distinction is based on the transfer length defined as:
where Ep is the elastic modulus of the pile material, Ip the moment of inertia of the pile, Ks the soil stiffness defined as the ratio of the line load P along the pile at a depth z and the deflection y of the pile at that same depth. In this method, the soil lateral static stiffness Ks is given by:
where Eo is the first load modulus from the pressuremeter curve. The pile is considered long and flexible if the pile length is larger than , and considered short and rigid when the pile length is less than
. For piles with an intermediate length (
), a linear interpolation between the long-flexible case and the short-rigid case is used.
In the case of long-flexible piles subjected to a groundline horizontal load (Ho) and a groundline moment (Mo) (Figure ), the shear force V at a depth z and the depth to zero-shear Dv (i.e., depth where the maximum bending moment occurs) is computed using EquationEquations (12)(12)
(12) and (Equation13
(12)
(12) ), respectively.
Figure 6. Horizontal load on a single pile
Similarly, in the case of short-rigid piles, the shear force V at a depth z and the depth to zero-shear Dv can be obtained as follows:
For an impact load, the horizontal impact load (Ho) is usually applied to the pile at a certain height above the ground surface (Figure ). This load creates a moment at the groundline where himapct is the impact height.
According to the SALLOP method, the pile lateral deflection at the groundline for long flexible and short-rigid piles can be obtained using EquationEquations (16)(16)
(16) and (Equation17
(16)
(16) ), respectively.
Using Mo equal to the product of Ho by the impact height himpact in EquationEquations (16)(16)
(16) and (Equation17
(16)
(16) ), the static stiffness of the pile-soil system K, defined as the ratio of the load to the associated deflection is determined using EquationEquations (18)
(18)
(18) and (Equation19
(18)
(18) ) for long-flexible and short-rigid piles, respectively:
5.2. Ultimate Lateral Capacity
In the SDOF model for each pile, a slider with a failure load of Pult was incorporated in line with the spring to account for the failure of the single pile-soil failure (Figure )). If the soil deformation exceeds (i.e., pile deflection at the soil failure), the load becomes equal to Pult and the spring stiffness K is excluded from the computation. In the SALLOP method, the ultimate lateral capacity of the pile, from the soil point of view, is defined as the load corresponding to a pile deflection equal to one-tenth of the pile diameter or width. At that deflection the SALLOP method gives the ultimate lateral capacity Pult as:
where PL is the soil PMT limit pressure close to the surface, B the pile diameter or width, and the zero-shear depth given by EquationEquations (13)
(13)
(13) and (Equation15
(14)
(14) ). If the pressuremeter test data (PL) are not available, other in-situ or laboratory tests results, including the Standard Penetration Test (SPT) blow counts, the undrained shear strength (Su), and the cone penetration test (CPT) point resistance (qc) can be used to estimate PL through, for example, the empirical correlations recommended by Briaud (Citation2013). Finally, the deflection at failure
for an elastic perfectly plastic soil-pile model is given by:
5.3. Mass
The mass (M) attributed to each SDOF includes three terms: (1) the mass of pile (Mp) contributing to the lateral resistance by inertia; this mass is taken as the mass of the pile segment from the ground surface to the zero-shear depth (); (2) the mass of beam (Mb) tributary to the node; this mass is taken as the mass of beam for a length of h (element length) separating two piles; and (3) the mass of soil (Ms) associated with the impact; this mass is considered to be related to the mass of the soil wedge in front of then pile mobilized during the impact (Figure ) and estimated as:
Figure 7. Mobilized soil wedge
Where is the soil density and B is the pile width or diameter.
5.4. Damping
In complex crash analyses, the damping term is difficult to quantify. The damping term in EquationEquation (3)(3)
(3) was used to approximate the unknown nonlinear energy dissipation in the pile-soil system. Although the phenomenon of soil damping under dynamic loading has been discussed in numerous studies (Wolf & Somaini, Citation1986; Roesset, Whitman, & Dobry, Citation1973; Rainer, Citation1974), there is no well-developed approach to quantify soil damping under impact loading. It is believed that damping in vehicle-barrier crashes originates mainly from energy dissipation either through wave propagation in the soil medium known as radiation damping, or through viscous damping associated with the rate effects in soils. Regardless of what type of damping governs the behavior, the damping value C in the simplified model of EquationEquation (3)
(3)
(3) can be back calculated through comparison between the data from full-scale crash tests and comparison with numerical simulations on one hand and the TAMU-POST model output.
In the literature, the dynamic damping of a foundation has been correlated to such parameters as foundation dimension, foundation stiffness, and soil shear wave velocity (Wolf & Somaini, Citation1986). In that approach, damping increases with foundation dimension and foundation stiffness but is inversely proportional to the soil shear wave velocity. Using this established approach, the damping () was correlated to the pile width (B), the soil-pile stiffness (K), and the soil shear wave velocity (VSW). The shear wave velocity (VSW) was estimated as:
where Eo is the PMT first load modulus, is the soil density,
is Poisson’s ratio, and α is a fitting factor. The proposed equation for the damping coefficient C is:
The dimensionless factor α was obtained by optimizing the match between the TAMU-POST predictions with the crash test measurements and the LS-DYNA numerical simulations. A reasonable correlation between α and the pressuremeter limit pressure was found (Figure ) and EquationEquation (25)(25)
(25) .
Figure 8. Dimensionless factor α—damping coefficient
For Medium-Duty Truck
5.5. Energy absorbed in crushing of the vehicle
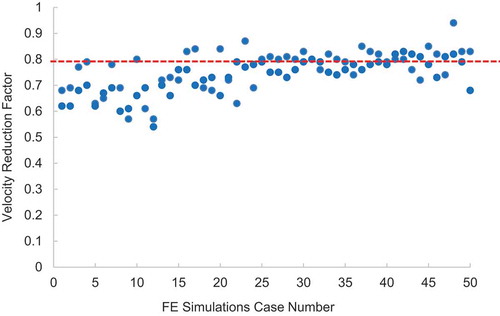
The severity of the vehicle-barrier collision depends on the impact speed, vehicle stiffness, and barrier stiffness. The energy absorbed in the crushing deformation of the vehicle is not accounted for in the TAMU-POST model. To account for the vehicle crushing, a reduction factor () was applied to the vehicle velocity at impact in proportion with the energy absorbed in deforming the vehicle.
where Vv and V0 denote the reduced and initial vehicle velocity at impact, respectively. The TAMU-POST model utilizes Vv (EquationEquation (8)(8)
(8) ). The velocity reduction factor
was determined based on the energy balance in a large number of numerical simulations. If the kinetic energy of the vehicle is EK, the energy expanded to crush the vehicle EC, and the energy expanded to deform the barrier EB, the energy balance is:
The barrier energy (EB) can be obtained from the numerical simulations and the reduction factor can be obtained as follows:
The simulations included three classes of vehicles (medium-duty truck, pickup truck, and small car) as well as different pile group layouts. The values of based on the energy results of all the numeral simulations are presented in Figure . Since a higher value of
is conservative in this case, it appears reasonable to select a crushing factor equal to 0.8 for reducing the impact velocity of the vehicle, thereby including the energy lost in crushing.
Figure 9. Computed velocity reduction factor from numerical simulations
5.6. Crushing length
TAMU-POST predicts, among other results, the maximum deflection of the barrier Dmax. However, the critical measure of interest is the dynamic penetration DP. DP is defined as the distance between the initial position of the row of piles and the front edge of the vehicle flatbed at the time of maximum displacement of the barrier (Figure ). DP can be expressed as:
where DP is the dynamic penetration, Dmax the maximum deflection of the barrier, and LCrushed is the distance between the front bumper of the crushed vehicle at the time of maximum displacement of the barrier and the front edge of the vehicle flatbed. The sign of DP would be negative if the edge of the truck flatbed does not pass the initial position of the piles.
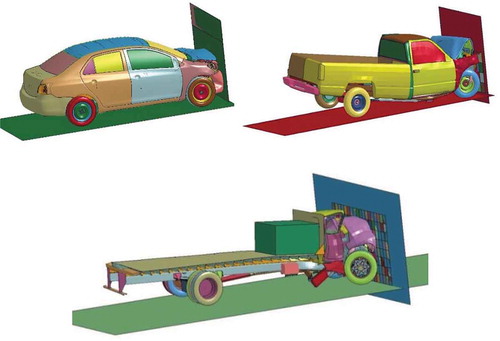
To determine DP, additional analyses were necessary because while Dmax is predicted by TAMU-POST, the crushing length LCrushed is not. Conservative estimates of LCrushed were obtained by simulating crashing vehicles against a rigid wall for each class of vehicle (Figure ). For these simulations, the finite element models of a Toyota Yaris passenger car, a Chevrolet pickup truck, developed by the National Crash Analysis Center, (NCAC, Citation2014), and a medium-duty truck developed by the Texas A&M Transportation Institute (TTI, Citation2009) were used. Note that these values give an upper bound of LCrushed as the impact wall was rigid while the in-line group of piles is more flexible. Such upper bounds lead to larger dynamic penetration values, and therefore are conservative. Table gives the recommended LCrushed values obtained from the simulations for a given vehicle mass (Mv) and velocity (Vv).
Table 5. LCrushed values obtained from numerical simulations
Figure 10. Numerical simulations of vehicles impacting a rigid wall
6. Evaluation of the model
The model precision was evaluated by comparing the TAMU-POST predictions to the results of a large number of computer LS-DYNA simulations covering a wide range of soil and pile properties, pile spacing, impact level (i.e., vehicle mass and velocity), and pile layouts. In addition, TAMU-POST predictions were compared to the results of two full-scale crash tests: tests nos. PU60 and M50 (Asadollahi Pajouh, Briaud, Alberson, Arrington, & Mirdamadi, Citation2015; Asadollahi Pajouh et al., Citation2014). In test no. PU60, a 2300-kg pickup truck impacted head-on at 100 km/h an in-line group of four steel piles (HSS6x6x1/2) embedded 2 m in stiff clay with a 5.2 m spacing tied together with two beams (HSS8x8x1/2). In test no. M50, a 6800-kg medium-duty truck impacted head-on at 80 km/h an in-line pile group of eight steel W14x90 embedded 3 m in loose sand and spaced at 5.2 m and tied together with two HSS8x8x1/2 beams. Figure shows a comparison of the TAMU-POST predictions with the LS-DYNA numerical simulations and the two crash tests. The predictions seem reasonable and somewhat conservative on average.
Figure 11. Maximum deflection predicted by TAMU-POST versus predicted by LS-DYNA
7. Parametric study
In order to assess the influence of the main input parameters, a parametric study was performed using TAMU-POST. These parameters included the ratio of pile spacing to pile width or diameter (s/d), pile embedment depth (L), vehicle mass and velocity (Mv and Vv), soil strength (PL), and number of piles. This parametric study involved two different impact cases: a 2300-kg pickup truck impacting a four-pile (HSS6x6x1/2) barrier and a 6800-kg medium-duty truck impacting an eight-pile (W14x90) barrier. For both barriers, the piles were linked by an HSS8x8x1/2 beam.
7.1. Effect of pile spacing and pile embedment depth
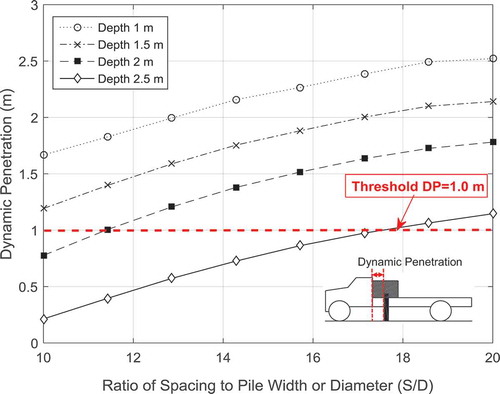
In the case of the eight-pile group impacted by the medium-duty truck, the ratio of pile spacing to pile width (s/d) was varied between 10 and 20 while the pile embedment depth ranged from 1 to 2.5 m. As shown in Figure , the barrier deflection increases significantly with an increase in pile spacing and a decrease in pile embedment. This impact becomes less predominant as s/d increases.
Figure 12. Effect of pile spacing and embedment depth on eight-pile group response
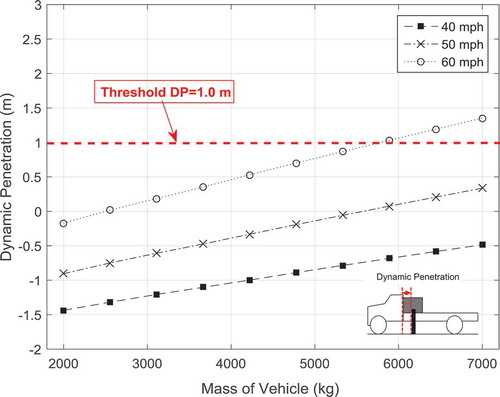
7.2. Effect of mass and velocity of the vehicle
The vehicle mass was varied from 2,000 to 7,000 kg, and the vehicle velocity was varied from 65 km/h to 100 km/h. As shown in Figure , the barrier deflection increases nearly linearly with an increase in vehicle mass and velocity.
Figure 13. Effect of vehicle mass and velocity on four-pile group response
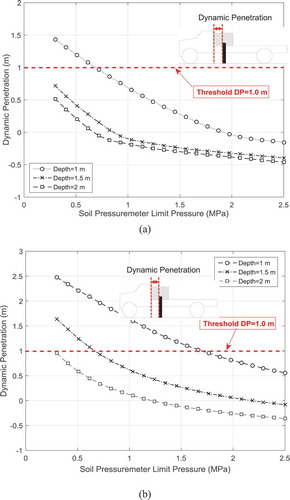
7.3. Effect of soil strength
The maximum deflection of the two different barriers (i.e., four-pile and eight-pile) was studied for different soil strengths and pile embedment depths. The pressuremeter limit pressure (PL) was varied from 0.3 MPa (very soft soil) to 2.5 MPa (very hard soil). The pile embedment depth was varied from 1 to 2 m. As shown in Figure , an increase in pile embedment depth significantly decreases the maximum deflection up to an optimum pile depth. This is particularly true for low strength soils. An increase in soil strength also decreases the maximum deflection. This decrease is not as pronounced for high strength soils.
Figure 14. Effect of soil strength and pile embedment depth: (a) four-pile group and (b) eight-pile group
7.4. Effect of number of piles
In the case of the pile group impacted by a pickup truck traveling at speed of 100 km/h, the number of piles was varied from 3 to 8 while keeping the other factors constant including the pile spacing. As shown in Figure , an increase in the number of piles leads to a decrease in the maximum deflection of the barrier up to 6 piles for this case.
Figure 15. Effect of number of piles on four-pile group response
8. Reliability analysis for TAMU-POST
The proposed model TAMU-POST has been presented as giving a deterministic solution. However, there are inherent uncertainties associated with the input parameters. A reliability analysis using a Monte Carlo Simulation was performed to evaluate the probability of failure for a pile group under a given vehicular impact. Probability of failure is defined here as the probability that the dynamic penetration of the vehicle will exceed 1 m as required by the ASTM standard (ASTM F2656-07). The probability of failure was quantified for two parameters: the soil limit pressure PL and the crushing factor . Table summarizes the features of the statistical distribution considered for these two parameters.
Table 6. Random variables and statistical features (Briaud, Citation2013; Kulhawy & Trautwein, Citation1996)
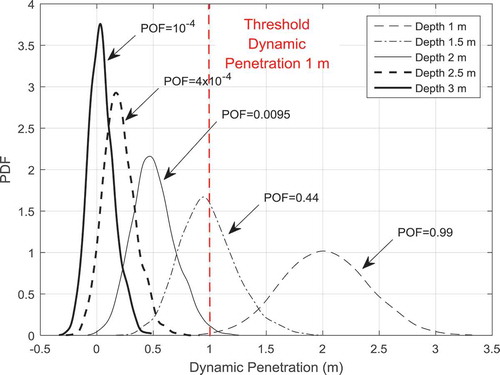
The case considered a soil-pile barrier to contain a head-on impact by a 6800-kg medium-duty truck traveling at 100 km/h. The barrier consisted of an in-line group of eight W14x90 steel piles embedded 3 m in sand with the following properties: PL = 0.8 MPa, E0 = 10 MPa, and ρ = 1900 kg/m3. The piles were spaced 5.2 m and connected by an HSS10x10x1/2 beam. The dynamic penetration was first obtained deterministically by using TAMU-POST as 0.03 m indicating that the barrier would satisfy the safety requirement (0.3 m < 1 M). The probability of failure was then calculated by using the Monte Carlo simulation as 10−4. Then, the pile embedment depth was varied from 1 m to 3 m to evaluate the impact of the embedment depth on the probability of failure. As shown in Figure , the embedment depth has a significant impact on the dynamic penetration and the probability of failure. Indeed, the probability of failure varied from 10−4 for a 3 m embedment to 0.99 for an embedment depth of 1.5 m.
Figure 16. Probability density functions of dynamic penetration and probability of failure—pile embedment depth ranging from 1 m to 3 m
9. Summary and conclusions
A computationally efficient model called TAMU-POST was developed to predict the behavior of in-line pile groups embedded in soil and subjected to the impact of a vehicle with a given mass and a given approach velocity. This model was based on the finite difference solution to the governing differential equation for a beam supported by piles represented by single degrees of freedom with damping, mass, spring, and a slider. This code was then calibrated against full-scale crash tests as well as a series of LS-DYNA finite element simulations. Recommendations were made on how to best obtain the input parameters.
TAMU-POST is much simpler than a computer simulation using FEM programs and much less costly to use than full-scale experiments. Yet, the predictions by TAMU-POST resulted in estimates comparable to those obtained from the full-scale crash tests and numerical simulations. The input parameters can be obtained from common laboratory and in-situ tests. These parameters are the mass and velocity of the approaching vehicle (Mv and Vv), the soil strength quantified by the pressuremeter limit pressure PL or correlation thereof, the pile embedment depth (L), the ratio of pile spacing to pile width or diameter (s/d), the number of piles, and the pile and beam bending stiffness. A parametric study was performed to investigate the influence of each parameter; the results of this parametric study can assist in making more informed design decisions. The limitations of this study include the limited number of full-scale tests. Indeed, numerical simulations used to calibrate the proposed model were validated against only two full-scale experiments. Another limitation of the software is the fact that the plastic behavior of the structural elements (i.e., piles and beams) was not included to keep a simple solution for the differential equation. As such, while it has been shown that the model predicts the maximum deflection of the barrier reasonably well, it is not recommended to use this model for predicting the maximum bending moment in the piles and in the beams. Additional full-scale crash testing and numerical simulations would be required to refine the proposed simple model.
Cover Image
Source: Author
Acknowledgements
The authors would like to acknowledge the U.S. Department of State for sponsoring the project. We wish to recognize the help of Dean Alberson, Akram Abu Odeh, and Dusty Arrington at the Texas A&M Transportation Institute. The authors also wish to acknowledge the Texas A&M University High-Performance Research Computing Facility for providing the computing resources.
Additional information
Funding
References
- Abu-Odeh, A. Y., Bligh, R. P., Odell, W., Meza, A., Menges, W. L., & Ground, T. P. (2014). A MASH compliant W-beam median guardrail system. Transportation research board 93rd annual meeting. No. 14-5558. Washington, DC.
- Abu-Odeh, A. Y., McCaskey, K., Bligh, R. P., Menges, W. L., & Kuhn, D. L. (2015). Crash test and MASH TL-3 evaluation of TxDOT short radius guardrail (No. FHWA/TX-15/0-6711-1).
- Alberson, D. C., Menges, W. L., & Schoeneman, S. K. (2001, May). NCHRP report 350 test 3-11 of the strong post W-beam guardrail with trinity composite blockout (Research report 400001-TRB3). College Station, TX: Texas Transportation Institute.
- Asadollahi Pajouh, M., Briaud, J. L., Alberson, D., Arrington, D., & Mirdamadi, A. (2015). Full scale crash test on a group of piles in clay. Proceedings of the international foundations congress and equipment expo 2015 (pp. 1132–22). San Antonio, TX.
- Asadollahi Pajouh, M., Briaud, J. L., Lim, S. G., & Mirdamadi, A. (2017). Dynamic response of in-line pile groups subjected to vehicle impact. Journal of Geotechnical and Geoenvironmental Engineering, 143(7), 04017024. doi:10.1061/(ASCE)GT.1943-5606.0001676
- Asadollahi Pajouh, M., Lim, S. G., Mirdamadi, A., Briaud, J. L., Abu-Odeh, A., Roesset, J., … Norris, R. (2014). Full scale test and numerical simulation of a truck impacting a group of side by side piles. Proceedings of the geo-congress 2014 technical papers (pp. 1750–1760). Atlanta.
- ASTM Standard F2656. (2007). Standard test method for vehicle crash testing of perimeter barriers. West Conshohocken, PA: ASTM International. doi:10.1520/F2656-07
- Bligh, R. P., Abu-Odeh, A. Y., & Menges, W. L. (2011). MASH test 3-10 on 31-inch W-beam guardrail with standard offset blocks (Research report No. FHWA/TX-11/9-1002-4). Washington, DC: Federal Highway Administration.
- Bligh, R. P., & Menges, W. L. (1997). Testing and evaluation of a modified steel post W-beam guardrail with recycled polyethylene blockouts (Research Report 400001-MPT). College Station, TX: Texas Transportation Institute.
- Briaud, J. (1997). SALLOP: Simple approach for lateral loads on piles. Journal of Geotechnical and Geoenvironmental Engineering, 123(10), 958–964. doi:10.1061/(ASCE)1090-0241(1997)123:10(958)
- Briaud, J. L. (2013). Geotechnical engineering: Unsaturated and saturated soils. New York, NY: John Wiley & Sons.
- Briaud, J. L., & Ballouz, M. (1996). LATWAK: Impact test to obtain pile lateral static stiffness. Journal of Geotechnical Engineering, 122(6), 437–444. doi:10.1061/(ASCE)0733-9410(1996)122:6(437)
- Broms, B. B. (1964a). Lateral resistance of piles in cohesive soils. Soil Mechanics and Foundation Engineering Division American Society of Civil Engineers, 90(SM2), 27–63.
- Broms, B. B. (1964b). Lateral resistance of piles in cohesionless soils. Soil Mechanics and Foundation Engineering Division ASCE, 90(SM3), 123–156.
- Brown, D. A., Morrison, C., & Resse, L. C. (1988). Lateral load behavior of a pile group in sand. Journal of Geotechnical and Geoenvironmental Engineering, ASCE, 114(11), 1261–1276. doi:10.1061/(ASCE)0733-9410(1988)114:11(1261)
- Dobry, R., & Gazetas, G. (1988). Simple method for dynamic stiffness and damping of floating pile groups. Geotechnique, 38(4), 557–574. doi:10.1680/geot.1988.38.4.557
- El Naggar, M., & Novak, M. (1996). Nonlinear analysis for dynamic lateral pile response. Soil Dynamics and Earthquake Engineering, 15(4), 233–244. doi:10.1016/0267-7261(95)00049-6
- Faller, R., Polivka, K., Kuipers, B., Bielenberg, B., Reid, J., Rohde, J. R., & Sicking, D. (2004). Midwest guardrail system for standard and special applications. Transportation Research Record: Journal of the Transportation Research Board, 1890, 19–33.
- Hallquist, J. O. (2007). LS-DYNA keyword user’s manual. Livermore, CA: Livermore Software Technology Corporation.
- Kulhawy, F. K, & Trautmann, C. H. (1996). Estimation of in-situ test uncertainty. Uncertainty in The Geologic Environment: from Theory to Practice. Asce Geotechnical Special Publication, 58, 269–286.
- Matlock, H. (1970). Correlations for design of laterally loaded piles in soft clay. Proceedings of 2nd offshore technology conference (pp. 577–594). Houston, TX.
- Matlock, H., & Reese, L. C. (1960). Generalized solutions for laterally loaded piles. Soil Mechanics and Foundation Engineering Division American Society of Civil Engineers, 86(SM5), 63–91.
- McKay, M. D., Beckman, R. J., & Conover, W. J. (1979). A comparison of three methods for selecting values of input variables in the analysis of output from a computer code. Technometrics, 21(2), 239–245.
- National Crash Analysis Center. (2014, August 20). Washington, DC: George Washington University. Retrieved from http://www.ncac.gwu.edu/research/reports.html
- Nogami, T., Konagai, K., & Otani, J. (1991). Nonlinear time domain numerical model for pile group under transient dynamic forces.
- O’Neill, M. W., Reese, L. C., & Cox, W. R. (1990). Soil behavior for piles under lateral loading. Proceedings of 22nd offshore technology conference (pp. 279–287). Houston, TX. doi:10.1016/0011-2240(90)90027-2
- Rainer, J. (1974). Damping in dynamic structure-foundation interaction. Canadian geotechnical division of building research. Ottawa, Canada: National Research Council of Canada.
- Reese, L. C., & Welch, R. C. (1975). Lateral loading of deep foundations in stiff clay. Journal of Geotechnical Engineering Division American Society of Civil Engineers, 101(GT7), 633–649.
- Roesset, J. M, Whitman, R. V, & Dobry, R. (1973). Modal analysis for structures with foundation interaction. Journal Of The Structural Division. American Society Of Civil Engineers, 99(3), 399–416.
- Smith, E. A. (1960). Pile-driving analysis by the wave equation, journal of the engineering mechanics division proc. Of The American Society Of Civil Engineers, 86(4), 35–61.
- Texas A&M Transportation (TTI). (2009). Medium-duty truck finite element model.
- Wolf, J. P. (1980). Dynamic stiffness of group of battered piles. Journal of the Geotechnical Engineering Division, 106(2), 198–203.
- Wolf, J. P., & Somaini, D. R. (1986). Approximate dynamic model of embedded foundation in time domain. Earthquake Engineering & Structural Dynamics, 14(5), 683–703. doi:10.1002/eqe.4290140502
- Wu, G., & Fin, W. (1997). Dynamic nonlinear analysis of pile foundations using finite element method in the time domain. Canadian Geotechnical Journal, 34, 44–52. doi:10.1139/t96-088